Engage NY Eureka Math 8th Grade Module 6 Lesson 4 Answer Key
Eureka Math Grade 8 Module 6 Lesson 4 Exercise Answer Key
Exercise 1.
Read through each of the scenarios, and choose the graph of the function that best matches the situation. Explain the reason behind each choice.
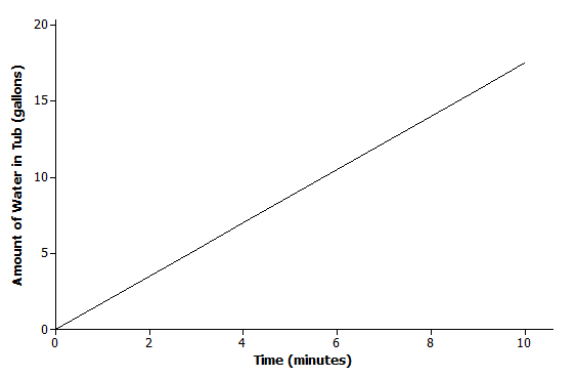
a. A bathtub is filled at a constant rate of 1.75 gallons per minute.
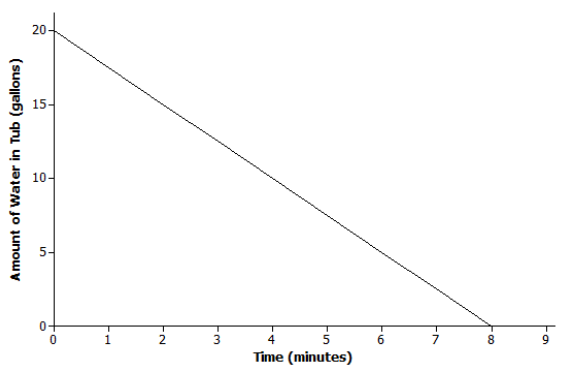
b. A bathtub is drained at a constant rate of 2.5 gallons per minute.
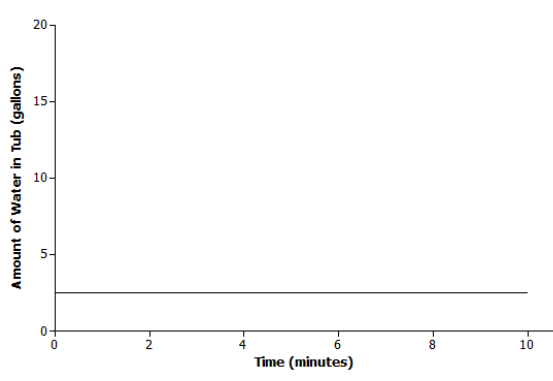
c. A bathtub contains 2.5 gallons of water.
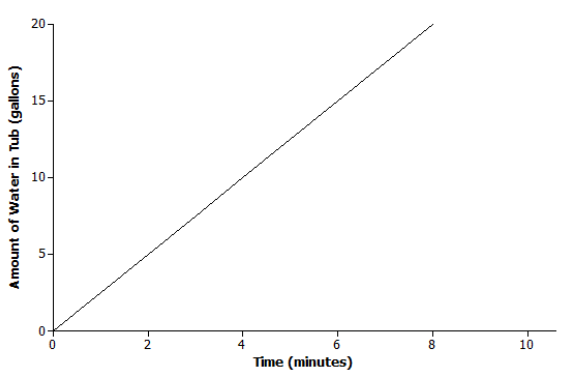
d. A bathtub is filled at a constant rate of 2.5 gallons per minute.
Scenario:
Explanation:
Answer:
Scenario: c
Explanation: The amount of water in the tub does not change over time; it remains constant at 2.5 gallons.
Scenario:
Explanation:
Answer:
Scenario: b
Explanation: The bathtub is being drained at a constant rate of 2.5 gallons per minute. So, the amount of water is decreasing, which means that the slope of the line is negative. The graph of the function also shows that there are initially 20 gallons of water in the tub.
Scenario:
Explanation:
Answer:
Scenario: d
Explanation: The tub is being filled at a constant rate of 2.5 gallons per minute, which implies that the amount of water in the tub is increasing, so the line has a positive slope. Based on the graph, the amount of water is also increasing at a faster rate than in choice (a).
Exercise 2.
Read through each of the scenarios, and sketch a graph of a function that models the situation.
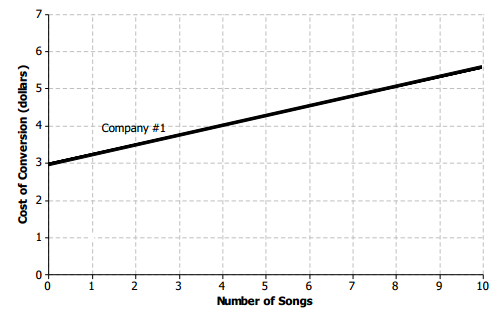
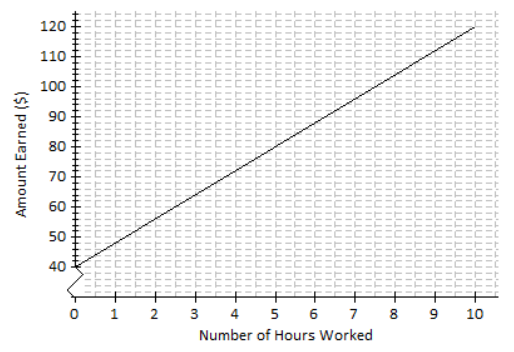
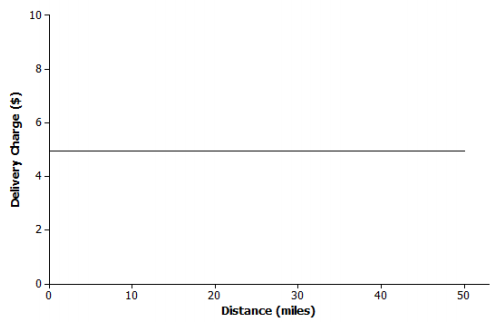
a. A messenger service charges a flat rate of $4.95 to deliver a package regardless of the distance to the destination.
Answer:
Answer:
The delivery charge remains constant regardless of the distance to the destination.
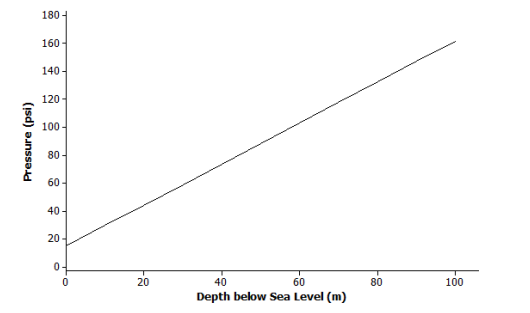
b. At sea level, the air that surrounds us presses down on our bodies at 14.7 pounds per square inch (psi). For every 10 meters that you dive under water, the pressure increases by 14.7 psi.
Answer:
The initial value is 14.7 psi. The function increases at a rate of 14.7 psi for every 10 meters, or 1.47 psi per meter.
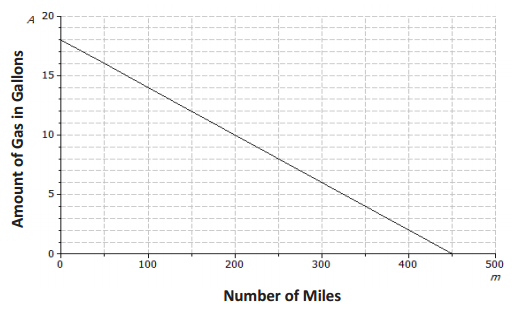
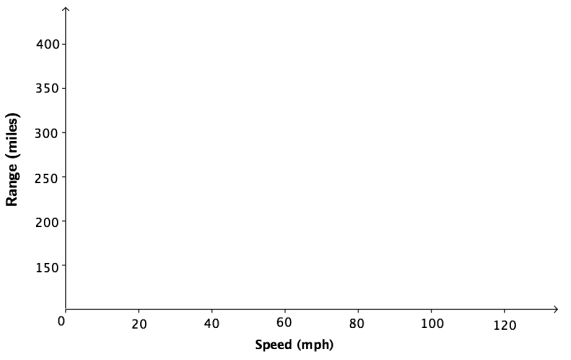
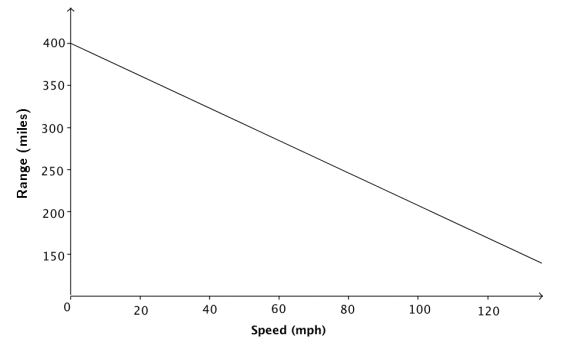
c. The range (driving distance per charge) of an electric car varies based on the average speed the car is driven. The initial range of the electric car after a full charge is 400 miles. However, the range is reduced by 20 miles for every 10 mph increase in average speed the car is driven.
Answer:
The initial value of the function is 400. The function is decreasing by 20 miles for every 10 mph increase in speed. In other words, the function decreases by 2 miles for every 1 mph increase in speed.
Exercise 3.
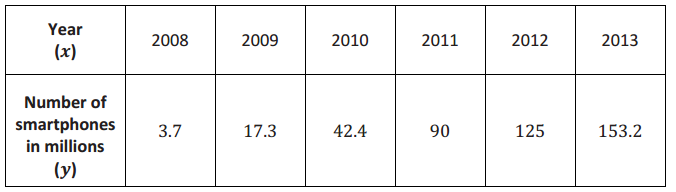
The graph below represents the total number of smartphones that are shipped to a retail store over the course of 50 days.
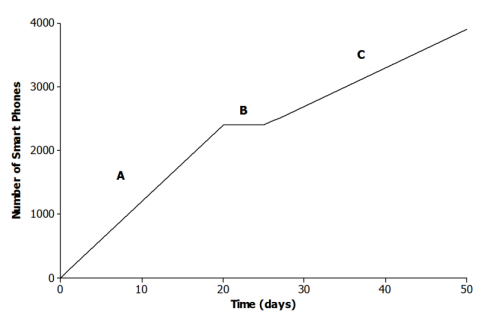
Match each part of the graph (A, B, and C) to its verbal description. Explain the reasoning behind your choice.
i. Half of the factory workers went on strike, and not enough smartphones were produced for normal shipments.
Answer:
C; if half of the workers went on strike, then the number of smartphones produced would be less than normal. The rate of change for C is less than the rate of change for A.
ii. The production schedule was normal, and smartphones were shipped to the retail store at a constant rate.
Answer:
A; if the production schedule is normal, the rate of change of interval A is greater than the rate of change of interval C.
iii. A defective electronic chip was found, and the factory had to shut down, so no smartphones were shipped.
Answer:
B; if no smartphones are shipped to the store, the total number remains constant during that time.
Exercise 4.
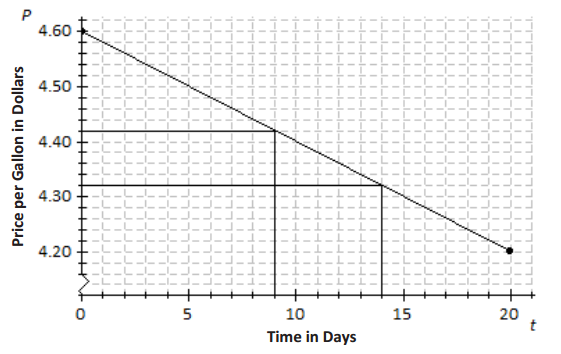
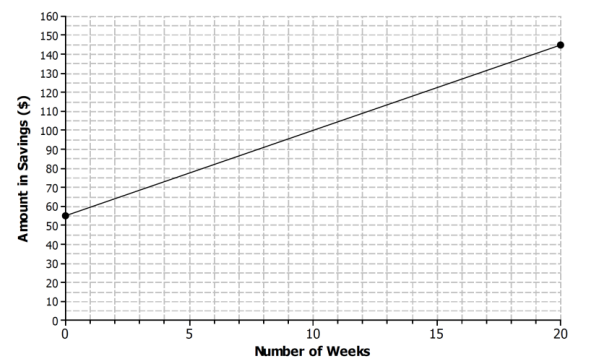
The relationship between Jameson’s account balance and time is modeled by the graph below.
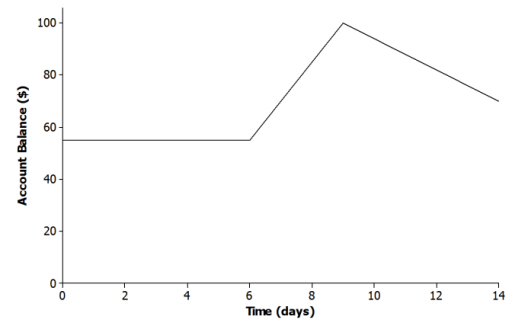
a. Write a story that models the situation represented by the graph.
Answer:
Answers will vary.
Jameson was sick and did not work for almost a whole week. Then, he mowed several lawns over the next few days and deposited the money into his account after each job. It rained several days, so instead of working, Jameson withdrew money from his account each day to go to the movies and out to lunch with friends.
b. When is the function represented by the graph increasing? How does this relate to your story?
Answer:
It is increasing between 6 and 9 days. Jameson earned money mowing lawns and made a deposit to his account each day. The money earned for each day was constant for these days. This is represented by a straight line.
c. When is the function represented by the graph decreasing? How does this relate to your story?
Answer:
It is decreasing between 9 and 14 days. Since Days 9–14 are represented by a straight line, this means that Jameson spent the money constantly over these days. Jameson cannot work because it is raining. Perhaps he withdraws money from his account to spend on different activities each day because he cannot work.
Eureka Math Grade 8 Module 6 Lesson 4 Problem Set Answer Key
Question 1.
Read through each of the scenarios, and choose the graph of the function that best matches the situation. Explain the reason behind each choice.
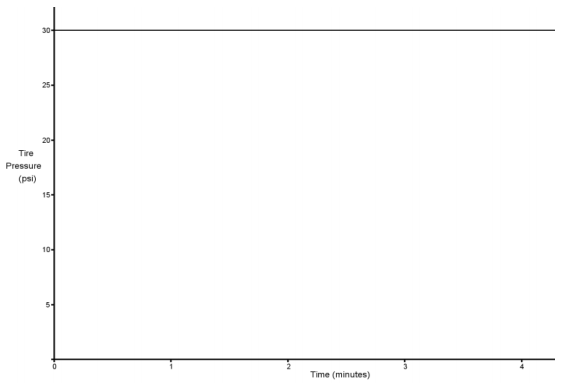
a. The tire pressure on Regina’s car remains at 30 psi.
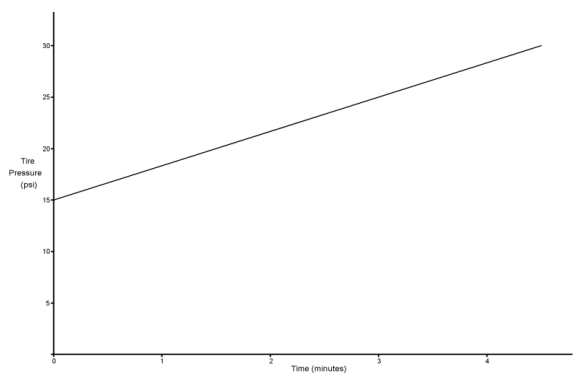
b. Carlita inflates her tire at a constant rate for 4 minutes.
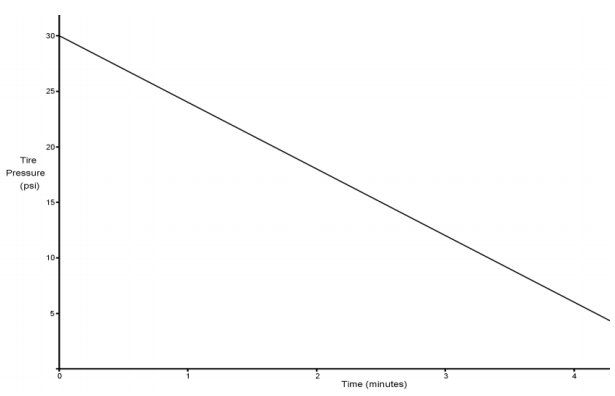
c. Air is leaking from Courtney’s tire at a constant rate.
Scenario:
Explanation:
Answer:
Scenario: c
Explanation: The tire pressure decreases each minute at a constant rate.
Scenario:
Explanation:
Answer:
Scenario: a
Explanation: The tire pressure remains at 30 psi.
Scenario:
Explanation:
Answer:
Scenario: b
Explanation: The tire pressure is increasing each minute at a constant rate for 4 minutes.
Question 2.
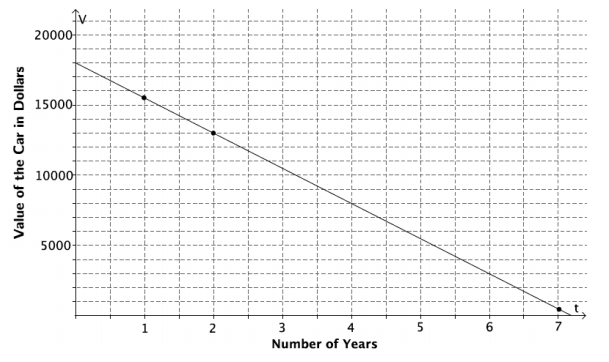
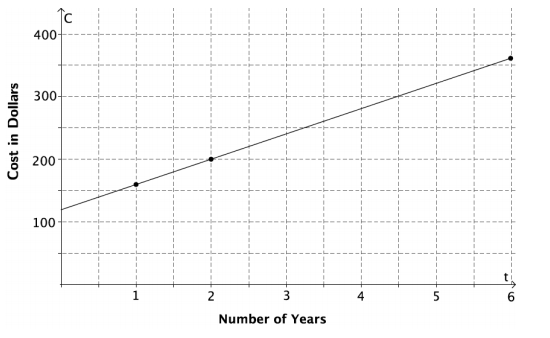
A home was purchased for $275,000. Due to a recession, the value of the home fell at a constant rate over the next 5 years.
a. Sketch a graph of a function that models the situation.
Answer:
Graphs will vary; a sample graph is provided.
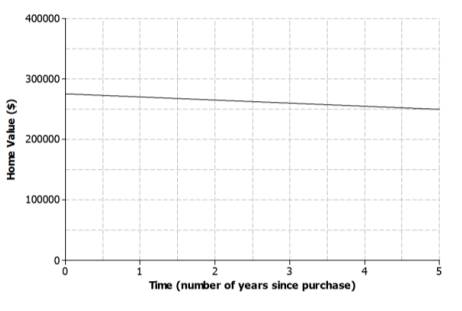
b. Based on your graph, how is the home value changing with respect to time?
Answer:
Answers will vary; a sample answer is provided.
The value is decreasing by $25,000 over 5 years or at a constant rate of $5,000 per year.
Question 3.
The graph below displays the first hour of Sam’s bike ride.
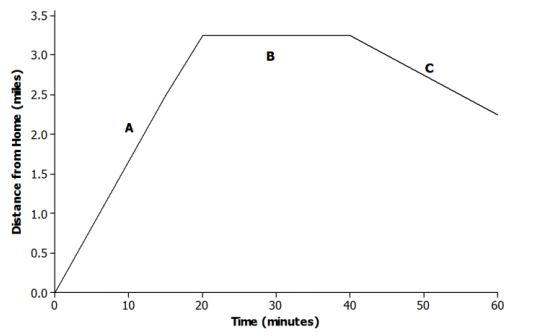
Match each part of the graph (A, B, and C) to its verbal description. Explain the reasoning behind your choice.
i. Sam rides his bike to his friend’s house at a constant rate.
Answer:
A; the distance from home should be increasing as Sam is riding toward his friend’s house.
ii. Sam and his friend bike together to an ice cream shop that is between their houses.
Answer:
C; Sam was at his friend’s house, but as they start biking to the ice cream shop, the distance from Sam’s home begins to decrease.
iii. Sam plays at his friend’s house.
Answer:
B; Sam remains at the same distance from home while he is at his friend’s house.
Question 4.
Using the axes below, create a story about the relationship between two quantities.
a. Write a story about the relationship between two quantities. Any quantities can be used (e.g., distance and time, money and hours, age and growth). Be creative. Include keywords in your story such as increase and decrease to describe the relationship.
Answer:
Answers will vary. Give students the freedom to write a basic linear story or a piecewise story.
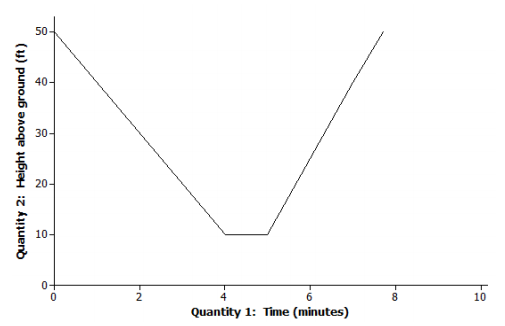
A rock climber begins her descent from a height of 50 feet. She slowly descends at a constant rate for 4 minutes. She takes a break for 1 minute; she then realizes she left some of her gear on top of the rock and climbs more quickly back to the top at a constant rate.
b. Label each axis with the quantities of your choice, and sketch a graph of the function that models the relationship described in the story.
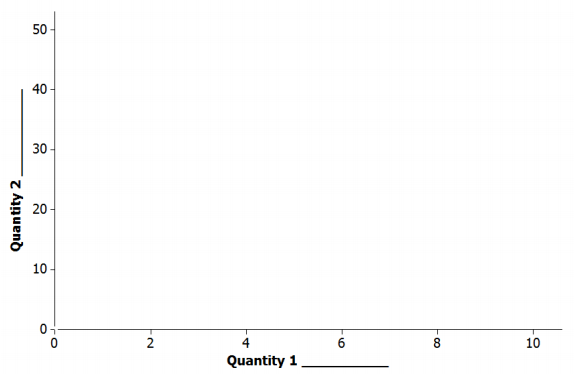
Answer:
Answers will vary based on the story from part (a).
Eureka Math Grade 8 Module 6 Lesson 4 Exit Ticket Answer Key
Question 1.
The graph below shows the relationship between a car’s value and time.
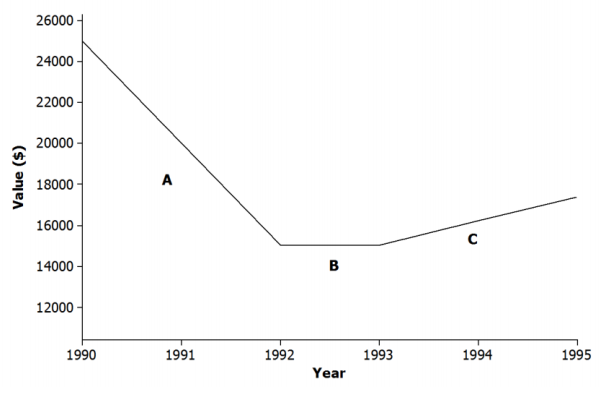
Match each part of the graph (A, B, and C) to its verbal description. Explain the reasoning behind your choice.
i. The value of the car holds steady due to a positive consumer report on the same model.
Answer:
B; if the value is holding steady, there is no change in the car’s value between years.
ii. There is a shortage of used cars on the market, and the value of the car rises at a constant rate.
Answer:
C; if the value of the car is rising, it represents an increasing function.
iii. The value of the car depreciates at a constant rate.
Answer:
A; if the value depreciates, it represents a decreasing function.
Question 2.
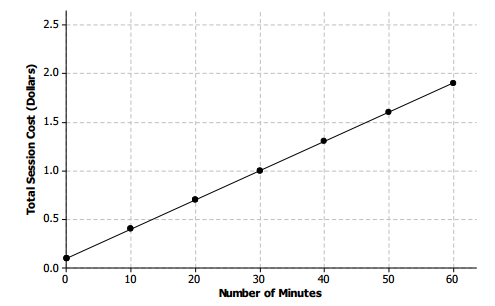
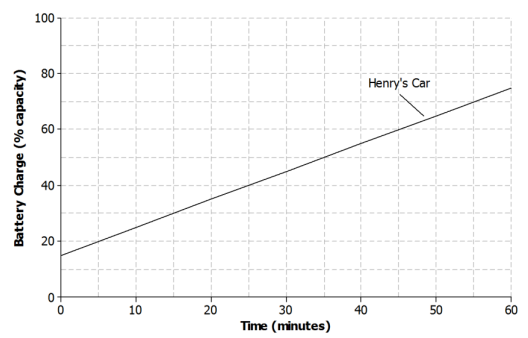
Henry and Roxy both drive electric cars that need to be recharged before use. Henry uses a standard charger at his home to recharge his car. The graph below represents the relationship between the battery charge and the amount of time it has been connected to the power source for Henry’s car.
Answer:
a. Describe how Henry’s car battery is being recharged with respect to time.
Answer:
The battery charge is increasing at a constant rate of 10% every 10 minutes.
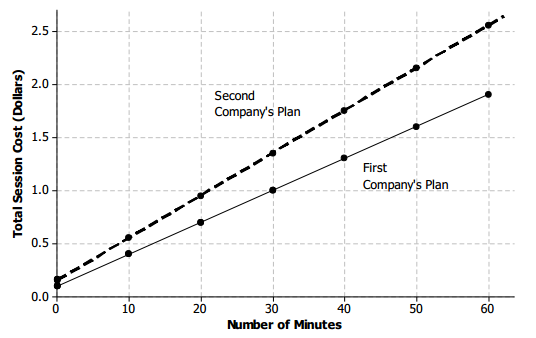
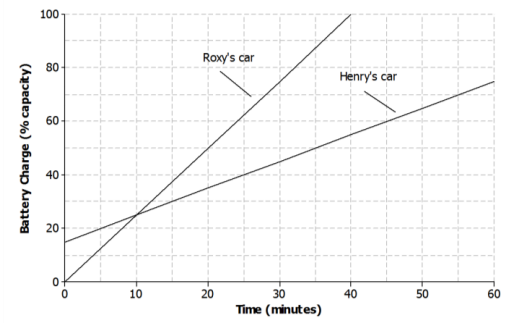
b. Roxy has a supercharger at her home that can charge about half of the battery in 20 minutes. There is no remaining charge left when she begins recharging the battery. Sketch a graph that represents the relationship between the battery charge and the amount of time on the axes above. Assume the relationship is linear.
Answer:
See the above graph.
c. Which person’s car will be recharged to full capacity first? Explain.
Answer:
Roxy’s car will be completely recharged first. Her supercharger has a greater rate of change compared to Henry’s charger.