Tally marks are most ordinarily used to represent the scoreboard in games and sports. The frequency of knowledge is often represented using Tally Marks. Tally Marks are also called Hash Marks. It is denoted by a single vertical bar ‘ | ‘. You may use the tally for solving addition, subtraction, or word problems. Before numbers were invented people found it difficult to stay records of their belongings and then they used to count by sticks which are further referred to as Tally Marks.
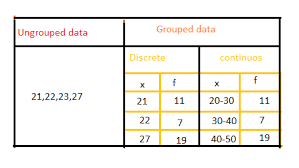
Read More: Frequency Distribution of Ungrouped and Grouped Data
Tally Marks – Definition
Tally marks are defined as a way to record or mark your counting. It is a numeral system used to make counting easier. The general way of tally marks writing may be a group or set of 5 lines, in these five lines first four lines are drawn vertically and each fifth line runs diagonally over the four vertical lines it means from the top of the first line to the bottom of the fourth line.
Tally marks are commonly used for counting the points, scores, many people like that, these tally marks will differ from country to country because each country has developed with their own system. The tally marks are expressed as shown below
Counting Tally Marks
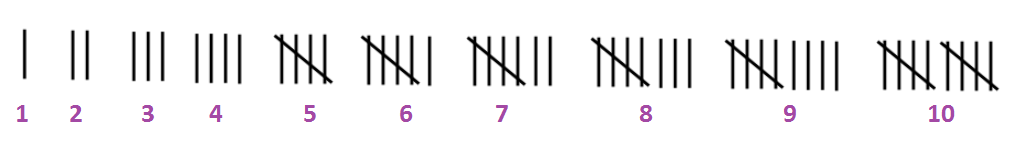
Let us see how to use tally marks for counting numbers 1 to 10. Tally marks are the quickest way of keeping track of numbers during a group of five.

How to represent the numbers in Tally Marks?
- One is represented by ‘I’
- Two is represented by ‘II’
- Three is represented by ‘III’
- Four is represented by ‘IIII’
- Five is not represented by ‘IIIII’, it is represented as four vertical lines and one cross line (diagonal line) it means from the top of the first line to the bottom of the fourth line.
- Six is represented by a set of five lines with ‘I’
- Seven is represented by the set of five lines with ‘II’
- Eight is represented by the set of five lines with ‘III’
- Nine is represented by the set of five lines with ‘IIII’
- Ten is represented by 2 (two) sets of five lines.
Tally Mark Chart
Tally charts are used to collect the data efficiently and quickly. A Tally Mark chart or a Tally Mark graph is a graphical representation of data in statistics, so it is beneficial in scanning the data. A tally chart filling with marks is represented by numbers is quicker than writing out figures or words, then the information is collected into sub-groups, making it easy to research.
In a tally mark graph has first four numbers lines are represented by vertical lines and the fifth line is represented by a diagonal (/) line across the four vertical lines. The tally marks chart contains the number from 1 to 10 is as shown below,
Tally Marks are used for finding the frequency of the set of data values specifically for the raw data or ungrouped data. consider an example, asked to create the frequency distribution provided with raw data or random values. In this case, we may have to make either for class intervals or individual observations.
Now, we count all occurrences of a single data value or a class interval in one go, then we have to cross-check the entire list again and again for the next class interval or individual observation. Therefore this will be taking a lot of time for finishing. So, we can be reducing the complexity by making use of tally marks. The entire process can be done just by adding tally marks for each class interval or different observations.
Thus, we’ve to traverse the whole list of given data set on one occasion and then write the frequency numbers by counting the tally marks after completing the identification. So the obtained table is defined as the frequency distribution of the given data. The below example on tally marks will help you to understand the concept in a better way.
Tally Marks Examples
Example 1:
Below given the marks of 35 students on the Maths test (out of 10). Arrange those marks in tabular form using tally marks?
6, 1, 7, 8, 10, 9, 4, 2, 3, 7, 1, 8, 7, 5, 1, 4, 7, 6, 5, 2, 3, 8, 2, 4, 6, 2, 9, 3, 1, 4, 5, 7, 5, 10. Find the
- How many students scored more than 8 marks?
- How many students scored less than & equal to 5?
- What are the marks scored by the maximum students? what is the number of students?
Solution:
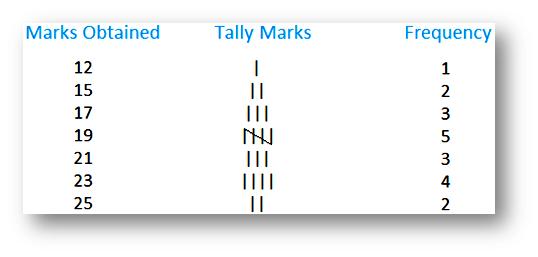
Given the marks of 35 students in Maths test. The frequency table of given data is as shown below
| Marks | Number of students (Frequency) | Tally Marks |
|---|---|---|
| 1 | 4 | IIII |
| 2 | 4 | IIII |
| 3 | 3 | III |
| 4 | 4 | IIII |
| 5 | 4 | IIII |
| 6 | 4 | IIII |
| 7 | 4 | IIII |
| 8 | 3 | III |
| 9 | 3 | III |
| 10 | 2 | II |
| Total | 35 |
(i) Given the 35 students’ marks out of 10 in the maths test.
Now, we can find the number of students with more than 8,
The number of students with more than 8 marks is, 3 + 2 = 5
Therefore the total number of students with more than 8 marks is 5.
(ii) Given the 35 students’ marks out of 10 in the maths test.
Now, we can find the number of students who scored less than and equal to 5.
The number of students who scored less than and equal to 5 is,
= 4 + 4+ 3+ 4 + 4
= 19
Therefore, the number of students who scored less than and equal to 5 is 19.
(iii) Given the 35 students’ marks out of 10 in the maths test.
Now, we can find the maximum number of students who scored 5 marks.
The maximum number of students who scored 5 marks is 5.
The maximum number of students scored 5 marks. The number of students is 5.
FAQ’S on Tally Marks
1. What is Tally Mark Chart?
Tally Mark charts are used to collect the data efficiently and quickly. A Tally Mark chart is a graphical representation of data in statistics, so it is beneficial in scanning the data. A tally chart filling with marks is represented by numbers is faster than writing out figures or words, then the data is collected into sub-groups, making it easy to analyze.
2. Define Tally Frequency Table?
The Tally Frequency table is defined as a method of collecting the data with the tally marks, tally frequency table is also known as Tally Chart.
3. Why should Tally marks be essential?
Tally marks are very important mainly use to keep the record of a running or continuous count. These tally marks are so useful for maintaining and recording the scores in a game or a sport.
5. What are the advantages of Tally Marks?
The advantages of tally marks are
- Enables Effortlessness in data movements
- Fewer expenses on data collection and data transfer of files.
- Helps for easy and fast documents access.
 Pictogram: A Pictogram is one of the simplest and most popular forms of data visualization out there. Also known as “pictographs”, “icon charts”, “picture charts”, and “pictorial unit charts”, pictograms use a series of repeated icons to visualize simple data.
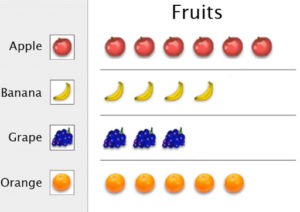 Histogram: A histogram is a display that indicates the frequency of specified ranges of continuous data values on a graph in the form of immediately adjacent bars. Interval is a range of data in a data set. The different types of a histogram are uniform histogram, symmetric histogram, bimodal histogram, probability histogram.
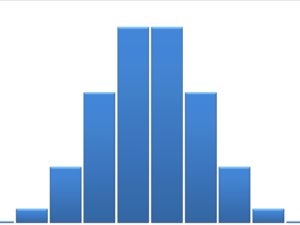
 Multiplication Table of 3 up to 20 | How to write Table of 3?

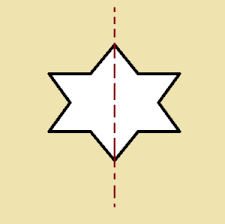

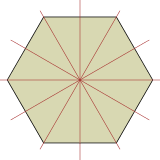
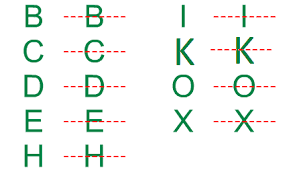 Some other types of lines of symmetries are there. Those are three lines of symmetry, four lines of symmetry, five lines of symmetry, six lines of symmetry, and infinite lines of symmetry.
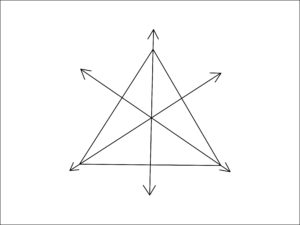
 Five Lines of Symmetry
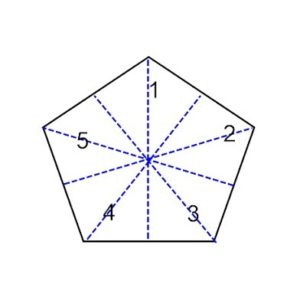

![What is Metric System? - [Definition, Facts & Example]](https://cdn-skill.splashmath.com/panel-uploads/GlossaryTerm/9987f824e4b944fcbbbcc69e0a7c24b3/1564739569_metricsystem-1.png)