Do you feel maths is a difficult subject and worried about the test? If yes, then don’t worry we are here to help you out to overcome the difficulties in maths. Get free access to download Big Ideas Math Answers 2nd Grade 13th Chapter Represent and Interpret Data pdf from this page. Students can find various tricks to solve the questions. Learn how to represent data in different ways with the help of BIM Book Grade 2 Chapter 13 Represent and Interpret Data Answers.
Big Ideas Math Book Grade 2 Answer Key Chapter 13 Represent and Interpret Data
It is necessary for the students to go through the topics included in this chapter before starting their preparation. The list of lessons in Chapter 13 Represent and Interpret Data are Sort and Organize Data, Real and Interpret Picture Graphs, Make Picture Graphs, Real and Interpret Bar Graphs, Make Bar Graphs, Make Line Plots, and Measure Objects and Make Line Plots.
You can understand the concepts quickly and easily by referring to Big Ideas Math Answers Grade 2 Chapter 13 Represent and Interpret Data. The quick links are attached at the end for the reference of students.
Vocabulary
Lesson: 1 Sort and Organize Data
Lesson: 2 Real and Interpret Picture Graphs
- Lesson 13.2 Real and Interpret Picture Graphs
- Real and Interpret Picture Graphs Homework & Practice 13.2
Lesson: 3 Make Picture Graphs
Lesson: 4 Real and Interpret Bar Graphs
Lesson: 5 Make Bar Graphs
Lesson: 6 Make Line Plots
Lesson: 7 Measure Objects and Make Line Plots
- Lesson 13.7 Measure Objects and Make Line Plots
- Measure Objects and Make Line Plots Homework & Practice 13.7
Chapter- 13: Represent and Interpret Data
- Represent and Interpret Data Performance Task
- Represent and Interpret Data Activity
- Represent and Interpret Data Chapter Practice
Represent and Interpret Data Vocabulary

Organize It
Use the review words to complete the graphic organizer.
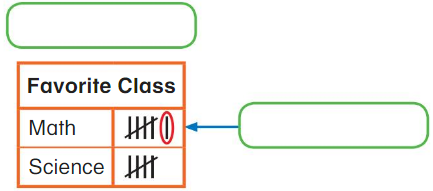
Answer:
The number of students who choose math = 6.
The number of students who choose science = 5
Explanation:
In the above-given figure,
the number of students who choose math = 6
the number of students who choose science = 5
the more number of students choose maths than science.
.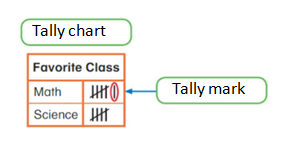
Organize It
Use your vocabulary cards to identify the word.
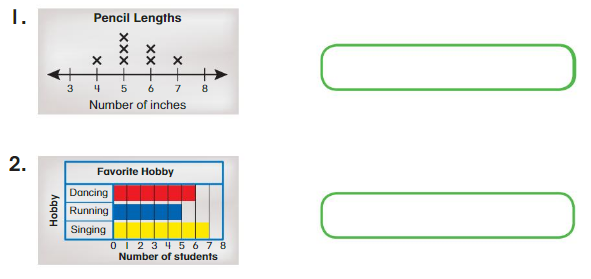
Answer:
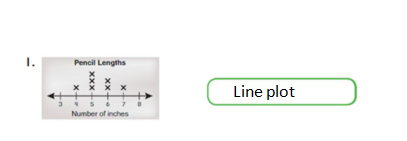
1. The pencil lengths of each student = 4, 5, 6, and 7.
Explanation:
The number of pencil lengths of all students = 4, 5, 6, and 7.
the max length of the pencil = 5
In the above-given figure is a line plot.
given that the pencil lengths in inches = 4, 5, 6, and 7.
Answer:
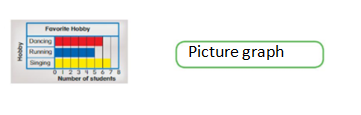
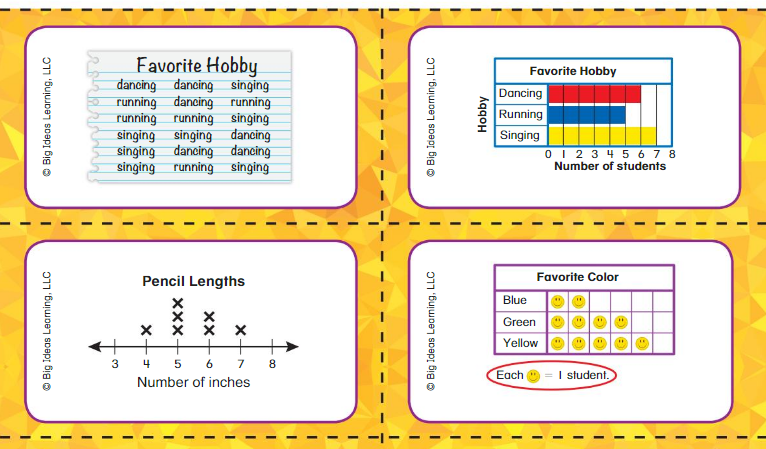
2. The more number of students whose favorite hobby is singing = 7.
Explanation:
In the above-given figure,
the total number of students = 8
the number of students whose favorite hobby dancing = 6.
the number of students whose favorite hobby running = 5.
the number of students whose favorite hobby singing = 7.
The more number of students whose favorite hobby is singing = 7.
Lesson 13.1 Sort and Organize Data
Explore and Grow
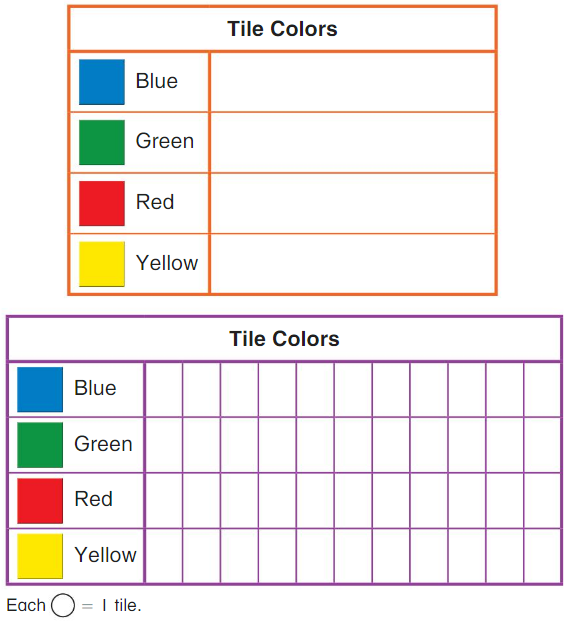
Look at your color tiles. Complete the tally chart.
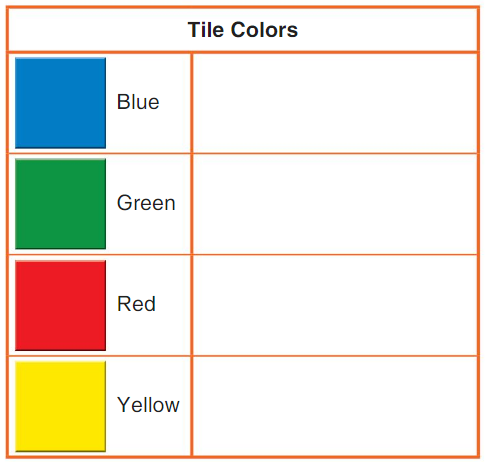
Answer:
The tile colors are blue, green, red, and yellow.
Explanation:
In the above-given figure,
given the tile, colors are blue, green, red, and yellow.
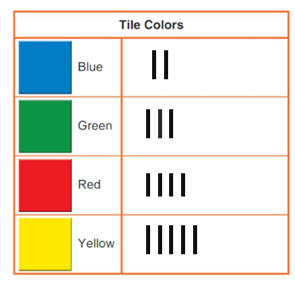
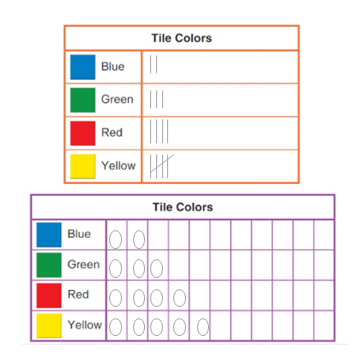
Write and answer a question about your tally chart.
Answer:
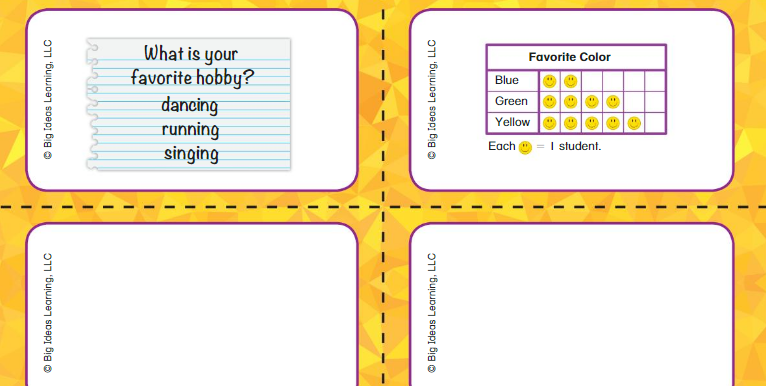
The more number of students they choose yellow = 5.
Explanation:
In the above-given figure,
the number of students who choose blue = 2.
the number of students who choose green = 3.
the number of students who choose red = 4.
the number of students who choose yellow = 5.
the more number of students who choose yellow = 5.
Show and Grow
Question 1.
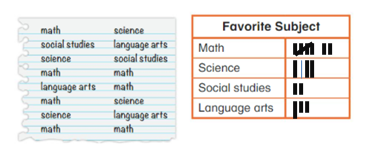
Use the data to complete the tally chart.
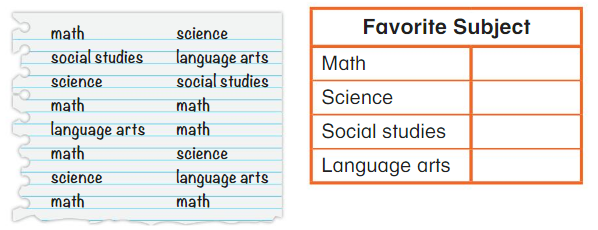
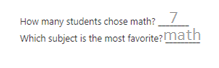
How many students chose math? ________
Which subject is the most favorite? _________
Answer:
The students who choose math = 7.
The most favorite subject = math.
Explanation:
The students who choose math = 7.
The students who choose science = 4.
The students who choose social studies = 2.
The students who choose language arts = 3.
Apply and Grow: Practice
Question 2.
Use the data to complete the tally chart.
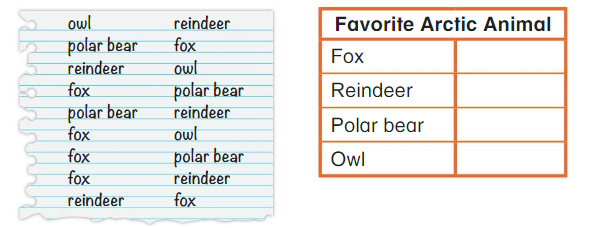
Which animal is the least favorite? ________
How many students did not choose fox? How do you know?
Answer:
The least favorite animal = owl
the students did not choose fox = 12.
Explanation:
In the above-given figure,
the least favorite animal = owl.
the students did not choose fox = 12.
the total number of students = 18
18 – 6 = 12
12 students did not choose fox.
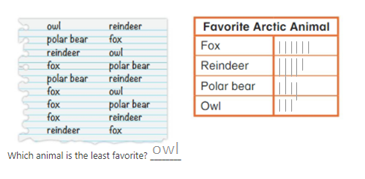
Did more students choose fox or owl?
_______
How many more? ______ more
Did fewer students choose reindeer or polar bear?
________
How many fewer? ______ fewer
Answer:
The more students choose fox = 7.
the more students = 7
the fewer students choose a polar bear.
fewer = 3
Explanation:
The students who choose fox = 7.
the students who choose more = 7
the students who choose fewer = polar bear
polar bear = 3

Question 3.
Reasoning
Which sentences are correct?
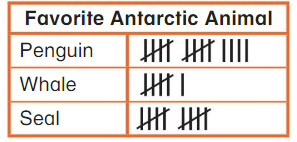
You survey 30 students.
11 students chose whale.
4 more students chose seal than penguin.
20 students did not choose seal.
Answer:
4 more students choose seal than penguin is correct.
Explanation:
In the above-given figure,
the penguin = 14
whale = 6
seal = 10
Think and Grow: Modeling Real Life
Newton wants to survey25 students. How many more students does he need to survey?
Addition equation:
_______ students
Answer:
The more students does he need to survey = 6 students.
Explanation:
In the above-given figure,
the total number of students = 19.
newton wants 25 students.
19 + 6 = 25

Show and Grow
Question 4.
Descartes wants to survey 20 students. How many more students does he need to survey?
_______ students
Answer:
The more students do he need to survey = 2 students.
Explanation:
In the above-given figure,
the total number of students = 18.
Descartes wants 20 students.
18 + 2 = 20.
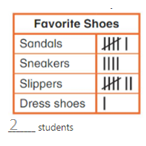
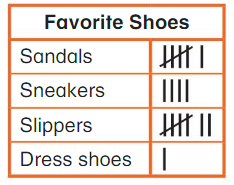
How many more students need to choose sneakers so that the numbers of students who choose sneakers and sandals are equal?
______ students
Answer:
The students need to choose sneakers so that the number of students who choose sneakers and sandals is equal = 2 students.
Explanation:
In the above-given figure,
the sandals = 6
sneakers = 4
6 – 4 = 2
2 students.
Sort and Organize Data Homework & Practice 13.1
Question 1.
Use the data to complete the tally chart.
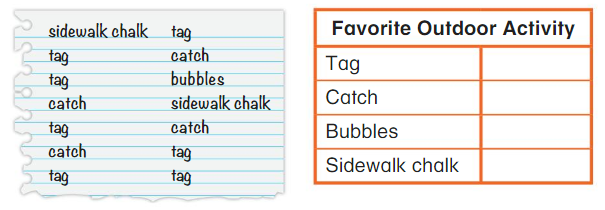
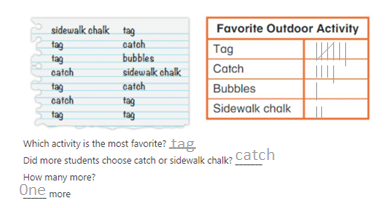
Which activity is the most favorite? _______
Did more students choose catch or sidewalk chalk? _______
How many more?
______ more
Answer:
The activity the most favorite = tag.
The more students choose catch than sidewalk chalk.
0ne more.
Explanation:
The most favorite activity = tag.
Most students choose catch than the sidewalk.
sidewalk = 2
catch = 4
bubbles are more.
Question 2.
Modeling Real Life
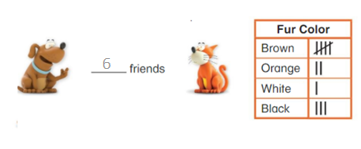
Newton wants to survey 15 friends. How many more friends does he need to survey?
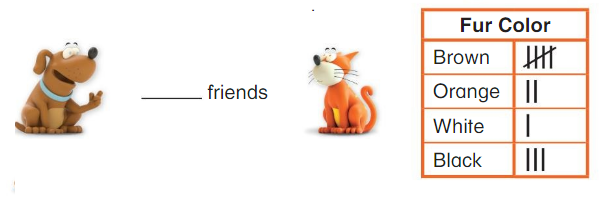
Answer:
The more friends he needs to survey = 4.
Explanation:
Given that newton wants 15 friends to survey.
but in the figure, he has only 11 friends.
11 + 4 = 15
the more friends he wants to survey = 4
Question 3.
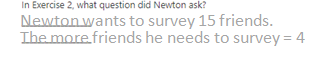
Writing
In Exercise 2, what question did Newton ask?
__________________
__________________
Answer:
Newton wants to survey 15 friends.
Explanation:
In the above-given question, he wants to survey more friends.
the more friends = 4
in the figure given that 11 friends.
11 + 4 = 15.
Question 4.
Modeling Real Life
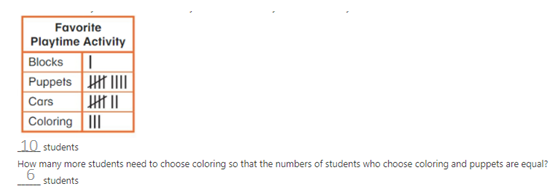
You want to survey 30 students. How many more students do you need to survey?
______ students
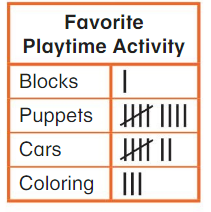
How many more students need to choose coloring so that the numbers of students who choose coloring and puppets are equal?
______ students
Answer:
The more students you need to survey = 10 students.
Explanation:
In the above-given figure,
The total number of students = 20
The more number of students you need to survey = 10.
Review & Refresh
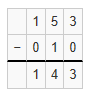
Question 5.
153 − 10 = ______
Answer:
153 – 10 = 143
Explanation:
153 – 10 = 143
Question 6.
978 − 10 = ______
Answer:
978 – 10 = 968
Explanation:
978 – 10 = 968

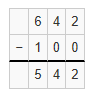
Question 7.
642 − 100 = ______
Answer:
642 – 100 = 542
Explanation:
642 – 100 = 542
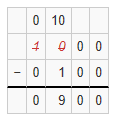
Question 8.
1,000 −100 = ______
Answer:
1000 – 100 = 900
Explanation:
1000 – 100 = 900
Lesson 13.2 Real and Interpret Picture Graphs
Explore and Grow
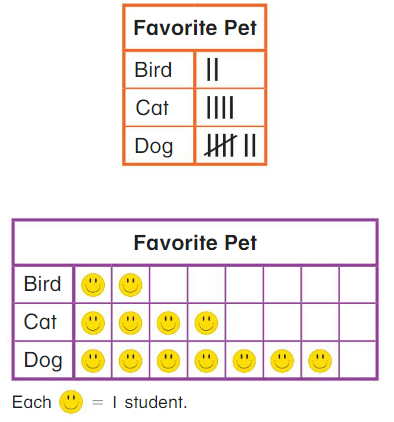
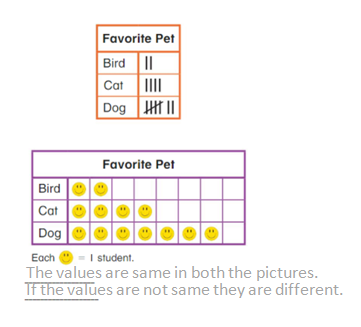
How are the tally chart and the picture graph the same? How are they different?
__________________
___________________
Answer:
Yes, the tally chart and picture graph represents the same.
Explanation:
The favorite bird = 2.
cat = 4
dog = 7.
So in the tally chart and the picture graph represents the same.
Show and Grow
Question 1.
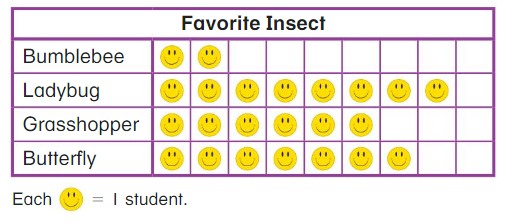
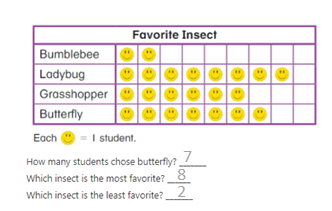
How many students chose butterfly? _______
Which insect is the most favorite? ______
Which insect is the least favorite? _______
Answer:
The students who choose butterfly = 7
The most favorite insect= 8
The least favorite insect = 2
Explanation:
In the above-given figure,
The insects bumblebee = 2
ladybug = 8
grasshopper = 6
butterfly = 7
The students who choose butterfly = 7
The most favorite insect= 8
The least favorite insect = 2
Apply and Grow: Practice
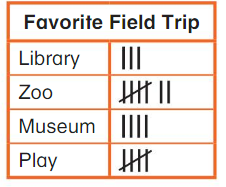
Question 2.
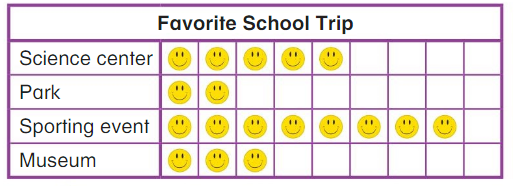
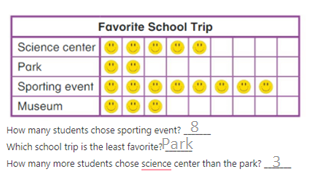
How many students chose sporting event? _______
Which school trip is the least favorite? _______
How many more students chose science center than the park? _______
Answer:
The students who choose sporting event = 8
The least favorite school trip = park
The more students who choose science center than the park = 3
Explanation:
In the above-given figure,
the science center = 5
park = 2
sporting event = 8
museum = 3
The students who choose sporting event = 8
The least favorite school trip = park
The more students who choose science center than the park = 3
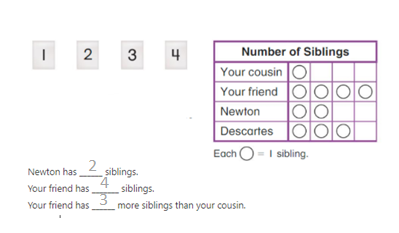
Question 3.
Number Sense
Use the numbers to complete the sentences.
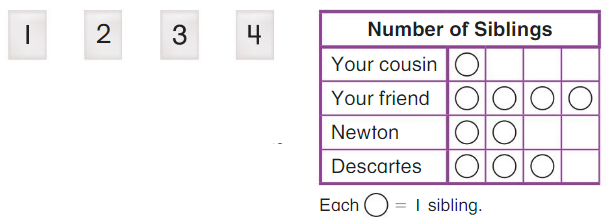
Newton has ______ siblings.
Your friend has _______ siblings.
Your friend has ______ more siblings than your cousin.
Answer:
Newton has 2 siblings.
your friend has 4 siblings.
your friend has 3 more siblings than your cousin.
Explanation:
In the above-given figure,
your cousin has 1 sibling.
your friend has 4 siblings.
newton has 2 siblings.
Descartes has 3 siblings.
Think and Grow: Modeling Real Life
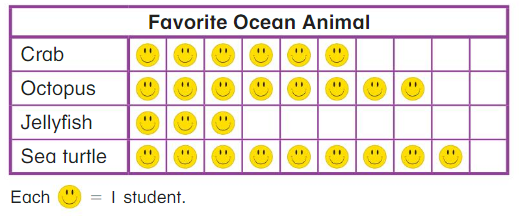
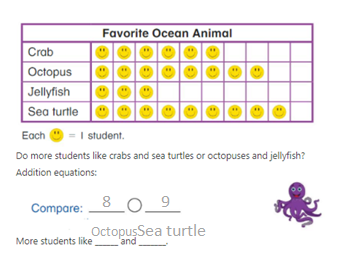
Do more students like crabs and sea turtles or octopuses and jellyfish?
Addition equations:

More students like ______ and _______.
Answer:
The more students like sea turtle = 9
More students like octopus and sea turtle.
Explanation:
In the above-given figure,
the students like crab = 6
the students who like octopus = 8
the students who like jellyfish = 3
the students who like sea turtle = 9
The more students like sea turtle = 9
More students like octopus and sea turtle.
Show and Grow
Question 4.
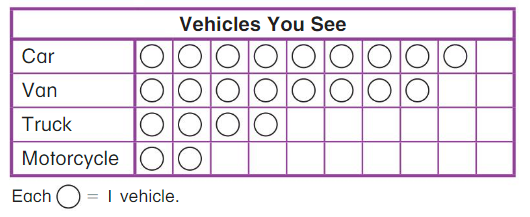
Do you see more cars and motorcycles or vans and trucks?
You see more _______ and ______.
Answer:
We see more cars.
Explanation:
In the above-given figure,
the cars = 9
vans = 8
truck 4
motorcycles = 2
we see more cars than other vehicles.
Real and Interpret Picture Graphs Homework & Practice 13.2
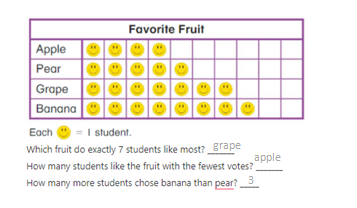
Question 1.
Which fruit do exactly 7 students like most? _______
How many students like the fruit with the fewest votes? _______
How many more students chose banana than pear? _____
Answer:
The fruits exactly 7 students like most = banana.
the students who like the fewest = apple.
the more students choose banana than pears = 3
Explanation:
In the above-given figure,
The students who like apple = 4
the students who like pears = 5
The students who like grapes = 7
the students who like banana = 8
The fruits exactly 7 students like most = banana.
the students who like the fewest = apple.
the more students choose banana than pears = 3
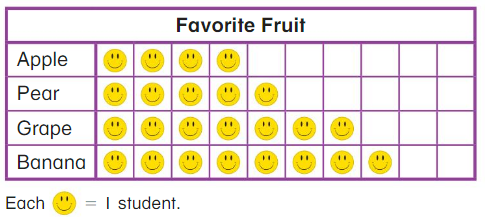
Question 2.
Writing
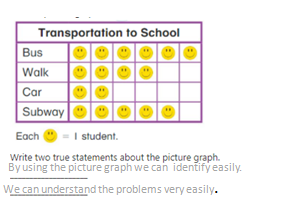
Use the picture graph.
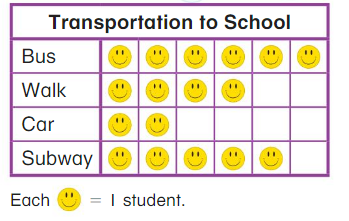
Write two true statements about the picture graph.
____________________
____________________
Answer:
The students who choose bus = 6
The students who choose walk= 4
The students who choose car = 2
The students who choose subway = 5
Explanation:
In the above- given figure,
the students who choose bus = 6
The students who choose walk= 4
The students who choose car = 2
The students who choose subway = 5
the more students choose the bus.
fewer students choose cars.
Question 3.
Modeling Real Life
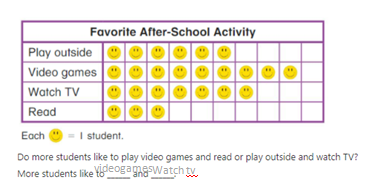
Use the picture graph.
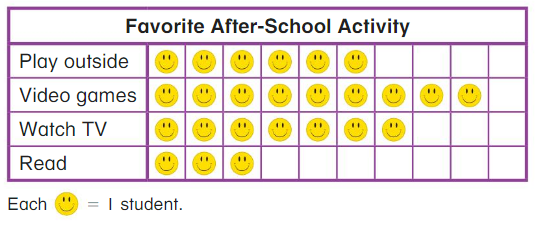
Do more students like to play video games and read or play outside and watch TV?
More students like to ______ and ______.
Answer:
The more students like to play video games.
Explanation:
In the above-given figure,
the students who like to play outside = 6
the students who like to play video games = 9
the students who like to watch tv= 7
the students who like to read = 3
the more students like to play videogames and watching tv
Review & Refresh
Question 4.
What is the best estimate of the length of a keyboard?
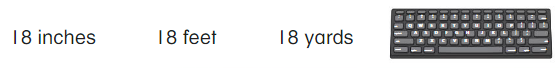
Answer: 18 inches
Lesson 13.3 Make Picture Graphs
Explore and Grow
Look at your color tiles. Complete the tally chart and the picture graph.
Answer:
The number of students who like blue = 2
The number of students who like green = 3
The number of students who like red = 4
The number of students who like yellow = 5
Show and Grow
Question 1.
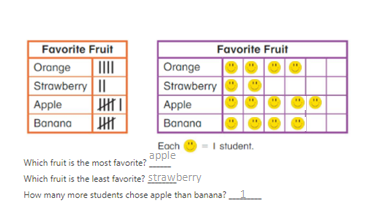
Complete the picture graph.
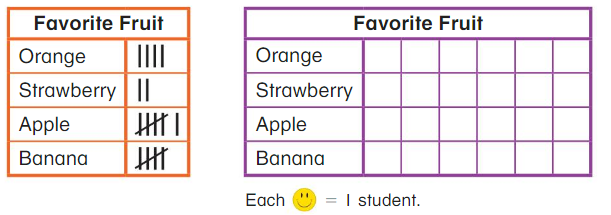
Which fruit is the most favorite? ______
Which fruit is the least favorite? ________
How many more students chose apple than banana? _________
Answer:
The favorite fruit = apple.
the least favorite = strawberry
The students choose apple than banana = 1
Explanation:
In the above-given figure,
The students who choose orange = 4
The students who choose strawberry = 2
The students who choose apple = 6
The students who choose banana = 5
The favorite fruit = apple.
the least favorite = strawberry
The students choose apple than banana = 1
Apply and Grow: Practice
Question 2.
Complete the picture graph.
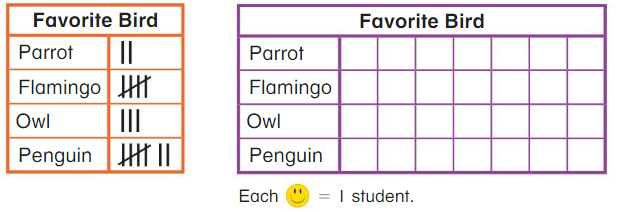
How many students chose the most favorite bird? ________
How many students chose flamingo or penguin? _______
Answer:
The students who choose penguin = 7
the students who choose flamingo or penguin = 6 or 7
Explanation:
In the above-given figure,
the students who choose penguin = 7
the students who choose flamingo = 5
the students who choose own = 3
the students who choose parrot = 2
The students who choose penguin = 7
the students who choose flamingo or penguin = 6 or 7

Question 3.
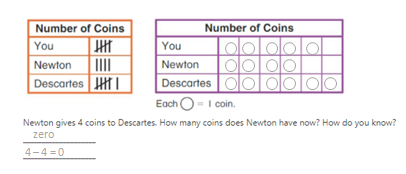
Complete the picture graph.
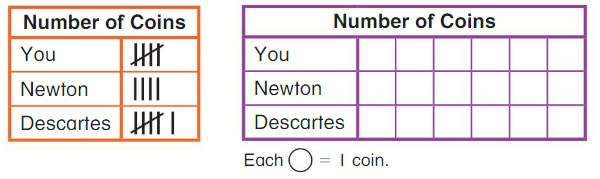
Newton gives 4 coins to Descartes. How many coins does Newton have now? How do you know?
____________________
____________________
Answer:
Newton has zero coins.
Explanation:
In the above-given figure,
the newton has 4 coins.
Descartes has 6 coins.
I have 6 coins.
Given that newton gives 4 coins to Descartes.
so newton has 0 coins.
Think and Grow: Modeling Real Life
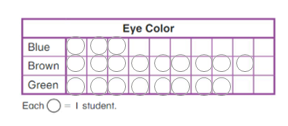
You ask 20 students to name their eye colors. 9 have brown eyes. 3 more students have brown eyes than blue eyes. The rest have green eyes. Complete the picture graph.
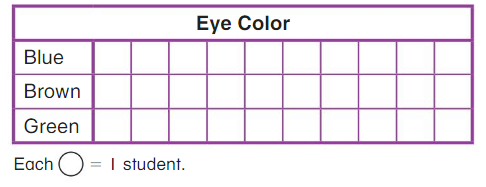
Answer:
The students who have green eyes = 8
Explanation:
In the above-given question, given that
9 have brown eyes.
3 students have blue eyes.
the students who have green = 8
20 – 8 = 12
9 + 3 = 12.
Show and Grow
Question 4.
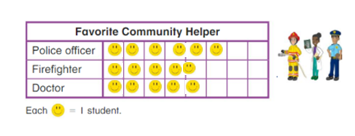
You ask 15 students which community helper is their favorite. 6 choose police officer. 2 fewer students choose doctor than police officer. The rest choose firefighter. Complete the picture graph.
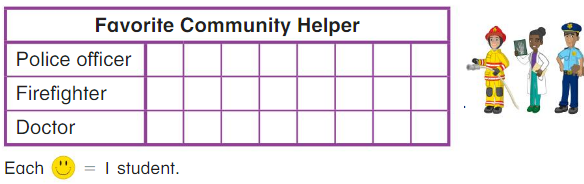
How did you find how many students chose firefighter?
Answer:
The students who choose firefighter = 5
Explanation:
The students who choose police officer = 6
The students who choose doctor = 2
The students who choose fire fighter= 5
8 + 5 = 15
15 – 10 = 5
Make Picture Graphs Homework & Practice 13.3
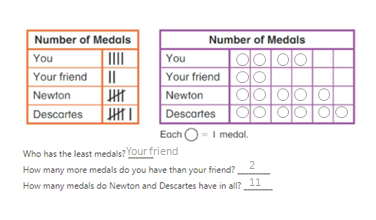
Question 1.
Complete the picture graph.
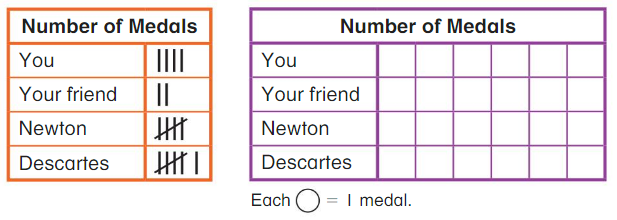
Who has the least medals? _______
How many more medals do you have than your friend? _________
How many medals do Newton and Descartes have in all? ________
Answer:
Your friend has the least medals.
the medals I have more than my friend = 2
Newton and Descartes have all the medals = 11
Explanation:
In the above-given figure,
I have 4 medals.
my friend has 2 medals.
Newton has 5 medals.
descartes have 6 medals.
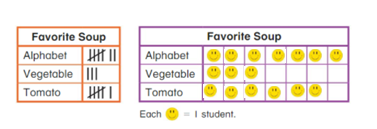
Question 2.
Complete the picture graph.
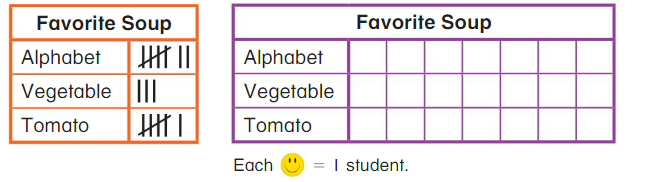
2 more students chose tomato soup. How many students chose tomato now? How do you know?
Answer:
The students who choose tomato soup = 8
Explanation:
In the above-given figure,
The students who choose alphabet = 7
The students who choose vegetable = 3
the students who choose tomato = 6
given that 2 more students choose tomato soup.
6 + 2 = 8
Question 3.
Modeling Real Life
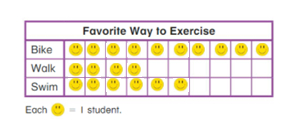
You ask 20 students about their favorite way to exercise. 4 like to walk. 6 like to swim. The rest like to bike. Complete the picture graph.
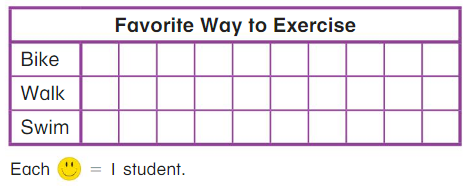
How did you find how many students like to bike?
Answer:
The students who like to walk = 4.
The students who like to swim = 6.
Rest of the students who like bike = 10
Explanation:
In the above-given figure,
The students who like to walk = 4.
The students who like to swim = 6.
Rest of the students who like bike = 10
20 – 4 + 6
20 – 10
10
Review & Refresh
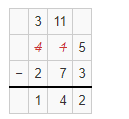
Question 4.
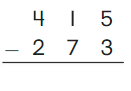
Answer:
415 – 273 = 142
Explanation:
415 – 273 = 142
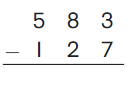
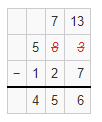
Question 5.
Answer:
583 – 127 = 456
Explanation:
583 – 127 = 456
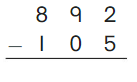
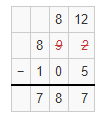
Question 6.
Answer:
892 – 105 = 787
Explanation:
892 – 105 = 787
Lesson 13.4 Real and Interpret Bar Graphs
Explore and Grow
How are the tally chart and the bar graph the same? How are they different?
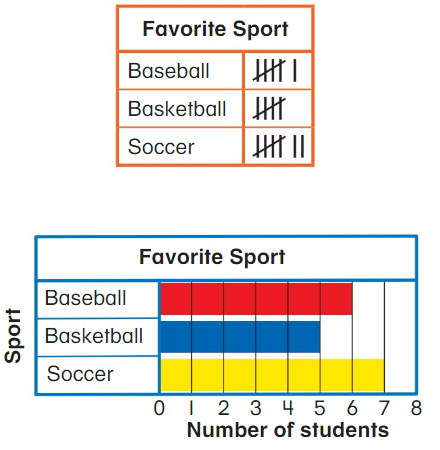
Based on the given values they are the same.
If they give different values they are different.
Answer:
The number of students who choose baseball = 6
The number of students who choose basketball = 5
The number of students who choose soccer = 7
Explanation:
In the above-given figure,
The number of students who choose baseball = 6
The number of students who choose basketball = 5
The number of students who choose soccer = 7
The students whose favorite spot = soccer.
Show and Grow
Question 1.
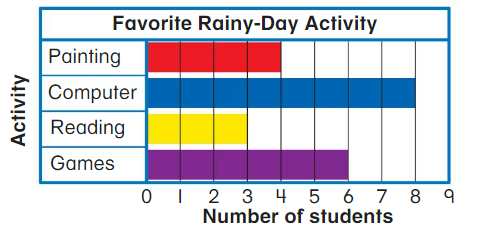
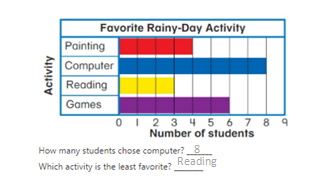
How many students chose computer? _______
Which activity is the least favorite? ________
Answer:
The students who choose computer = 8.
The least favorite activity = reading.
Explanation:
In the above-given figure,
The students who choose painting = 4
the students who choose computer = 8
the students who choose reading = 3
the students who choose games = 6
The students who choose computer = 8.
The least favorite activity = reading
Apply and Grow: Practice
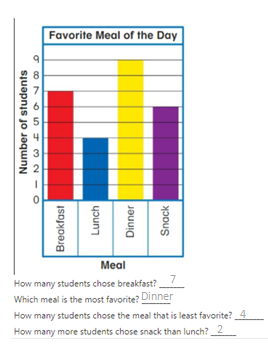
Question 2.
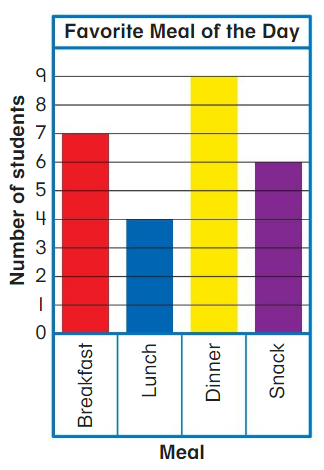
How many students chose breakfast? _______
Which meal is the most favorite? ________
How many students chose the meal that is least favorite? ________
How many more students chose snack than lunch? _______
Answer:
The students who choose breakfast = 7.
the most favorite meal = Dinner.
The students chose the meal that is least favorite = 4
The students choose snack than lunch = 2
Explanation:
The students who choose breakfast = 7.
The students who choose lunch = 4.
The students who choose dinner = 9.
The students who choose snack = 6.
The students who choose breakfast = 7.
the most favorite meal = Dinner.
The students chose the meal that is least favorite = 4
The students choose snack than lunch = 2
Question 3.
DIG DEEPER!
Order the meals in Exercise 2 from the least favorite to the most favorite.
______, ______, ________, ________
Answer:
Lunch, snack, breakfast, and dinner.
Explanation:
In the above-given figure
given that order the meals from least favorite to the most favorite.
the least favorite = lunch.
the most favorite = dinner.
lunch, snack, breakfast, dinner.

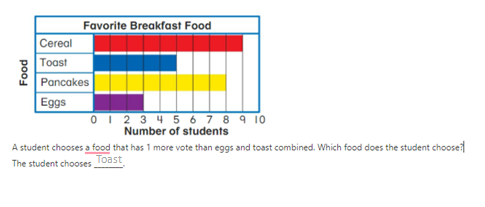
Think and Grow: Modeling Real Life
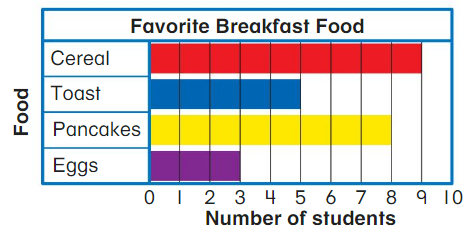
A student chooses a food that has 1 more vote than eggs and toast combined. Which food does the student choose?
The student chooses ________.
Answer:
The students who choose 1 more than eggs = toast.
Explanation:
In the above-given figure,
The students who choose cereal = 9
The students who choose toast = 5
The students who choose pancakes = 8
The students who choose eggs = 3
The students who choose 1 more than eggs = toast.
Show and Grow
Question 4.
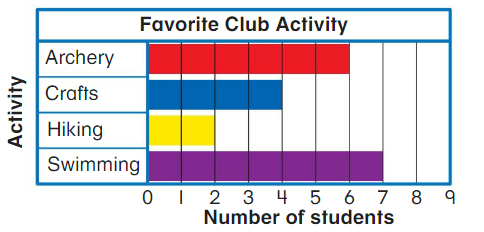
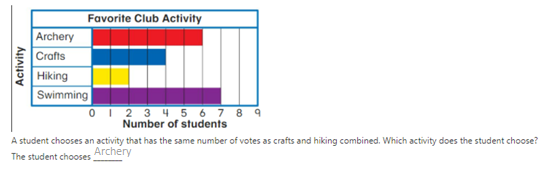
A student chooses an activity that has the same number of votes as crafts and hiking combined. Which activity does the student choose?
The student chooses ________
Answer:
The student who chooses an activity that has the same number of votes as crafts and hiking combined = Archery.
Explanation:
In the above-given figure,
the student who chooses archery = 6
the student who chooses crafts = 4
the student who chooses Hiking = 2
the student who chooses swimming = 7
The student who chooses an activity that has the same number of votes as crafts and hiking combined = Archery.
Real and Interpret Bar Graphs Homework & Practice 13.4
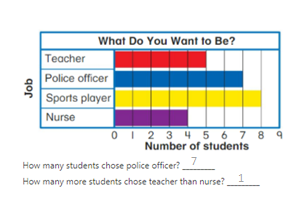
Question 1.
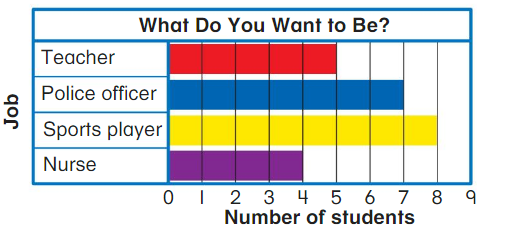
How many students chose police officer? _________
How many more students chose teacher than nurse? _________
Answer:
The students who choose police officer = 7.
The more students choose teacher than nurse = 1
Explanation:
In the above-given figure,
The students who choose teacher job = 5
The students who choose police officer job = 7
The students who choose sports player job = 8
The students who choose nurse job = 4
The students who choose police officer = 7.
The more students choose teacher than nurse = 1
Question 2.
Writing
How can you use a bar graph to find how many students were surveyed?
__________________
__________________
Answer:
The number of students surveyed = 24 students.
Explanation;
In the above-given graph
The students who choose teacher job = 5
The students who choose police officer job = 7
The students who choose sports player job = 8
The students who choose nurse job = 4
The total number of students were surveyed = 24 students.
Question 3.
Modeling Real Life
Use the bar graph.
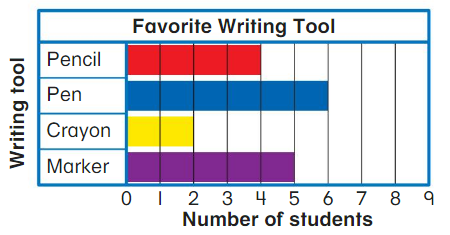
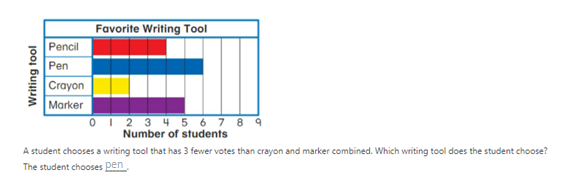
A student chooses a writing tool that has 3 fewer votes than crayon and marker combined. Which writing tool does the student choose?
The student chooses ______.
Answer:
The student chooses a writing tool that has 3 fewer votes than crayon and marker combined = pen.
Explanation:
In the above-given graph,
the student who chooses pencil = 4
the student who chooses pen = 6
the student who chooses crayon = 2
the student who chooses marker = 5
The student chooses a writing tool that has 3 fewer votes than crayon and marker combined = pen.
Review & Refresh
Find the missing number.
Question 4.
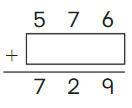
Answer:
576 + 153 = 729
Explanation:
729 – 576 = 153
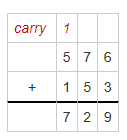
Question 5.
Answer:
431 + 389 = 820
Explanation:
820 – 431 = 389
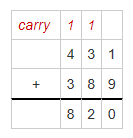
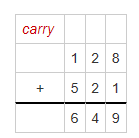
Question 6.
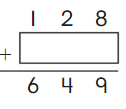
Answer:
128 + 521 = 649
Explanation:
649 – 128 = 521
Lesson 13.5 Make Bar Graphs
Explore and Grow
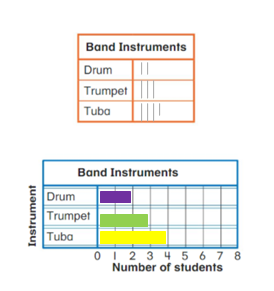
Look at your Instrument Cards. Complete the tally chart and the bar graph.
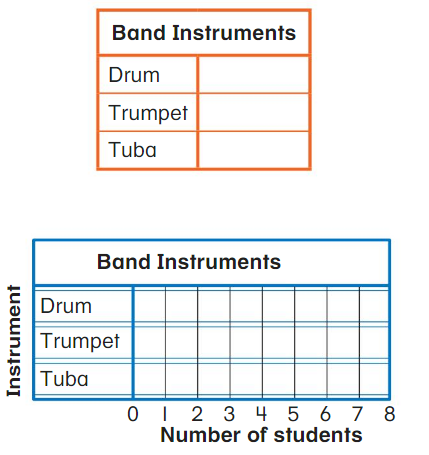
Answer:
The students who choose drum = 2
The students who choose trumpet = 3
The students who choose tuba = 4
Explanation:
In the above-given figure,
The students who choose drum = 2
The students who choose trumpet = 3
The students who choose tuba = 4
Show and Grow
Question 1.
Complete the bar graph.
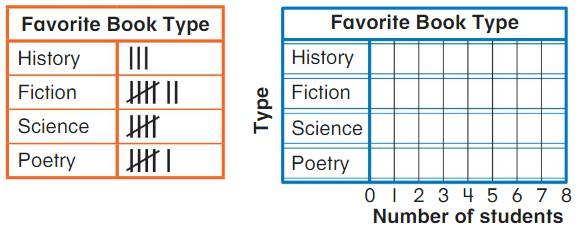
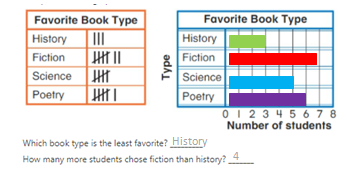
Which book type is the least favorite? _________
How many more students chose fiction than history? _______
Answer:
The least favorite book = history
The more students choose fiction than history = 3
Explanation:
In the above-given figure,
The students who choose history = 3
The students who choose fiction = 7
The students who choose science = 5
The students who choose poetry = 6
The least favorite book = history
The more students choose fiction than history = 3
Apply and Grow: Practice
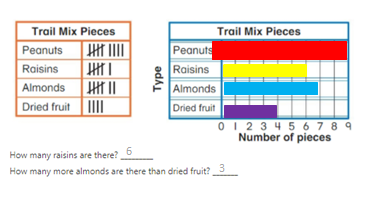
Question 2.
Complete the bar graph.
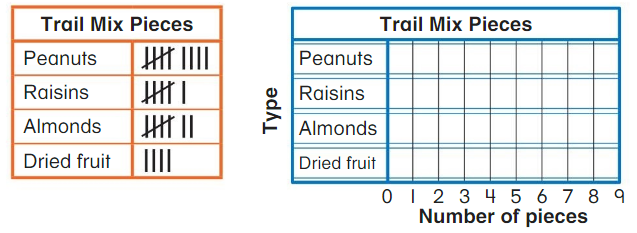
How many raisins are there? _________
How many more almonds are there than dried fruit? _______
Answer:
The raisins are = 6
The more almonds are there than dried fruit = 3
Explanation:
In the above-given figure,
The number of peanuts = 9
the number of raisins = 6
The number of almonds = 7
the number of dried fruit = 4
The raisins are 6
the more almonds are there than dried fruits = 3
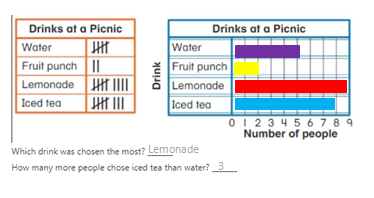
Question 3.
Complete the bar graph.
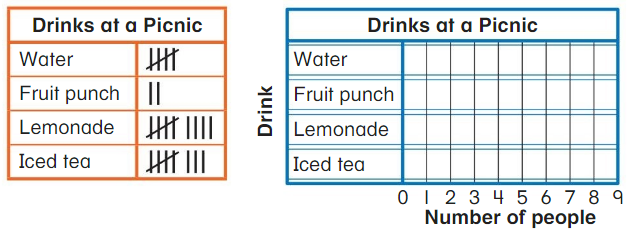
Which drink was chosen the most? _______
How many more people chose iced tea than water? _______
Answer:
The number of people who choose the drink most = Lemonade
The people who choose iced tea over water = 3
Explanation:
The number of people who choose water = 5
The number of people who chose fruit punch = 2
The number of people who choose lemonade = 9
The number of people who choose iced tea 8
The number of people who choose the drink most = Lemonade
The people who choose iced tea over water = 3
Think and Grow: Modeling Real Life
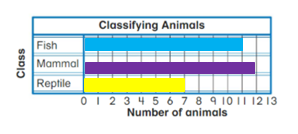
You classify 30 animals as fish, mammals, or reptiles.11 are fish. 7 are reptiles. The rest are mammals. Complete the bar graph.
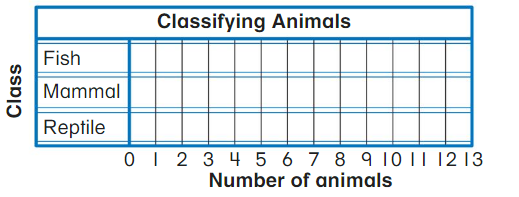
Answer:
The mammals = 12.
Explanation:
In the above-given figure,
Given that the fishes are 11.
reptiles = 7
mammals = 12
11 + 7 = 18
30 – 18 = 12
Show and Grow
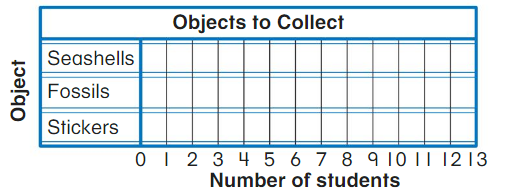
Question 4.
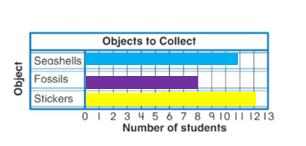
You ask 29 students if they want to collect seashells, fossils, or stickers. 8 said fossils. 12 said stickers. The rest said seashells. Complete the bar graph.
DIG DEEPER!
You ask 3 more students which object they want to collect. 1 said fossils. 2 said seashells. How many fewer students chose fossils than seashells now?
_______ students
Answer:
The fewer students choose fossils than seashells now = 2.
Explanation:
In the above-given figure,
The number of students who choose seashells = 9
The number of students who choose fossils = 8
The number of students who choose stickers = 12
given that 29 students.
11 + 9 = 20
29 – 20 = 9
Make Bar Graphs Homework & Practice 13.5
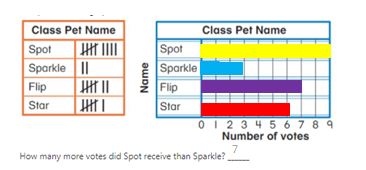
Question 1.
Complete the bar graph.
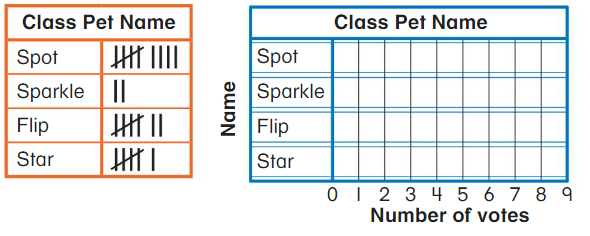
How many more votes did Spot receive than Sparkle? ______
Answer:
The more votes did spot receive than sparkle = 7
Explanation:
In the above-given figure,
The number of votes for spot = 9
The number of votes for sparkle = 2
The number of votes for flip = 7
The number of votes for star = 6
The more votes did spot receive than sparkle = 7
the spot receives 7 more votes than sparkle.
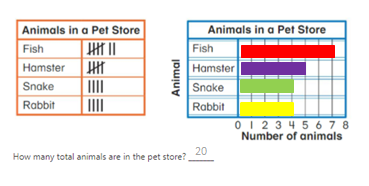
Question 2.
Complete the bar graph.
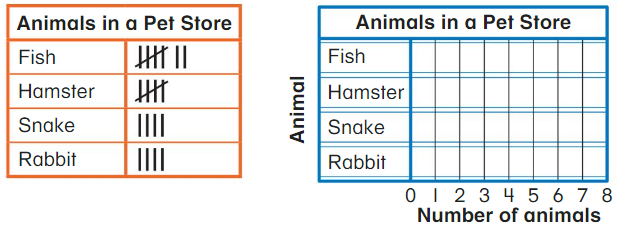
How many total animals are in the pet store? _______
Answer:
The total animals in the pet store = 20.
Explanation:
In the above-given figure,
Given that fish = 7
hamster = 5
snake = 4
rabbit = 4
total animals in the pet = 20 animals.
Question 3.
Modeling Real Life
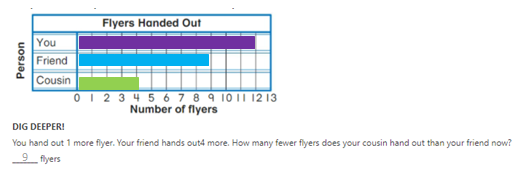
You, your friend, and your cousin hand out a total of 25 flyers. You hand out 12. Your friend hands out 9. Your cousin hands out the rest. Complete the bar graph.
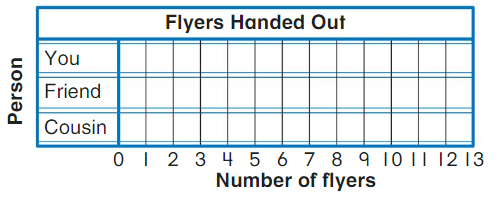
DIG DEEPER!
You hand out 1 more flyer. Your friend hands out4 more. How many fewer flyers does your cousin hand out than your friend now?
_______ flyers
Answer:
The many fewer flyers do your cousin hand out than your friend now = 9
Explanation:
In the above-given figure,
The flyers handed out by me = 12.
The flyers handed out by my friend = 9.
The flyers handed out by my cousin = 4.
given that flyers handed out by me = 12
totally there are 25 flyers.
12 + 9 = 25
Review & Refresh
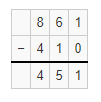
Question 4.
861 − 410 = ______
Answer:
861 – 410 = 451
Explanation:
861 – 410 = 451
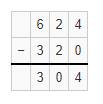
Question 5.
624 − 320 = ______
Answer:
624 – 320 = 304
Explanation:
624 – 320 = 304
Lesson 13.6 Make Line Plots
Explore and Grow
How are the thumb lengths shown on the number line?
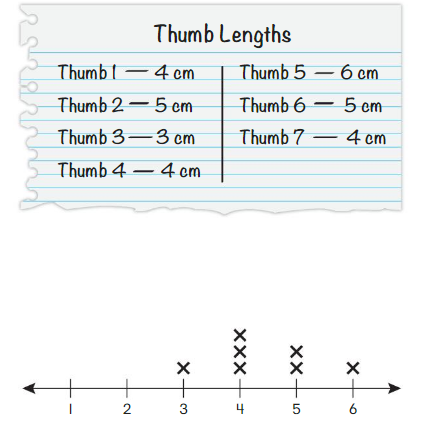
Answer:
The thumb lengths for thumb 1, thumb 4, thumb 7 = 4 cms.
thumb 2 , thumb 6 = 5 cms.
thumb 3 = 3 cm
thumb 5 = 6cm
Explanation:
In the above-given figure,
given the thumb lengths.
The thumb lengths for thumb 1, thumb 4, thumb 7 = 4 cms.
thumb 2 , thumb 6 = 5 cms.
thumb 3 = 3 cm
thumb 5 = 6cm
Show and Grow
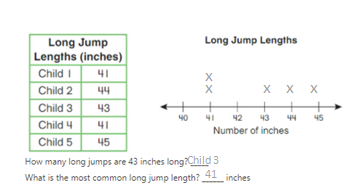
Question 1.
Complete the line plot.
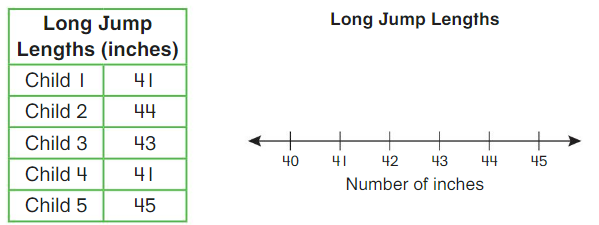
How many long jumps are 43 inches long? _____
What is the most common long jump length? ______ inches
Answer:
One long-jump is 43 inches long = child 3.
the most common long jump length = child 1 and child 4.
Explanation:
In the above-given figure,
given that the long jump lengths.
child 1 and child 4 = 41
child 2 = 44
child 5 = 45
One long-jump is 43 inches long = child 3.
the most common long jump length = child 1 and child 4.
Apply and Grow: Practice
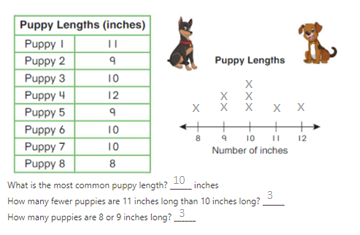
Question 2.
Complete the line plot.
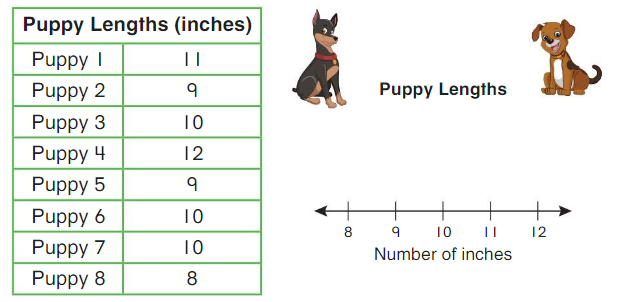
What is the most common puppy length? ______ inches
How many fewer puppies are 11 inches long than 10 inches long? ______
How many puppies are 8 or 9 inches long? ______
How many puppies are shorter than 11 inches? How do you know?
_____________________
____________________
Answer:
The most common puppy length = puppy 2, 3, 5, 6, and 7.
The fewer puppies are 11 inches longer than 10 inches long = puppy 1.
The puppies which are 8 or 9 inches long = 3 puppies.
The puppies which are shorter than 11 inches = 6 puppies.
Explanation:
In the above-given figure,
given the puppy lengths.
the puppy lengths with puppy 1 = 11 inches.
puppy 2 = 9 inches.
puppy 3 = 10 inches.
puppy 4 = 12 inches.
puppy 5 = 9 inches.
puppy 6 = 10 inches.
puppy 7 = 10 inches.
puppy 8 = 8 inches.
The most common puppy length = puppy 2, 3, 5, 6, and 7.
The fewer puppies are 11 inches longer than 10 inches long = puppy 1.
The puppies which are 8 or 9 inches long = 3 puppies.
The puppies which are shorter than 11 inches = 6 puppies.
Think and Grow: Modeling Real Life
9 people measure the length of a guitar. The line plot shows the measured lengths. How long do you think the guitar is? Explain.
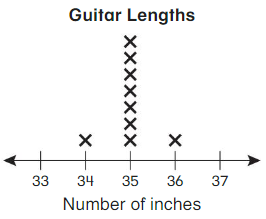
______ inches
Answer:
The length of the guitar = 35 inches.
Explanation:
In the above-given figure,
the number of inches in guitar lengths are:
the guitar length with 34 inches.
the guitar length with 35 inches.
the guitar length with 36 inches.
Show and Grow
Question 3.
8 people measure the length of a playground. The line plot shows the measured lengths.How long do you think the playground is? Explain.
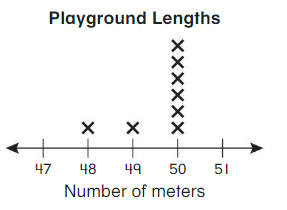
______ meters
DIG DEEPER!
Why are the measurements different?
Answer:
The length o the playground = 51 meters.
Explanation:
In the above-given figure,
the number of meters of playgrounds is:
given that 8 people measure the length of the playground.
6 people choose 50 meters.
1 people choose 49 meters.
1 people choose 48 meters.
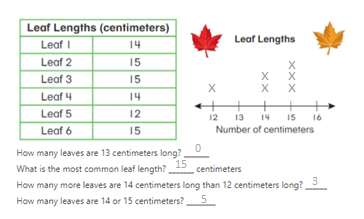
Make Line Plots Homework & Practice 13.6
Question 1.
Complete the line plot.
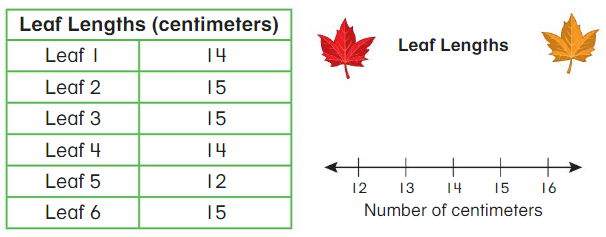
How many leaves are 13 centimeters long? _______
What is the most common leaf length? _______ centimeters
How many more leaves are 14 centimeters long than 12 centimeters long? ______
How many leaves are 14 or 15 centimeters? ________
Answer:
No leaves are 13 centimeters long.
the most common leaf lengths are leaf 2, leaf 3, and leaf 6.
the more leaves are 14 centimeters long than 12 centimeters long = leaf 1 and leaf 4.
The leaves are 14 or 15 centimeters = 5 leaves.
Explanation:
In the above-given figure,
given that, the leaf lengths.
the leaf 1 = 14 centimeters.
the leaf 2 = 15 centimeters
the leaf 3 = 15 centimeters
the leaf 4 = 14 centimeters
the leaf 5 = 12 centimeters
the leaf 6 = 15 centimeters
No leaves are 13 centimeters long.
the most common leaf lengths are leaf 2, leaf 3, and leaf 6.
the more leaves are 14 centimeters long than 12 centimeters long = leaf 1 and leaf 4.
The leaves are 14 or 15 centimeters = 5 leaves.
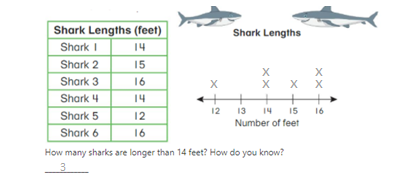
Question 2.
Complete the line plot.
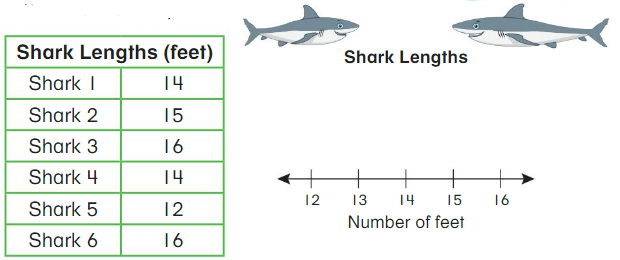
How many sharks are longer than 14 feet? How do you know?
____________
Answer:
The sharks which are longer than 14 feet = 3 sharks.
Explanation:
In the above-given figure,
given that the shark lengths in feets.
shark 1 = 14
shark 2 = 15
shark 3 = 16
shark 4 = 14
shark 5 = 12
shark 6 = 16
The sharks which are longer than 14 feet = 3 sharks.
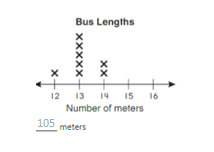
Question 3.
Modeling Real Life
8 people measure the length of a bus. The line plot shows the measured lengths. How long do you think the school bus is? Explain.
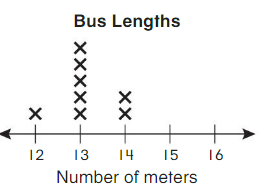
______ meters
Answer:
The length of the school bus = 105 meters.
Explanation:
In the above-given figure,
the lengths of the school bus is given.
given that 8 people measure the length of a bus.
the lone plot shows the measured lengths.
2 people measure the 14 meters.
1 people measure the 12 inches.
Review & Refresh
Question 4.
Answer:
127.
Explanation:
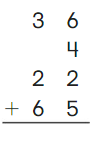
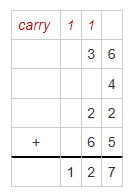
36 + 4 + 22 + 65
40 + 22 + 65
62 + 65
127
Question 5.
Answer:
208.
Explanation:
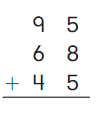
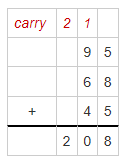
95 + 68 + 45
163 + 45
208
Question 6.
Answer:
226.
Explanation:
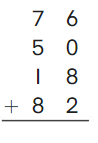
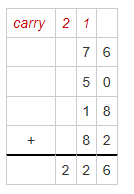
76 + 50 + 18 + 82
126 + 18 + 82
144 + 82
226
Lesson 13.7 Measure Objects and Make Line Plots
Explore and Grow
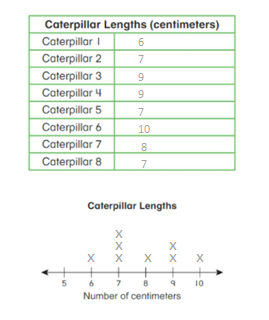
Use a ruler to measure the caterpillars on Lengths of Caterpillars. Use the lengths to complete the chart and the line plot.
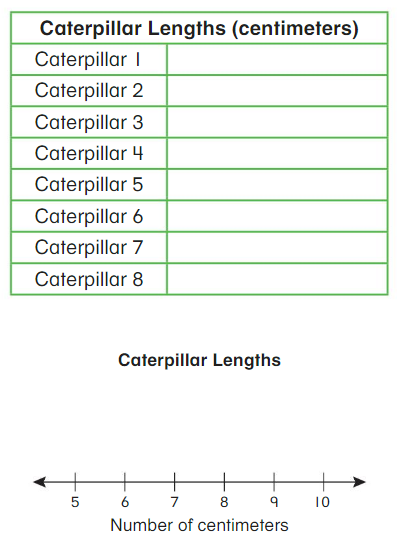
Answer:
The long length of the caterpillar = 9.
Explanation:
We have to assume the lengths of the cater pillars.
cater pillar 1 = 6 cms.
cater pillar 2 = 7 cms.
cater pillar 3 = 9 cms.
cater pillar 4 = 9 cms.
cater pillar 5 = 7 cms.
cater pillar 6 = 10 cms.
cater pillar 7 = 8 cms.
cater pillar 8 = 7 cms.
The long length of the caterpillar = 9
Show and Grow
Question 1.
Measure the lengths of 4 pencils. Complete the line plot.
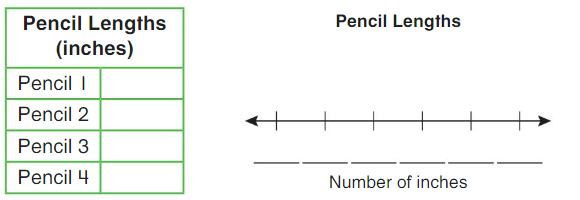
What is the length of the longest pencil? _______ inches
How much longer is the longest pencil than the shortest pencil? _______ inches
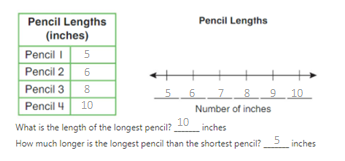
Answer:
The length of the longest pencil = 10 inches.
The longer is the longest pencil than the shortest penccil = 5 inches.
Explanation:
In the above-given figure,
given that the length of the 4 pencils.
the length of the pencil 1 = 5 inches.
pencil 2 = 6 inches.
pencil 3 = 8 inches.
pencil 4 = 10 inches.
The length of the longest pencil = 10 inches.
The longer is the longest pencil than the shortest penccil = 5 inches.
Apply and Grow: Practice
Question 2.
Measure the lengths of 8 shoes. Complete the line plot.
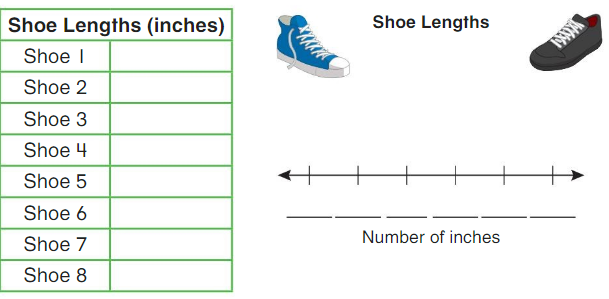
What is the length of the longest shoe? ______ inches
What is the length of the shortest shoe? _______ inches
How much shorter is the shortest shoe than the longest shoe? _______ inches
You measure 5 more shoes and they are each6 inches long. How does the line plot change?
_________________________
_________________________
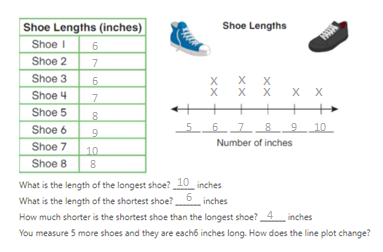
Answer:
The length of the longest shoe = 10 inches.
The length of the shortest shoe = 6 inches.
The shorter is the shortest shoe than the longest shoe = 5 inches.
The line plot changes.
Explanation:
In the above-given figure,
we have to assume the examples.
length of the shoe 1 = 6 inches.
length of the shoe 2 = 7 inches.
length of the shoe 3 = 6 inches.
length of the shoe 4 = 7 inches.
length of the shoe 5 = 8 inches.
length of the shoe 6 = 9 inches.
length of the shoe 7 = 10 inches.
length of the shoe 8 = 8 inches.
The length of the longest shoe = 10 inches.
The length of the shortest shoe = 6 inches.
The shorter is the shortest shoe than the longest shoe = 5 inches.
The line plot changes.
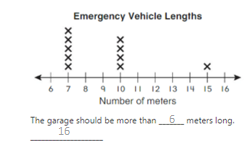
Think and Grow: Modeling Real Life
A fire station is building a new garage for emergency vehicles. Complete the sentence. Explain.
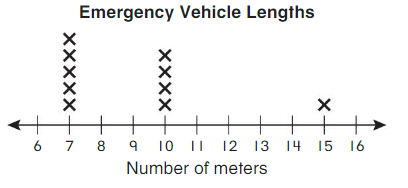
The garage should be more than _______ meters long.
____________________
Answer:
The garage should be more than 16 meters long.
Explanation:
In the above-given figure,
Given that the fire station is building a new garage for emergency vehicles.
the garage should be more than 6 meters long and the shorter than 16 meters long.
Show and Grow
Question 3.
You want to put some school supplies in a pencil box. Complete the sentence. Explain.
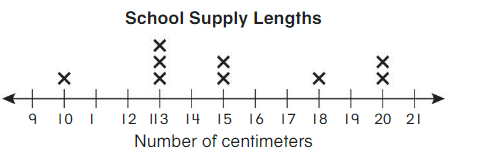
The pencil box should be more than _______ centimeters long.
______________________
Answer:
Measure Objects and Make Line Plots Homework & Practice 13.7
Question 1.
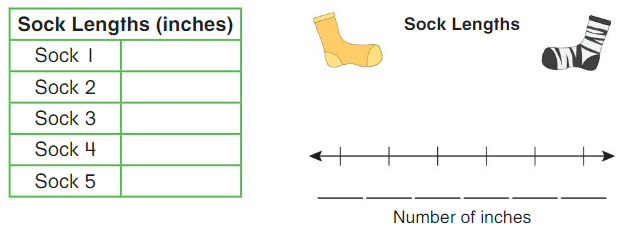
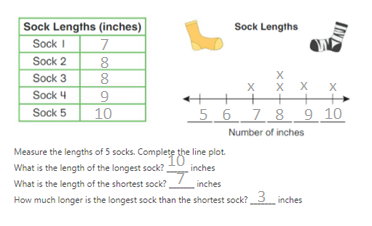
Measure the lengths of 5 socks. Complete the line plot.
What is the length of the longest sock? ______ inches
What is the length of the shortest sock? _______ inches
How much longer is the longest sock than the shortest sock? _______ inches
Answer:
The length of the longest sock = 10 inches.
The length of the shortest sock = 7 inches.
The longer is the longest sock than the shortest sock = 3 inches.
Explanation:
In the above-given figure,
we have to assume the:
sock 1 = 7
sock 2 = 8
sock 3 = 8
sock 4 = 9
sock 5 = 10
The length of the longest sock = 10 inches.
The length of the shortest sock = 7 inches.
The longer is the longest sock than the shortest sock = 3 inches.
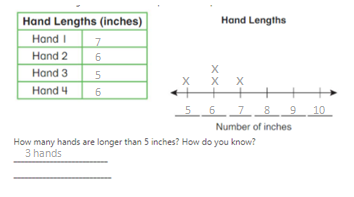
Question 2.
Measure the lengths of 4 hands. Complete the line plot.
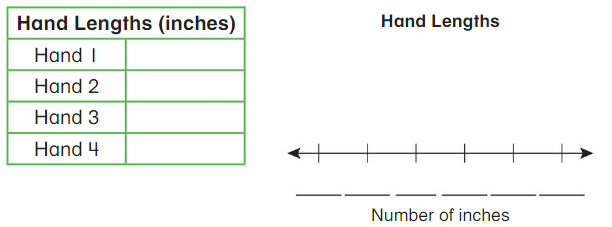
How many hands are longer than 5 inches? How do you know?
__________________________
___________________________
Answer:
The hands that are longer than 5 inches = 3
Explanation:
We have to assume the hands in inches.
given that hand 1 = 7 inches.
hand 2 = 6 inches.
hand 3 = 5 inches.
hand 4 = 6 inches.
The hands that are longer than 5 inches = 3
Question 3.
Modeling Real Life
Newton wants to put his dog bones in a box. Complete the sentence. Explain.
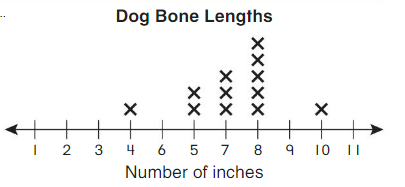
The box should be more than ______ inches long.
____________________
Answer:
The bo should be more than 11 inches.
Explanation:
In the above-given figure,
Given that newton wants to put his dog bones in a box.
the box should be more than 11 inches.
the box should be less than 4 inches.
Review & Refresh
Question 4.
10 more than 347 is _______.
Answer:
357
Explanation:
Given that,
10 more than 347 = 357.
347 + 10 = 357
Question 5.
100 less than 926 is _________.
Answer:
826
Explanation:
Given that 100 less than 926 = 826
926 – 100 = 826
Represent and Interpret Data Performance Task
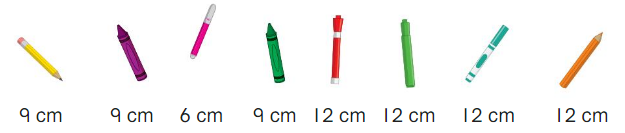
You measure the lengths of 8 writing tools. The tools and their lengths are shown.
Question 1.
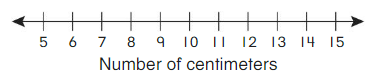
Organize the writing tool lengths on the line plot.
Answer:
The maximum length of the pencil = 12cms.
Explanation:
In the above-given figure,
given that
pencil 1 = 9 cm
pencil 2 = 9 cm
pencil 3 = 6 cm
pencil 4 = 9 cm
pencil 5 = 12 cm
pencil 6 = 12 cm
pencil 7 = 12 cm
pencil 8 = 12 cm
the maximum length of the pencil = 12 cms
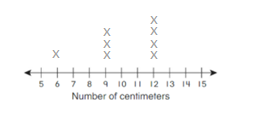
Question 2.
Use the line plot to complete the equation. Why is the sum 8?
_____ + ______ + ______ = 8
Answer:
2 + 2 + 4 = 8
Question 3.
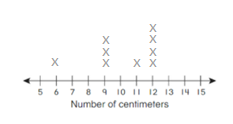
Measure your pencil. Add the length of your pencil to the line plot in Exercise 1.
Answer:
My pencil length is = 11 cms.
Explanation:
In the above-given figure,
given that
pencil 1 = 9 cm
pencil 2 = 9 cm
pencil 3 = 6 cm
pencil 4 = 9 cm
pencil 5 = 12 cm
pencil 6 = 12 cm
pencil 7 = 12 cm
pencil 8 = 12 cm
the maximum length of the pencil = 12 cms
Assuming my pencil length = 11 cms
Question 4.
Compare the lengths of your pencil and one of the writing tools above.
Answer:
The length of my pencil = 11 cms.
Explanation:
In the above-given figure,
given that
pencil 1 = 9 cm
pencil 2 = 9 cm
pencil 3 = 6 cm
pencil 4 = 9 cm
pencil 5 = 12 cm
pencil 6 = 12 cm
pencil 7 = 12 cm
pencil 8 = 12 cm
the maximum length of the pencil = 12 cms
Assuming my pencil length = 11 cms
Represent and Interpret Data Activity
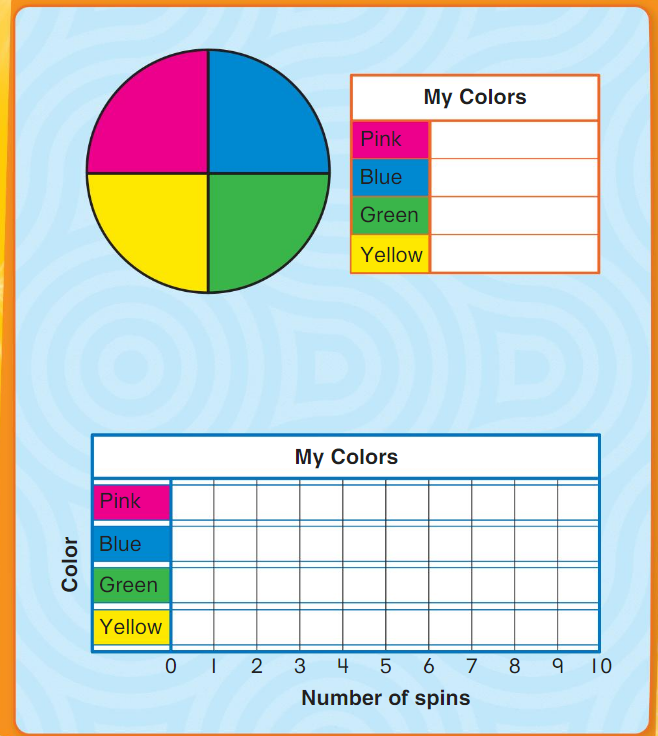
Spin and Graph
To Play: Spin 10 times. Complete the tally chart. Then complete the bar graph. Answer the Spin and Graph Questions about your graph.
Represent and Interpret Data Chapter Practice
13.1 Sort and Organize Data
Question 1.
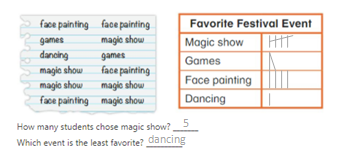
Use the data to complete the tally chart.
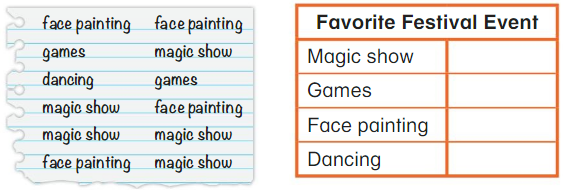
How many students chose magic show? _______
Which event is the least favorite? __________
Answer:
The students who choose the magic show = 5 students.
The last favorite = dancing.
Explanation:
In the above-given figure,
The students who choose magic show = 5
The students who choose face painting = 4
The students who choose games = 2
The students who choose dancing = 1
The students who choose the magic show = 5 students.
The last favorite = dancing.
Question 2.
Modeling Real Life
You want to survey30 students. How many more students do you need to ask?
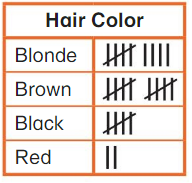
______ students
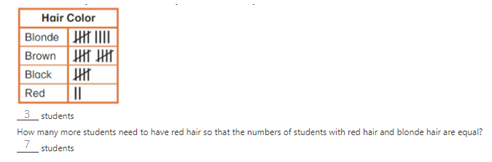
How many more students need to have red hair so that the numbers of students with red hair and blonde hair are equal?
______ students
Answer:
The more students need to ask = 3 students.
The more students need to have red hair so that the numbers of students with red hair and blonde hair are equal = 7 students.
Explanation:
In the above-given figure,
the hair color which is in red = 2
the hair color which is in black = 5
the hair color which is brown = 10
the hair color which is in blonde = 9
The more students need to ask = 3 students.
The more students need to have red hair so that the numbers of students with red hair and blonde hair are equal = 7 students.
13.2 Read and Interpret Picture Graphs
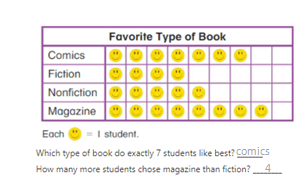
Question 3.
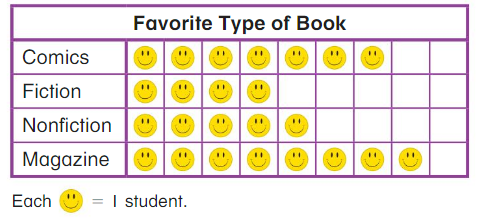
Which type of book do exactly 7 students like best? _______
How many more students chose magazine than fiction? ________
Answer:
The type of book does exactly 7 students like best = comics.
The more students choose magazine than fiction = 4.
Explanation:
In the above-given figure,
The students who choose comics = 7
The students who choose fiction = 4
The students who choose nonfiction = 5
The students who choose magazine = 8
The type of book does exactly 7 students like best = comics.
The more students choose magazine than fiction = 4.
13.3 Make Picture Graphs
Question 4.
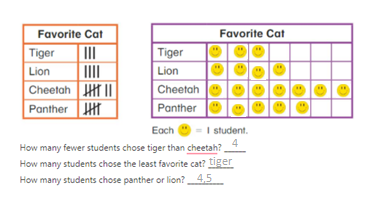
Complete the picture graph.
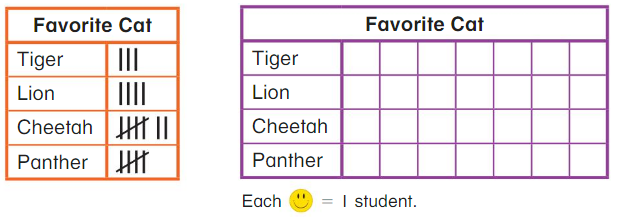
How many fewer students chose tiger than cheetah? ______
How many students chose the least favorite cat? _______
How many students chose panther or lion? __________
Answer:
The fewer students choose tiger than cheetah = 4
The students who choose least favorite cat = tiger
the students who choose panther = 5
the students who choose lion = 4
Explanation:
In the above-given figure,
Given that,
The fewer students choose tiger than cheetah = 4
The students who choose least favorite cat = tiger
the students who choose panther = 5
the students who choose lion = 4
13.4 Read and Interpret Bar Graphs
Question 5.
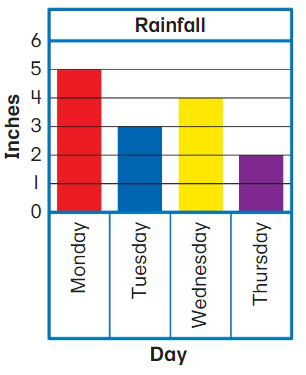
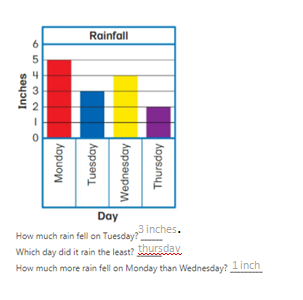
How much rain fell on Tuesday? ______
Which day did it rain the least? _______
How much more rain fell on Monday than Wednesday? _________
Answer:
The rain fell on Tuesday = 3 inches.
The day it rains the least = thursday.
the more rain fell on Monday than Wednesday = 1 inch.
Explanation:
In the above-given graph,
the rain fell on Monday = 5 inches.
the rain fell on Tuesday = 3 inches.
the rain fell on Wednesday = 4 inches.
the rain fell on Thursday = 2 inches.
The rain fell on Tuesday = 3 inches.
The day it rains the least = Thursday.
the more rain fell on Monday than Wednesday = 1 inch.
13.5 Make Bar Graphs
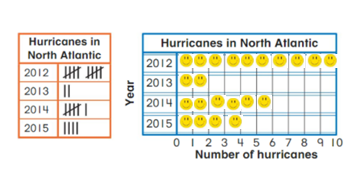
Question 6.
Complete the bar graph.
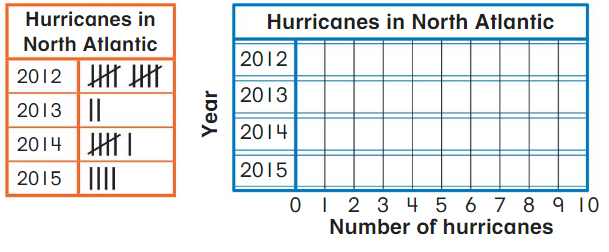
How many hurricanes were there in 2012 and 2013? _______
Answer:
The hurricanes were there in 2012 and 2013 = 12.
Explanation:
In the above-given figure,
given that the hurricanes in the north Atlantic.
in 2012 = 10
2013 = 2
2014 = 5
2015 = 4
The hurricanes were there in 2012 and 2013 = 12.
13.6 Read and Interpret Line Plots
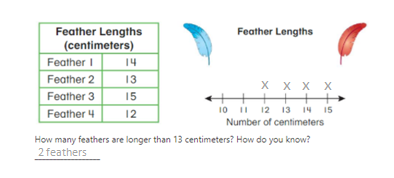
Question 7.
Complete the line plot.
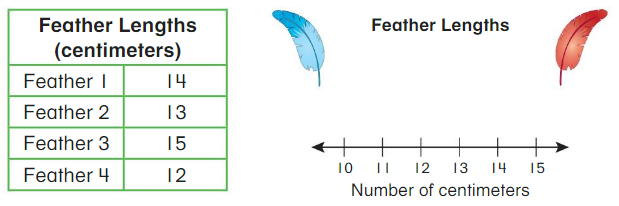
How many feathers are longer than 13 centimeters? How do you know?
__________________
__________________
Answer:
The feathers which are longer than 13 centimeters = 2 feathers.
Explanation:
In the above-given figure,
The feathers with the lengths in centimeters.
feather 1 = 14 cms.
feather 2 = 13 cms.
feather 3 = 15 cms.
feather 4 = 12 cms.
The feathers which are longer than 13 centimeters = 2 feathers.
13.7 Measure Objects and Make Line Plots
Question 8.
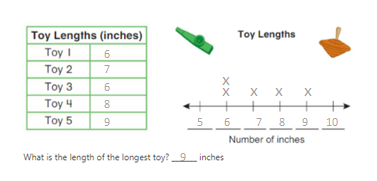
Use an inch ruler to measure the lengths of 5 toys to the nearest inch. Then complete the line plot.
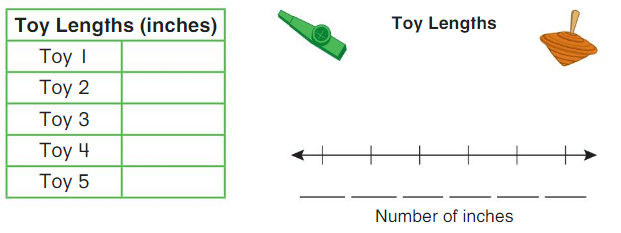
What is the length of the longest toy? _______ inches
Answer:
The length of the longest toy = 9inches.
Explanation:
In the above-given figure,
we have to assume that
the length of the toy 1 = 6 inches.
the length of the toy 2 = 7 inches.
the length of the toy 3 = 6 inches
the length of the toy 4 = 8 inches.
the length of the toy 5 = 9 inches.
The length of the longest toy = 9inches.
Conclusion:
I hope that the solutions explained here are helpful for the students while preparing for the exams. So, download Big Ideas Math 2nd Grade 13th Chapter Represent and Interpret Data Answer Key pdf for free of cost and begin preparation. Students can clear their doubts by writing a comment in the below comment section. Also, bookmark our site to get the latest edition solutions for Big Ideas Math Book Grade 2 Chapters.