Are you looking everywhere to find Go Math Grade 3 Answer Key Chapter 2 Represent and Interpret Data? You have come the right way and we have covered different questions on the topic Represent and Interpret Data. Enhance your subject knowledge by taking the help of the 3rd Grade Go Math Chapter 2 Answer Key. Practice HMH Go Math Grade 3 Answer Key Chapter 2 Represent and Interpret Data and answer the questions from the chapter with confidence. The detailed explanation provided helps you understand the topics easily.
Go Math Grade 3 Answer Key Chapter 2 Represent and Interpret Data
We advise you to go through the topics in the Chapter Represent and Interpret Data. You need to work hard right from the beginning in order to have strong fundamentals. Become champ in the subject by referring to our Go Math 3rd Grade Solution Key. Assess your preparation standard by solving the 3rd Grade Go Math Answer Key Chapter 2 Represent and Interpret Data on your own and then verify with the solutions.
Lesson 1: Problem Solving • Organize Data
Lesson 2: Use Picture Graphs
Lesson 3: Make Picture Graphs
Mid-Chapter Checkpoint
Lesson 4: Use Bar Graphs
Lesson 5: Make Bar Graphs
Lesson 6: Solve Problems Using Data
Lesson 7: Use and Make Line Plots
Chapter 2 Review/Test
- Review/Test Page No 131
- Review/Test Page No 132
- Review/Test Page No 133
- Review/Test Page No 134
- Review/Test Page No 135
- Review/Test Page No 136
Organize Data Page No 91
Problem Solving Organize Data
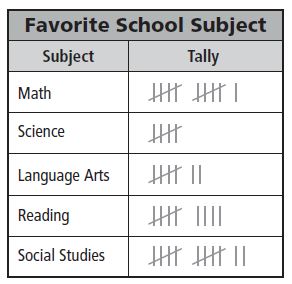
Use the Favorite School Subject tables for 1–4.
Question 1.
The students in two third-grade classes recorded their favorite school subject. The data are in the tally table. How many fewer students chose science than chose social studies as their favorite school subject?
Think: Use the data in the tally table to record the data in the frequency table. Then solve the problem.
social studies: 12 students
science: 5 students
12 – 5 = 7
So, 7 fewer students chose science.
| Subject | Number |
| Math | ____________ |
| Science | 5 |
| Language Arts | ____________ |
| Reading | ____________ |
| Social Studies | 12 |
Answer:
| Subject | Number |
| Math | 11 |
| Science | 5 |
| Language Arts | 7 |
| Reading | 9 |
| Social Studies | 12 |
Question 2.
What subject did the least number of students choose?
___________
Answer: Science
Explanation:
We can answer the question by using the above tally table. The table shows the least number of students is 5. Thus the answer is Science.
Question 3.
How many more students chose math than language arts as their favorite subject?
_______ more students
Answer: 4
Explanation:
If we look at the above table, there are 11 students who chose Math and 7 students who chose the language arts
To know the students who chose math than language arts we have to subtract 11 and 7
= 11 – 7
= 4
Thus the students chose math than language arts as their favorite subject are 4
Question 4.
Suppose 3 students changed their vote from math to science. Describe how the frequency table would change.
Type below:
__________
Answer: There would be an equal number of students who chose math and who chose science
Explanation:
If we look at the graph there are 11 students who voted for Math and 5 students who voted for Science
If 3 students changed their vote from math to science then the new graph will be
11- 3= 8
i.e., Actual No. of Science Students + New Students who changed from Math to Science
= 5 + 3
= 8
Organize Data Lesson Check Page No 92
Question 1.
The tally table shows the cards in Kyle’s sports card collection.
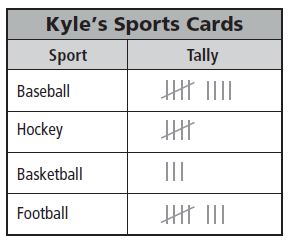
How many hockey and football cards does Kyle have combined?
Options:
a. 5
b. 8
c. 12
d. 13
Answer: 13
Explanation:
Given,
Kyle has 5 hockey cards and 8 football cards
To know total no. of hockey and football cards does Kyle have combined
We have to add 5 + 8 = 13
Therefore the total no. of cards that Kyle have combined is 13
Spiral Review
Question 2.
There are 472 people in the concert hall. What is 472 rounded to the nearest hundred?
Options:
a. 400
b. 470
c. 500
d. 600
Answer: 500
If the digit to the right is more or greater than 5, then the digit in the rounding place will be increased to 1.
472 is greater than 450
So, 472 rounded to the nearest hundred is 500
So the answer is option c.
Question 3.
Max and Anna played a video game as a team. Max scored 463 points and Anna scored 329 points. How many points did they score in all?
Options:
a. 892
b. 792
c. 782
d. 134
Answer: 792
Explanation:
Given that,
Max scored 463 points and,
Anna scored 329 points
To know the total points they scored
We need to add both Max and Anna points
i.e., 436 + 329 = 792
Question 4.
Judy has 573 baseball cards in her collection. Todd has 489 baseball cards in his collection. How many fewer cards does Todd have than Judy?
Options:
a. 84
b. 94
c. 116
d. 184
Answer: 84
Explanation:
Given,
Judy has 573 baseball cards in her collection
Todd has 489 baseball cards in his collection
To find how many fewer cards does Todd have than Judy
We have to find the difference between Judy and Todd baseball cards
= 573 – 489 = 84
Question 5.
Ms. Westin drove 542 miles last week and 378 miles this week on business. How many miles in all did she drive on business during the two weeks?
Options:
a. 810 miles
b. 820 miles
c. 910 miles
d. 920 miles
Answer: 920 miles
Explanation:
We observe that Ms. Westin drove 542 miles last week and 378 miles this week on business
Total number of miles in all did she drive on business during the two weeks is?
542 + 378 = 920 miles
Thus the answer to the above question is option d.
Use Picture Graphs Page No 97
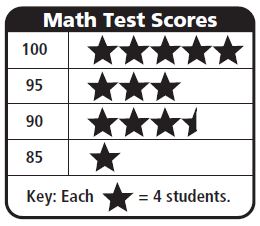
Use the Math Test Scores picture graph for 1–7.
Question 1.
How many students scored 100? How can you find the answer?
Answer: To find the number of students who scored 100, count each star as 4 students. So, 20 students scored 100.
Question 2.
What does ![]() stand for?
stand for?
________ students
Answer: It represents 2 students.
Explanation:
The full star stands for 4 students
That means the half star is equal to two stars.
Question 3.
How many students in all scored 100 or 95?
________ students
Answer: 32 Students
Explanation:
No. of students who scored 100 = 5 stars
Each star = 4 students
i.e., 5 × 4 = 20 students
No. of students who scored 95 = 3
Each star = 4 students
That means 3 × 4 = 12
Total No. of students in all scored 100 or 95
12 + 20 = 32
Thus the answer is 32 students
Question 4.
How many more students scored 90 than 85?
________ students
Answer: 10 more students
Explanation:
Students who scored 90 = 3 and a half star = 4 + 4 + 4 + 2
Students who score 85 = 1 star = 4
That means students scored 90 than 85 are
14 – 4 = 10 students
Question 5.
How many students in all took the test?
________ students
Answer: 50 Students
Explanation:
Students who scored 100 (5 stars) = 4 + 4 + 4 + 4 + 4 = 20 student
Students who scored 95 (3 stars) = 4 + 4 + 4 = 12 students
Students who scored 90 (3 and a half star) = 4 + 4 + 4 + 2 = 14 students
Students who score 85 (1 star) = 4 students
Total No. of students who took test = 20 + 12 + 14 + 4 = 50 students
Problem Solving
Question 6.
Suppose the students who scored 85 and 90 on the math test take the test again and score 95. How many stars would you have to add to the picture graph next to 95?
Type below:
__________
Answer: 4 Stars and half of a star
Explanation:
Students who scored 90 = 3 and a half star
Students who score 85 = 1 star
That means students scored 90 than 85 = 4 and a half star
Thus 4 and a half star stars would you have to add to the picture graph next to 95
Question 7.
If 2 more students took the math test and both made a score of 80, what would the picture graph look like?
Type below:
__________
Answer: There would be another row below 85. There would be half of a star next to 80.
Explanation:
There would be 5 lines and the 5th line will contain a half star
Use Picture Graphs Lesson Check Page No 98
Question 1.
Karen asked her friends to name their favorite type of dog.
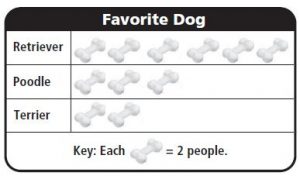
How many people chose poodles?
Options:
a. 10
b. 6
c. 4
d. 3
Answer: 6
Explanation:
If we look at the graph, there are three bones for poodles.
Each bone represents 2 people, which means 3 bones represent 6 people.
2 + 2 + 2 = 6 people chose poodles
Question 2.
Henry made a picture graph to show what topping people like on their pizza. This is his key.
Each ![]() = 6 people.
= 6 people.
What does ![]() stand for?
stand for?
Options:
a. 2 people
b. 6 people
c. 9 people
d. 12 people
Answer: 12 people
Explanation:
By seeing the picture graph we can say that
Each pizza = 6 people
Then 2 pizzas = 6 + 6
= 12 people
S, the correct answer is option D
Spiral Review
Question 3.
Estimate the sum.
5 2 3
+ 2 9 5
———
Options:
a. 900
b. 800
c. 700
d. 600
Answer: 800
Explanation:
Sum of 523 and 295
= 818
As 818 is 850 the estimated sum of 523 and 295 is 800
Thus the correct answer is 800
Question 4.
Estimate the difference.
6 1 0
– 1 8 7
——-
Options:
a. 800
b. 600
c. 500
d. 400
Answer: 400
Explanation:
Subtract 610 and 187
We get 413
413 is less than 450 and is nearer to 400
So, the estimated difference of 610 and 187 is 400
Question 5.
What is 871 rounded to the nearest ten?
Options:
a. 900
b. 880
c. 870
d. 800
Answer: 870
Explanation:
If the digit is less than 5 then the number will be decreased by 1
So, the number 871 rounded to the nearest ten is 870
Question 6.
What is 473 rounded to the nearest hundred?
Options:
a. 400
b. 470
c. 500
d. 570
Answer: 500
Explanation:
473 is greater than 450 so it must be increased
473 rounded to the nearest hundred is 500
So, the correct answer is an option (C)
Make Picture Graphs Page No 103
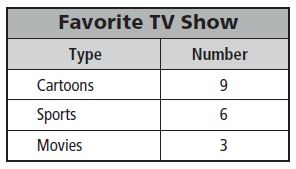
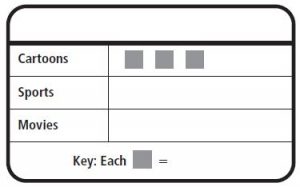
Ben asked his classmates about their favorite kind of TV show. He recorded their responses in a frequency table. Use the data in the table to make a picture graph.
Follow the steps to make a picture graph.
Step 1 Write the title at the top of the graph.
Step 2 Look at the numbers in the table. Tell how many students each picture represents for the key.
Step 3 Draw the correct number of pictures for each type of show.
Use your picture graph for 1–5.
Question 1.
What title did you give the graph?
Type below:
_________
Answer: Favorite TV Show
Question 2.
What key did you use?
________
Answer: Each ■ = 3 students
Question 3.
How many pictures did you use to represent sports?
_______ pictures
Answer: 2 pictures
Problem Solving
Question 4.
How many pictures would you draw if 12 students chose game shows as their favorite kind of TV show?
________ pictures
Answer: 4 pictures
Question 5.
What key would you use if 10 students chose cartoons?
■ = ______ students
Answer: ■ = 2 students
Explanation:
If 10 student chose cartoons, we can use a key that is a factor of 10
■■■■■ = 10
and each ■ = 2 students
Make Picture Graphs Lesson Check Page No 104
Question 1.
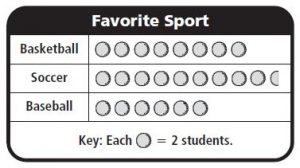
Sandy made a picture graph to show the sports her classmates like o play. How many fewer students chose baseball than chose soccer?
Options:
a. 3
b. 4
c. 7
d. 8
Answer: 7
Explanation:
Students chose Soccer = 9 and a half ball
Students chose Baseball = 6 balls
Given each ball = 2 students
So, students chose soccer = 2+2+2+2+2+2+2+2+2+1
=19 students
Students chose baseball = 2+2+2+2+2+2
= 12 students
students chose baseball than chose soccer = 19 – 12
= 7 students
Question 2.
Tommy is making a picture graph to show his friends’ favorite kind of music. He plans to use one musical note to represent 2 people. How many notes will he use to represent that 4 people chose country music?
Options:
a. 2
b. 4
c. 6
d. 8
Answer: 2
Explanation:
Given, Tommy is making a picture graph to show his friends’ favorite kind of music
One musical note = 2 people
For 4 people =?
2 + 2 people = 2 musical notes
Spiral Review
Question 3.
Find the sum.
4 9 0
+ 2 3 4
———
Options:
a. 256
b. 624
c. 664
d. 724
Answer: 724
Addition of 490 and 234 = 724
Question 4.
Sophie wrote odd numbers on her paper. Which number was NOT a number that Sophie wrote?
Options:
a. 5
b. 11
c. 13
d. 20
Answer: 20
Explanation:
Examples of odd numbers are 1,3,5,7,9,11,13,15….
20 is an even number
So, the number was NOT a number that Sophie wrote is 20
Thus the correct answer is 20
Question 5.
Miles ordered 126 books to give away at the store opening. What is 126 rounded to the nearest hundred?
Options:
a. 230
b. 200
c. 130
d. 100
Answer: 100
Explanation:
126 here 1 is rounded which is in hundred place
If the number is greater than 150 then it would equal to 200
But it is less than 150, so, 126 rounded to the nearest hundred is 100
Thus the correct option is D
Question 6.
Estimate the difference.
4 2 2
– 2 8 4
——–
Options:
a. 100
b. 180
c. 200
d. 700
Answer: 100
Explanation:
The subtraction of 422 and 284 is 138
138 is less than 150, so the estimated difference of 422 and 284 is 100.
Thus the correct answer is option (A)
Mid-Chapter Checkpoint Page No 105
Vocabulary
Choose the best term from the box.
Question 1.
A __________ uses numbers to record data.
_________
Answer: Frequency table
Question 2.
A __________ uses small pictures or symbols to show and compare information.
_________
Answer: Picture Graph
Concepts and Skills
Use the Favorite Season table for 3-6.
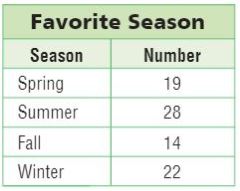
Question 3.
Which season got the most votes?
_________
Answer: Summer
From the above table, we can say that the highest number of votes is for Summer i.e., 28
Question 4.
Which season got 3 fewer votes than winter?
_________
Answer: Spring
Explanation:
Number of votes for Winter = 22
Number of votes for Spring = 19
22 – 19 = 3
So, Spring season got 3 fewer votes than winter
Question 5.
How many more students chose summer than fall?
________ students
Answer: 14 Students
Explanation:
Number of students chose summer = 28
Number students chose fall = 14
To know the students chose summer than fall
We have to subtract votes for summer and fall
28 – 14 = 14
Therefore 14 more students chose summer than fall
Question 6.
How many students chose a favorite season?
________ students
Answer: 83 students
Explanation:
Number of students chose summer = 28
Number of students chose winter = 22
Number of students chose spring = 19
Number of students chose fall = 14
Total Number of students chose favorite season = 28+22+19+14 = 83
The correct answer is 83 students
Use the Our Pets picture graph for 7-9.
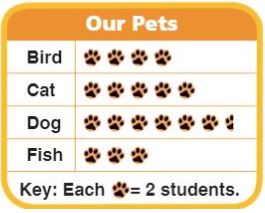
Question 7.
How many students have cats as pets?
________ students
Answer: 10 students
Explanation:
Number of paws for cats = 5
Each paw = 2 students
2+2+2+2+2 = 10 students
Question 8.
Five more students have dogs than which other pet?
__________
Answer: Bird
Explanation:
Number of paws for dogs = 6 and a half paw
Each paw = 2 students
2+2+2+2+2+2+1 = 13 students
Number of paws for bird = 4
2+2+2+2 = 8 students
13 – 8 = 5 students
Thus the answer is bird
Question 9.
How many pets in all do students have?
_________ students
Answer: 37 students
Explanation:
Number of paws for dogs = 6 and a half paw = 2+2+2+2+2+2+1 = 13 students
Number of paws for bird = 4 = 2+2+2+2 = 8 students
Number of paws for cats = 5 = 2+2+2+2+2 = 10 students
Number of paws for fish = 3 = 2+2+2 = 6 students
Total pets in all do students have = 13+8+10+6
= 37 students
Mid-Chapter Checkpoint Lesson Check Page No 106
Use the Favorite Summer Activity picture graph for 10-14.
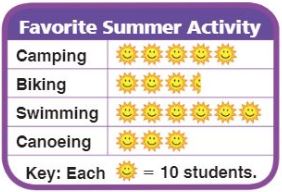
Question 10.
Some students in Brooke’s school chose their favorite summer activity. The results are in the picture graph at the right. How many students chose camping?
________ students
Answer: 50 students
Explanation:
Total students chose camping = 5
Each ![]() = 10 students
= 10 students
10+10+10+10+10 = 50
Question 11.
How many more students chose swimming than canoeing?
_______ students
Answer: 30 students
Explanation:
Total students chose swimming = 6 ![]()
Each ![]() = 10 students
= 10 students
= 10+10+10+10+10+10 = 60 students
Total students chose canoeing = 3 ![]()
= 10+10+10 = 30 students
Total students chose swimming than canoeing = 60 – 30
= 30 students
Question 12.
Which activity did 15 fewer students choose than camping?
__________
Answer: Biking
Explanation:
Total students chose camping = 5
10+10+10+10+10 = 50 students
Total students chose biking = 3 and a half picture
10+10+10+5 = 35
Biking is the activity did 15 fewer students choose than camping
Question 13.
How many pictures would you draw for biking if each ![]() = 5 students?
= 5 students?
_______
Answer: 7 pictures
Explanation:
You would draw 7 pictures
If you look at the graph there are 35 students who chose biking
So, to represent 35 students when each picture represents 5 students, we will need 7 pictures
i.e., 5+5+5+5+5+5+5 = 35 students
Question 14.
How many more students choose swimming and camping combined than biking and canoeing?
_________ students
Answer: 45 students
Explanation:
First of all, we need to find how many students chose swimming and camping combined
Total students chose swimming = 6 ![]()
Each ![]() = 10 students
= 10 students
= 10+10+10+10+10+10 = 60 students
Total students chose camping = 5
10+10+10+10+10 = 50 students
60+50 = 110 students
Next, we need to find how many students chose biking and canoeing
Total students chose canoeing = 3 ![]()
= 10+10+10 = 30 students
Total students chose biking = 3 and a half picture
10+10+10+5 = 35
Add both, we get
30+35 = 65 students
Then, we need to subtract
110 – 65 = 45 students
Therefore the students choose swimming and camping combined than biking and canoeing = 45 students
Use Bar Graphs Page No 111
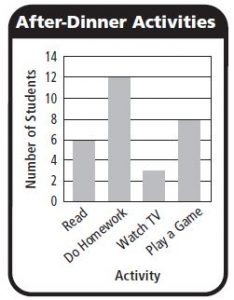
Use the After-Dinner Activities bar graph for 1–6.
The third-grade students at Case Elementary School were asked what they spent the most time doing last week after dinner. The results are shown in the bar graph at the right.
Question 1.
How many students spent the most time watching TV after dinner?
3 students
Answer: 3 students
Explanation:
From the above bar graph, we can see the activities of the students after dinner
Students spent the most time watching TV after dinner is between 2 and 4 i.e., 3 students
Question 2.
How many students in all answered the survey?
_________ students
Answer: 29 students
Explanation:
Total students who spent the most time reading after dinner = 6
Students who spent the most time doing homework after dinner = 12
Students who spent the most time watching TV after dinner = 3
Students who spent the most time playing a game after dinner = 8
Total students in all answered the survey = 6 + 12 + 3 + 8
= 29 students
Question 3.
How many students in all played a game or read?
__________ students
Answer: 14 students
Explanation:
Students who spent the most time reading after dinner = 6
Students who spent the most time playing a game after dinner = 8
Total students in all played a game or read = 6 + 8
= 14 students
Question 4.
How many fewer students read than did homework?
__________ students
Answer: 6 fewer students
Explanation:
Students who spent the most time reading after dinner = 6
Students who spent the most time doing homework after dinner = 12
To find the students read than did homework = 12 – 6
= 6 students
Question 5.
How many more students read than watched TV?
________ students
Answer: 3 more students
Explanation:
Students who spent the most time reading after dinner = 6
Students who spent the most time watching TV after dinner = 3
To find the students read than watched TV = 6 – 3
= 3 students
Problem Solving
Question 6.
Suppose 3 students changed their answers to reading instead of doing homework. Where would the bar for reading end?
It would end at _________
Answer: Halfway between 8 and 10
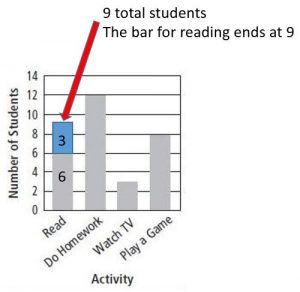
Explanation:
According to the graph, Students who spent the most time reading after dinner = 6
If 3 more students changed their answers to reading instead of doing homework, the total students would be 9 i.e., 6 + 3
Use Bar Graphs Lesson Check Page No 112
Question 1.
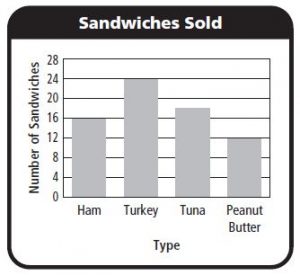
The bar graph shows the number of sandwiches sold at Lisa’s sandwich cart yesterday. How many tuna sandwiches were sold?
Options:
a. 12
b. 16
c. 18
d. 20
Answer: 18
Explanation:
According to the bar graph, tuna sandwiches sold at Lisa’s sandwich cart are between 16 to 20
The no. of tuna sandwiches were sold at Lisa’s sandwich cart = 18
So, the correct answer is option (C)
Spiral Review
Question 2.
What is 582 rounded to the nearest ten?
Options:
a. 500
b. 580
c. 590
d. 600
Answer: 580
Explanation:
If the digit is less than 5 then the digit will be increased by 1.
582, 8 is rounded here.
2 < 5 so 582 rounded to the nearest ten is 580
Question 3.
Savannah read 178 minutes last week. What is 178 rounded to the nearest hundred?
Options:
a. 400
b. 280
c. 200
d. 180
Answer: 200
Explanation:
Savannah read 178 minutes last week
178 is greater than 150, so the number 178 rounded to the nearest hundred is 200
Question 4.
Estimate the difference.
3 7 1
– 9 9
——-
Options:
a. 500
b. 400
c. 300
d. 200
Answer: 300
Explanation:
The difference between 371 and 99 is 272
272 is near to 300. Because 272 is greater than 250.
So, the estimated difference between 371 and 99 is 300
Question 5.
Estimate the difference.
6 2 5
– 2 4 8
———
Options:
a. 800
b. 500
c. 400
d. 300
Answer: 400
Explanation:
The difference between 625 and 248 is 377
377 rounded to the nearest hundred is 400
Therefore the estimated difference between 625 and 248 is 400.
Make Bar Graphs Page No 117
Ben asked some friends to name their favorite breakfast food. He recorded their choices in the frequency table at the right.
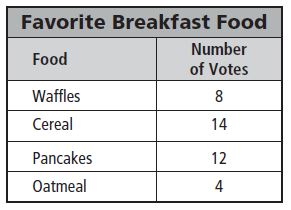
Question 1.
Complete the bar graph by using Ben’s data.
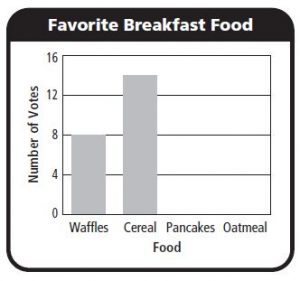
Answer:
Pancakes = 12 votes
Oatmeal = 4
Use your bar graph for 2–5.
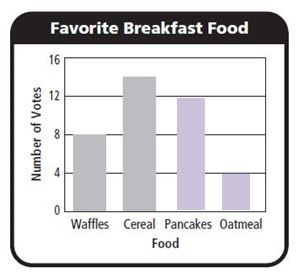
Question 2.
Which food did the most people choose as their favorite breakfast food?
__________
Answer: Cereal
Explanation:
From the above bar graph, we can say that most of the people chose Cereals as their favorite food.
Number of votes for cereals = 14
Question 3.
How many people chose waffles as their favorite breakfast food?
_________ people
Answer: 8 people
Explanation:
The bar graph shows that the number of people who chose Waffles as their favorite breakfast food is 8.
Question 4.
How did you know how high to draw the bar for pancakes?
Type below:
__________
Answer:
Since 12 people chose pancakes, I made the top of the bar end at the line for 12
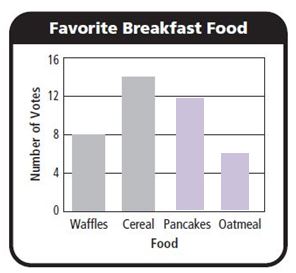
Question 5.
Suppose 6 people chose oatmeal as their favorite breakfast food. How would you change the bar graph?
Type below:
___________
Answer: I would make the bar for oatmeal end halfway between 4 and 8.
Make Bar Graphs Lesson Check Page No 118
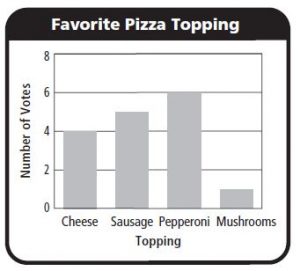
Question 1.
Gary asked his friends to name their favorite pizza topping. He recorded the results in a bar graph. How many people chose pepperoni?
Options:
a. 6
b. 5
c. 4
d. 1
Answer: 6
Explanation:
The bar graph shows that the number of people who chose pepperoni is 6
So, the correct answer is option (a)
Question 2.
Suppose 3 more friends chose mushrooms. Where would the bar for mushrooms end?
Options:
a. 2
b. 4
c. 6
d. 8
Answer: 4
Explanation:
We notice that the vertical bar for mushrooms ends at 1
1 person chose mushrooms
If 3 more friends chose mushrooms, the bar would end at 4
Then the answer is 1 + 3 = 4
Spiral Review
Question 3.
Estimate the sum.
4 5 8
+ 2 1 4
———
Options:
a. 700
b. 600
c. 300
d. 200
Answer: 700
Explanation:
Round 458 up to 500
Round 214 down to 200
Now, the estimated sum will be 500 + 200 = 700
So, the correct answer is option A
Question 4.
Matt added 14 + 0. What is the correct sum?
Options:
a. 140
b. 14
c. 1
d. 0
Answer: 14
Explanation:
Any number added by 0 is itself. So the sum of 14 + 0 = 14
The correct answer is Option B
Question 5.
There are 682 runners registered for an upcoming race. What is 682 rounded to the nearest hundred?
Options:
a. 600
b. 680
c. 700
d. 780
Answer: 700
Explanation:
If the digit to the right is more or equal than 5, then the digit in the rounding place increases by one
Change all the digits to the right of the rounding place to zero.
So, 682 rounded to the nearest hundred 700
The correct answer is option C
Question 6.
There are 187 new students this year at Maple Elementary. What is 187 rounded to the nearest ten?
Options:
a. 100
b. 180
c. 190
d. 200
Answer: 190
Explanation:
If the digit to the right is more or equal than 5, then the digit in the rounding place increases by one
Change all the digits to the right of the rounding place to zero.
So, the number 187 rounded to the nearest ten is 190
Thus the correct answer is Option C
Solve Problems Using Data Page No 123
Use the Favorite Hot Lunch bar graph for 1–3.
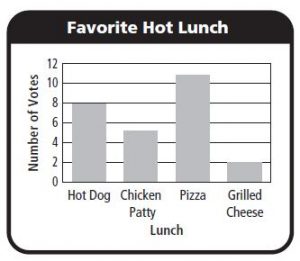
Question 1.
How many more students chose pizza than chose grilled cheese?
Think: Subtract the number of students who chose grilled cheese, 2, from the number of students who chose pizza, 11.
11 – 2 = 9
Answer: 9 more students
Question 2.
How many students did not choose chicken patty?
__________ students
Answer: 21 students
Explanation:
Number of students who chose hot dog = 8
Number of students who chose Pizza = 11
Number of students who chose grilled cheese = 2
Number of students who chose Chicken Patty = 5
Total Number of students who did not choose the chicken patty = 8 + 11 + 2 = 21
Question 3.
How many fewer students chose grilled cheese than chose hot dogs?
__________ fewer students
Answer: 6 fewer students
Explanation:
Number of students who chose hot dog = 8
Number of students who chose grilled cheese = 2
Subtract the number of students who chose grilled cheese from the number of students who chose a hot dog
= 8 – 2 = 6
Therefore, 6 fewer students chose grilled cheese than chose hot dogs
Use the Ways to Get to School bar graph for 4–7.
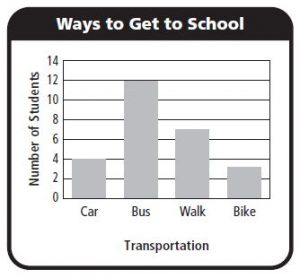
Question 4.
How many more students walk than ride in a car to get to school?
________ more students
Answer: 3 more students
Explanation:
No. of students walk to get to school = 7
No. of students ride in a car to get to school = 4
Now, subtract the no. of students walk from no. of students ride in a car
We get, 7 – 4 = 3
Question 5.
How many students walk and ride a bike combined?
________ students
Answer: 10 students
Explanation:
Number of students walk to get to school = 7
Number of students ride a bike to get to school = 3
To know how many students walk and ride a bike combined
We have to add Number of students walk and ride a bike
= 7 + 3 = 10
Problem Solving
Question 6.
Is the number of students who get to school by car and bus greater than or less than the number of students who get to school by walking and biking? Explain.
Options:
a. greater
b. less
Answer: Greater than
Explanation:
4 + 12 = 16; 7 + 3 = 10; 16 > 10.
Question 7.
What if 5 more students respond that they get to school by biking? Would more students walk or ride a bike to school? Explain.
________
Answer: Bike
Explanation:
7 students walk; 3 + 5 = 8 students bike
7 < 8
Solve Problems Using Data Lesson Check Page No 124
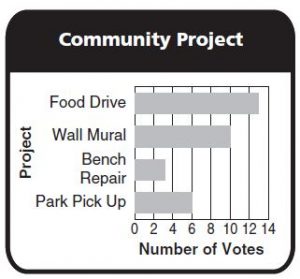
Question 1.
How many fewer votes were for bench repair than for food drive?
Options:
a. 9
b. 10
c. 16
d. 11
Answer: 10
Explanation:
Number of votes for food drive = 13
Number of votes for bench repair = 3
To find votes were for bench repair than for food drive
We need to subtract Number of votes for bench repair from Number of votes for food drive
i.e., 13 – 3 = 10
Question 2.
How many votes were there in all?
Options:
a. 14
b. 4
c. 32
d. 34
Answer: 32
Explanation:
Number of votes for food drive = 13
Number of votes for bench repair = 3
Number of votes for Wall Mural = 10
Number of votes for Park Pick up = 6
Total no. of votes = 13 + 10 + 3 + 6 = 32
Spiral Review
Question 3.
Find the difference.
6 5 0
– 1 8 9
——–
Options:
a. 461
b. 479
c. 539
d. 571
Answer: 461
Explanation:
Here we have to subtract 650 from 189
650 – 189 = 461
Question 4.
Greyson has 75 basketball cards. What is 75 rounded to the nearest ten?
Options:
a. 60
b. 70
c. 80
d. 90
Answer: 80
Explanation:
If the digit to the right is more or equal than 5, then the digit in the rounding place increases by one
Change all the digits to the right of the rounding place to zero.
So, 75 rounded to the nearest ten is 80
Question 5.
Sue spent $18 on a shirt, $39 on a jacket, and $12 on a hat. How much did she spend in all?
Options:
a. $79
b. $69
c. $57
d. $51
Answer: $69
Explanation:
Given
Sue spent $18 on a shirt
Sue spent $39 on a jacket and $12 on a hat
Total amount she spent in all = 18 + 39 + 12
= $69
Thus the correct answer is option B
Question 6.
There are 219 adults and 174 children at a ballet. How many people are at the ballet in all?
Options:
a. 45
b. 293
c. 383
d. 393
Answer: 393
Explanation:
Given that there are 219 adults and 174 children in a ballet
To know how many people are at the ballet
We have to add no. of adults with no. of children
That means 219 + 174 = 393
Thus the correct answer is Option D
Use and Make Line Plots Page No 129
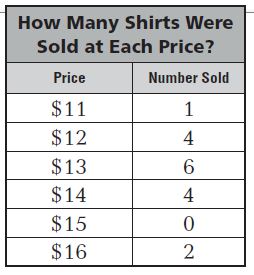
Question 1.
How many shirts sold for $12?
4 shirts
Answer: 4 shirts
Explanation:
From the above table, we can say that the no. of shirts sold for $12 is 4
Question 2.
At which price were the most shirts sold?
$ ________
Answer: $13
Explanation:
The table shows that the most number of shirts sold for $13
Question 3.
How many shirts in all were sold?
_________ shirts
Answer: 17 shirts
Explanation:
Number of shirts for $11 = 1
Number of shirts for $12 = 4
Number of shirts for $13 = 6
Number of shirts for $14 = 4
Number of shirts for $15 = 0
Number of shirts for $16 = 2
Total no. of shirts sold in all = 1 + 4 + 6 + 4 + 2 = 17
Question 4.
How many shirts were sold for $13 or more?
_________ shirts
Answer: 12 shirts
Explanation:
Number of shirts for $13 = 6
Number of shirts for $14 = 4
Number of shirts for $15 = 0
Number of shirts for $16 = 2
Total no. of shirts sold for $13 or more = 6 + 4 + 2
= 12 shirts
Problem Solving
Use the line plot above for 5–6.
Question 5.
Were more shirts sold for less than $13 or more than $13? Explain.
________
Answer: more than $13; 6 > 5
Explanation:
No. of shirts sold for less than $13 = 5
No. of shirts sold for more than $13 = 6
More shirts are sold for more than $13
Question 6.
Is there any price for which there are no data? Explain.
$ ________
Answer: Yes
Explanation:
There are no Xs above $15, there were no shirts sold for $15
Use and Make Line Plots Lesson Check Page No 130
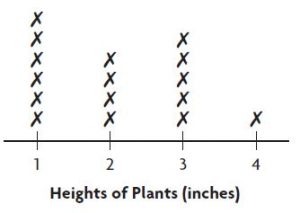
Question 1.
Pedro made a line plot to show the heights of the plants in his garden. How many plants are less than 3 inches tall?
Options:
a. 4
b. 5
c. 10
d. 16
Answer: 10
Explanation:
Number of plants of 1 inch = 6
Number of plants of 2 inches = 4
So, the number of plants less than 3 inches tall = 6 + 4
= 10 plants
So, the correct answer is option C
Question 1.
Question 2.
Find the sum.
6 4 2
+ 2 5 9
———
Options:
a. 383
b. 801
c. 891
d. 901
Answer: 901
Explanation:
Sum of 642 and 259 is 901
Thus the correct answer is option D
Question 3.
Find the difference.
4 6 0
– 3 0 9
———
Options:
a. 61
b. 151
c. 161
d. 169
Answer: 151
Explanation:
To get the answer we have to subtract 309 from 460
460 – 309 = 151
Thus the correct answer is option B
Question 4.
There were 262 hamburgers cooked for the school fair. What is 262 rounded to the nearest hundred?
Options:
a. 200
b. 260
c. 270
d. 300
Answer: 300
Explanation:
If the digit to the right is more or equal than 5, then the digit in the rounding place increases by one
Change all the digits to the right of the rounding place to zero.
262 rounded to the nearest hundred is 300
Question 5.
Makenzie has 517 stickers in her collection. What is 517 rounded to the nearest ten?
Options:
a. 500
b. 510
c. 520
d. 600
Answer: 520
Explanation:
Makenzie has 517 stickers in her collection
If the digit to the right is more or equal than 5, then the digit in the rounding place increases by one
517 rounded to the nearest ten is 520
Review/Test Page No 131
Question 1.
Mia made a tally table to record the different types of birds she saw at the bird feeder in the garden.
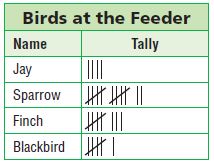
For numbers 1a–1c, select True or False for each statement.
a. Mia saw twice as many sparrows as blackbirds.
i. True
ii. False
Answer: True
Explanation:
Use the tally provided in the above table
No. of Sparrows = 12
No. of Blackbird = 6
By this, we can say that the sparrows are twice as blackbirds
So, the answer is true
Question 1.
b. Mia saw 8 finches.
i. True
ii. False
Answer: True
Explanation:
The above tally table shows that the number of finches = 8
So, the answer is true
Question 1.
c. Mia saw 4 fewer jays than blackbirds.
i. True
ii. False
Answer: False
Explanation:
No. of Blackbirds = 6
No. of Jays = 4
To know whether the question is true or false
We have to subtract 4 from 6
6 – 4 = 2
So, the answer is false
Question 2.
Jake asked 25 students in his class how close they live to school. The frequency table shows the results.
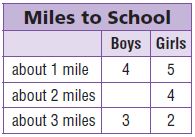
Part A
Complete the table and explain how you found the answer.
Answer: 7 boys
Explanation:
Total Number of students = 25
Now we have to add the number of students from the table
4 + 5 + 4 + 3 + 2 = 18 students
Next, subtract 18 from the total number of students, 25, to find x
25 – 18 = 7
Therefore, the missing number x is 7
Question 2.
Part B
How many more students live about 2 miles or less from school than students who live about 3 miles from school? Show your work.
________ students
Answer: 13 students
Explanation:
Number of students who live about 1 mile = 4 boys + 5 girls = 9 students
Students who live about 2 miles = 4 students
Students who live about 3 miles = 3 boys + 2 girls = 5 students
Next, we have to add total students who live about 2 miles or less = 9 + 4 = 13 students
Review/Test Page No 132
Use the picture graph for 3–6.
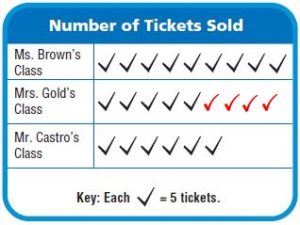
Students at Barnes School are performing in a play. The picture graph shows the number of tickets each class has sold so far.
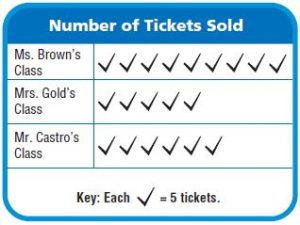
Question 3.
How many tickets were sold altogether? Explain how you found the total.
________ tickets
Answer: 100 tickets
Explanation:
Number of tickets sold in Ms. Brown’s Class = 9 ✓
Each tick = 5 tickets
5+5+5+5+5+5+5+5+5 = 45 tickets
Number of tickets sold in Mrs. Gold’s Class = 5 ✓
5+5+5+5+5 = 25 tickets
Number of ticks sold in Mr. Castro’s Class = 6 ✓
Each tick = 5 tickets
5+5+5+5+5+5 = 30
Now, we have to add the total number of tickets sold = 45 + 25 + 30 = 100 tickets
Question 4.
Choose the name from each box that makes the sentence true.
Five fewer tickets were sold by  class than
  class.
Type below:
________
Answer: Mrs. Gold’s Class than Mr. Castro’s Class
Explanation:
Number of tickets sold in Mrs. Gold’s Class = 5 ✓
5+5+5+5+5 = 25 tickets
Number of ticks sold in Mr. Castro’s Class = 6 ✓
Each tick = 5 tickets
5+5+5+5+5+5 = 30
Subtract Number of tickets sold in Mrs. Gold’s from Mr. Castro’s Class
We get 30 – 25 = 5 tickets
Question 5.
How many more tickets were sold by Ms. Brown’s class than Mr. Castro’s class?
_______ tickets
Answer: 15 tickets
Explanation:
Each tick = 5 tickets
Number of tickets sold in Ms. Brown’s Class = 9 ✓
5+5+5+5+5+5+5+5+5 = 45 tickets
Number of ticks sold in Mr. Castro’s Class = 6 ✓
5+5+5+5+5+5 = 30
Now subtract Number of ticks sold in Mr. Castro’s from Ms. Brown’s Class
45 – 30 = 15 tickets
Question 6.
What if Mrs. Gold’s class sold 20 more tickets? Draw a picture to show how the graph would change.
Type below:
_________
Answer: 20 tickets mean 5 + 5 + 5 + 5, or 4 ✓
So we would add 4 more ticks to Mrs. Gold’s Class
Review/Test Page No 133
Use the frequency table for 7–8.
Question 7.
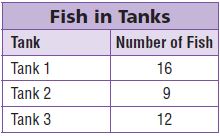
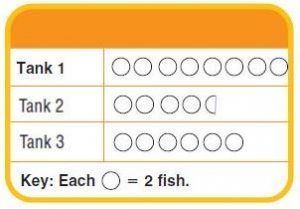
The Pet Shop keeps track of the number of fish it has for sale. The frequency table shows how many fish are in three tanks.
Part A
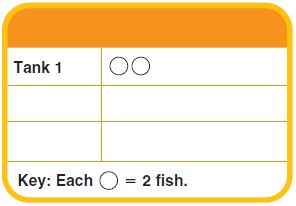
Use the data in the table to complete the picture graph.
Type below:
_________
Answer:
Given each circle= 2 fishes
Tank 1:
Tank 1 contains 16 fishes
That means 2+2+2+2+2+2+2+2 = 8 circle
Tank 2:
Tank 2 contains 9 fishes
= 2+2+2+2+1 = 4 and a half circle
Tank 3:
Tank 3 contains 12 fishes = 2+2+2+2+2+2 = 6 circle
Question 7.
Part B
How many pictures did you draw for Tank 2? Explain.
Type below:
________
Answer: 4 and a half circle
Explanation:
Tank 2 contains 9 fishes
Each circulet= 2 fishes
2+2+2+2+1
Therefore the answer is 4 and a half circle
Question 8.
Each tank can hold up to 20 fish. How many more fish can the Pet Shop put in the three tanks?
Options:
a. 60 fish
b. 23 fish
c. 20 fish
d. 33 fish
Answer: 23 fishes
Explanation:
Given that each tank can hold up to 20 fishes
Total number of tanks = 3
20+20+20 = 60 fishes
From the above table, we observe that
Tank 1 contains 16 fishes
Tank 2 contains 9 fishes
Tank 3 contains 12 fishes
Total number of fishes that all tanks contain = 12+16+9 = 37 fishes
Now, we have to subtract the number of fishes that all tanks contain from the number of fishes pet shop put in the three tanks
= 60 – 37 = 23 fishes
Review/Test Page No 134
Use the bar graph for 9–12.
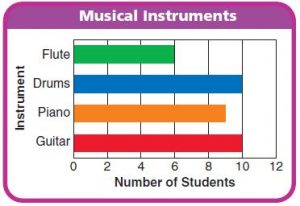
Question 9.
Three more students play the piano than which other instrument?
__________
Answer: Flute
Explanation:
The above bar graph shows the number of students who play musical instruments
From the graph, we observe that the number of students who play the flute is 6
And the number of students who play the piano is 9
Subtract Number of students play flute from piano
We get,
9 – 6 = 3
Thus the answer is Flute
Question 10.
The same number of students play which two instruments?
__________
__________
Answer: Drums and Guitar
Explanation:
The graphs the students who play drums and guitar are the same
Because the no. of students who play guitar = 10
And the no. of students who play drums = 10
Question 11.
For numbers 11a–11d, select True or False for each statement.
a. Ten more students play guitar than play flute.
i. True
ii. False
Answer: False
Explanation:
No. of students who play guitar = 10
No. of students who play flute = 6
The statement is not correct
So, the answer is false
Question 11.
b. Nine students play piano.
i. True
ii. False
Answer: True
Explanation:
The bar graph given in the above shows that the number of students who play piano is 9. So, the answer is true.
Question 11.
c. Six fewer students play flute and piano combined than play drums and guitar combined.
i. True
ii. False
Answer: False
Explanation:
No. of students who play guitar = 10
No. of students who play drums = 10
No. of students who play flute = 6
No. of students who play piano = 9
Now, add the number of students who play flute and piano = 6+9 = 15
Next, add the No. of students who play drums and guitar = 10+10 = 20
The difference between them is 5, not 6
So, the answer is false
Question 11.
d. Nine more students play piano and guitar combined than play drums.
i. True
ii. False
Answer: True
Explanation:
No. of students who play piano = 9
No. of students who play guitar = 10
Total = 10+9 = 19 students
No. of students who play drums = 10
Subtract No. of students who play drums from total students who play piano and guitar combined
That means 19 – 10 = 9
Therefore the answer is true
Question 12.
There are more students who play the trumpet than play the flute, but fewer students than play the guitar. Explain how you would change the bar graph to show the number of students who play the trumpet.
Type below:
________
Answer:
There are 6 students who play the flute and 10 students who play guitar
The no. of students who play trumpet must be between 6 and 10 i.e., 7, 8, or 9 students.
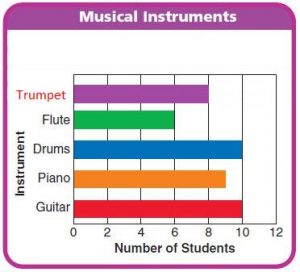
In the above example, we show the number of students who play the trumpet is 8
Review/Test Page No 135
Use the frequency table for 13–14.
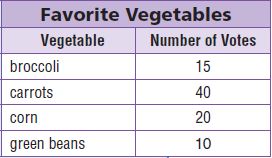
Question 13.
Part A
Use the data in the table to complete the bar graph.
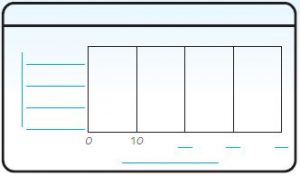
Answer:
Question 13.
Part B
How do you know how long to make the bars on your graph? How did you show 15 votes for broccoli? Explain.
Type below:
_________
Answer:
By reading Karen’s frequency table we can see that the number of votes for each favorite vegetable.
15 lies between 10 and 20. So, the bar should be drawn all the way to the midpoint between 10 and 20.
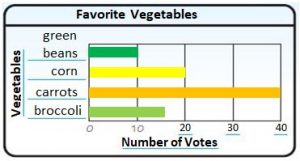
Question 14.
How many more votes did the two most popular vegetables get than the two least popular vegetables? Explain how you solved the problem.
________ votes
Answer: 35 votes
Explanation:
The two most popular vegetables are carrots and corn
And the number of votes for carrots and corn are 40 and 20
40+20 = 60 votes
The two least popular vegetables are broccoli and green beans
And the number of votes for broccoli and green beans are 15 and 10
15+10 = 25 votes
Now, Subtract the number of votes for broccoli and green beans from a number of votes for carrots and corn
60-25 = 35 students
Review/Test Page No 136
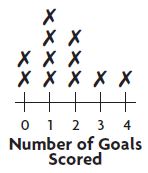
Use the line plot for 15–16.
The line plot shows the number of goals the players on Scot’s team scored.
Question 15.
For numbers 15a–15d, select True or False for each statement.
a. Three players scored 2 goals.
i. True
ii. False
Answer: True
Explanation:
One player scored 2 goals, one player scored 4 goals and one player scored 3 goals
So, the answer is true
Question 15.
b. Six players scored fewer than 2 goals.
i. True
ii. False
Answer: True
Explanation:
From the figure, we can say that 4 players scored 1 goal and 2 players scored 0
4+2 =6
So, the answer is true
Question 15 (request help)
c. There are 8 players on the team.
i. True
ii. False
Answer: False
Explanation:
We need to count all X = 11
Question 15
d. Five players scored more than 1 goal.
i. True
ii. False
Answer: True
Explanation:
More than 1 goal means 2, 3 or 4 goals
We observe that 3 players who scored 2 goals, 1 player who scored 3 goals, 1 player who scored 4 goals
Now we have to add the players who scored more than 1 goal
3+1+1 = 5
Therefore 5 players scored more than 1 goal
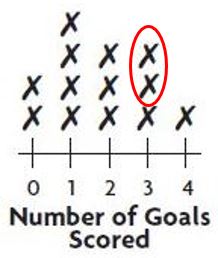
Question 16.
What if two more people played and each scored 3 goals? Describe what the line plot would look like.
Type below:
__________
Answer: We have to add two more X on the line plot 3
Use the line plot for 17–18.
Robin collected shells during her vacation. She measured the length of each shell to the nearest inch and recorded the data in a line plot.
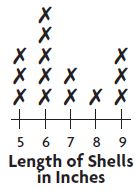
Question 17.
How many shells were 6 inches long or longer?
_________ shells
Answer: 11 shells
Explanation:
5 shells were 6 inches long
2 shells were 7 inches long
1 shell was 8 inches long
3 shells were 9 inches long
Total = 5+2+1+3 = shells
Thus the answer is 11 shells
Question 18.
How many more shells did Robin collect that were 5 inches long than 8 inches long?
________ shells
Answer: 2 shells
Explanation:
Robin collects 3 shells which were 5 inches long and 1 shell was 8 inches long.
To know how many shells did Robin collect that were 5 inches long than 8 inches long
We have to subtract the number of shells was 8 inches long from the number of shells were 5 inches long
i.e., 3 – 1 = 2 shells
In this chapter, you can the bar graphs, picture graphs, and line plots. These are graphs that are the most interesting and easiest part of this chapter. A brief explanation of the topics is discussed in the Solution Key of Grade 3 Go Math Chapter 2 Represent and Interpret Data.
Here we have provided the exercise questions along with the answers to help in practicing the chapter. You can find the different and simple methods of solving the problems in Go Math 3rd Grade Answer Key Chapter 2 Extra Practice. Hence make use of all the links and score well in the exams. If you any queries you can leave comments in the comment section below and we will respond as early as possible.