Students who are unable to solve the textbook problems can go through the Go Math Grade 6 Answer Key Chapter 12 Data Displays and Measures of Center. Refer to HMH Go Math 6th Grade Solution Key of Chapter 12 Data Displays and Measures of Center to understand the problem-solving methods in depth. Go Math Grade 6 Answer Key was explained by the experts in a unique and simple way.
Go Math Grade 6 Answer Key Chapter 12 Data Displays and Measures of Center
I know it is difficult for parents to explain the homework problems. So, in order to help them, we are providing the solutions for Go Math 6th Grade Answer Key Chapter 12 Data Displays and Measures of Center. Make use of the HMH Go Math Grade Solution Key Pdf and make your child completer their homework in time. Hence Download Grade 6 Go Math Answer Key Chapter 12 Data Displays and Measures of Center.
Lesson 1: Recognize Statistical Questions
- Share and Show – Page No. 651
- Problem Solving + Applications – Page No. 652
- Recognize Statistical Questions – Page No. 653
- Lesson Check – Page No. 654
Lesson 2: Describe Data Collection
- Share and Show – Page No. 657
- Summarize – Page No. 658
- Describe Data Collection – Page No. 659
- Lesson Check – Page No. 660
Lesson 3: Dot Plots and Frequency Tables
- Share and Show – Page No. 663
- Unlock the Problem – Page No. 664
- Dot Plots and Frequency Tables – Page No. 665
- Lesson Check – Page No. 666
Lesson 4: Histograms
- Share and Show – Page No. 669
- Problem Solving + Applications – Page No. 670
- Histograms – Page No. 671
- Lesson Check – Page No. 672
Mid-Chapter Checkpoint
Lesson 5: Investigate • Mean as Fair Share and Balance Point
- Share and Show – Page No. 677
- Page No. 678
- Mean as Fair Share and Balance Point – Page No. 679
- Lesson Check – Page No. 680
Lesson 6: Measures of Center
- Share and Show – Page No. 683
- Problem Solving + Applications – Page No. 684
- Measures of Center – Page No. 685
- Lesson Check – Page No. 686
Lesson 7: Effects of Outliers
- Share and Show – Page No. 689
- Problem Solving + Applications – Page No. 690
- Effects of Outliers – Page No. 691
- Lesson Check – Page No. 692
Lesson 8: Problem-Solving • Data Displays
- Share and Show – Page No. 695
- On Your Own – Page No. 696
- Problem Solving Data Displays – Page No. 697
- Lesson Check – Page No. 698
Chapter 12 Review/Test
- Chapter 12 Review/Test – Page No. 699
- Page No. 700
- Page No. 701
- Page No. 702
- Page No. 703
- Page No. 704
Share and Show – Page No. 651
Identify the statistical question. Explain your reasoning.
Question 1.
A. What was the low temperature in Chicago each day in March?
B. What was the low temperature in Chicago on March 7?
Answer: A is the statistical question.
Explanation: As in A temperature was asked for each day and in B temperature was asked for only one day.
Question 2.
A. How long did it take you to get to school this morning?
B. How long did it take you to get to school each morning this week?
Answer: B is the statistical question.
Explanation: In B it was asked for each morning in a week and in A It was asked for only for this morning.
Write a statistical question you could ask in the situation.
Question 3.
A student recorded the number of pets in the households of 50 sixth-graders.
Answer: How many households have one or more pets?
On Your Own
Identify the statistical question. Explain your reasoning.
Question 4.
A. How many gold medals has Finland won at each of the last 10 Winter Olympics?
B. How many gold medals did Finland win at the 2008 Winter Olympics?
Answer: A is the statistical question.
Explanation: A asks about the no.of medals won at 10 different times and in B asks about no.of medals won at 1 time.
Write a statistical question you could ask in the situation.
Question 5.
A wildlife biologist measured the length of time that 17 grizzly bears hibernated.
Answer: What was the least amount of time grizzly bears hibernated?
Question 6.
A doctor recorded the birth weights of 48 babies.
Answer: What was the highest birth weight recorded?
Problem Solving + Applications – Page No. 652
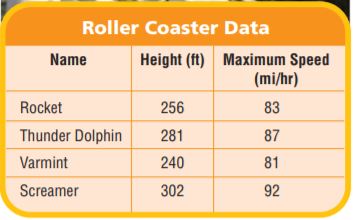
Use the table for 7 and 8.
Question 7.
Give a statistical question that you could ask about the data recorded in the table.
Answer: Which Roller coaster reaches the maximum height?
Question 8.
What statistical question could “92 mi/hr” be the answer to?
Answer: What is the maximum speed of Roller Coasters?
Question 9.
Explain A video game company will make a new game. The manager must choose between a roleplaying game and an action game. He asks his sales staff which of the last 10 released games sold the most copies. Explain why this is a statistical question.
Answer: As the manager asks his sales staff about the last 10 released games and most sold-out copies, so it is a statistical question.
Question 10.
Think of a topic. Record a set of data for the topic. Write a statistical question that you could ask about your data.
Answer: John spend 10 hours to watch TV in each week.
Explanation: What was the time spent by the John to watch TV in each week?
Question 11.
For numbers 11a–11d, choose Yes or No to indicate whether the question is a statistical question.
11a. How many minutes did it take Ethan to complete his homework last night?
11b. How many minutes did it take Madison to complete her homework each night this week?
11c. How many more minutes did Andrew spend on homework on Tuesday than on Thursday?
11d. What was the longest amount of time Abigail spent on homework this week?
11a. ____________
11b. ____________
11c. ____________
11d. ____________
Answer:
11a. No.
Explanation: The question asked only about last night’s homework, so it is not a statistical question.
11b. Yes
Explanation: As the question was asked for each night in a week, so it is a statistical question.
11c. No
Explanation: The question is about the differences in the duration of homework at a time, so it is not a statistical question.
11d. Yes
Explanation: As the question is on the longest amount of time on homework, so it is a statistical question.
Recognize Statistical Questions – Page No. 653
Identify the statistical question. Explain your reasoning.
Question 1.
A. How many touchdowns did the quarterback throw during the last game of the season?
B. How many touchdowns did the quarterback throw each game of the season?
Answer: B is the statistical question.
Explanation: In A asks for no.of touchdowns in the last game and in B asks for no.of touchdowns in each game.
Question 2.
A. What was the score in the first frame of a bowling game?
B. What are the scores in 10 frames of a bowling game?
Answer: B is the statistical question.
Explanation: In A, asks for only for the first frame, and in B asks for 10 frames and score in each frame.
Question 3.
A. How many hours of television did you watch each day this week?
B. How many hours of television did you watch on Saturday?
Answer: A is the statistical question.
Explanation: In A, the question was asked for no.of hour’s television for each day in a week. And in B the question was asked for only for Saturday.
Write a statistical question you could ask in the situation.
Question 4.
A teacher recorded the test scores of her students.
Answer: What was the highest test score recorded?
Question 5.
A car salesman knows how many of each model of a car was sold in a month.
Answer: What was the least sold model of the car?
Problem Solving
Question 6.
The city tracked the amount of waste that was recycled from 2000 to 2007. Write a statistical question about the situation.
Answer: What was the amount of waste that was recycled for each year from 2000 to 2007?
Question 7.
The daily low temperature is recorded for a week. Write a statistical question about the situation.
Answer: What was the daily low temperature recorded each day this week?
Question 8.
Write three statistical questions that you could use to gather data about your family. Explain why the questions are statistical.
Answer:
Which family member was oldest?
Which family member was tallest?
Which family member has the highest income?
Lesson Check – Page No. 654
Question 1.
Elise says that the question “Do you have any siblings?” is a statistical question. Mark says that “How many siblings do you have?” is a statistical question. Who is correct?
Answer: How many siblings do you have? is a statistical question. So Mark is correct.
Question 2.
Kate says that “What was the lowest amount of precipitation in one month last year?” is a statistical question. Mike says that “What is the speed limit?” is a statistical question. Who is correct?
Answer: What was the lowest amount of precipitation in one month last year?. Is a statistical question. So Kate is correct.
Spiral Review
Question 3.
A regular decagon has side lengths of 4 centimeters long. If the decagon is divided into 10 congruent triangles, each has an approximate height of 6.2 centimeters. What is the approximate area of the decagon?
_______ cm2
Answer: 124 cm2
Explanation: Area= ½ b×h
= ½ 46.2
= 26.2
= 12.4 cm2
So the area of the decagon is 1012.4= 124 cm2
Question 4.
Mikki uses the net shown to make a solid figure.
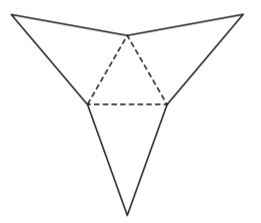
What solid figure does Mikki make?
Answer: Triangular pyramid.
Explanation: Mikki makes a Triangular pyramid.
Question 5.
A prism is filled with 30 cubes with \(\frac{1}{2}\)-unit side lengths. What is the volume of the prism in cubic units?
_______ \(\frac{□}{□}\) cubic units.
Answer: 3.75 cubic units.
Explanation: As it takes 8 cubes with a side length of ½ to form a unit cube, so the volume of the cube is 308= 3.75 cubic units.
Question 6.
A tank in the shape of a rectangular prism has a length of 22 inches, a width of 12 inches, and a height of 15 inches. If the tank is filled halfway with water, how much water is in the tank?
_______ in.3
Answer: 1980 in3
Explanation:
The volume of a rectangular prism= LWH
= 22×12×15
= 3960 in3
As the tank was filled halfway with water, so 3960÷2= 1980 in3
Share and Show – Page No. 657
Describe the data set by listing the attribute measured, the unit of measure, the likely means of measurement, and the number of observations.
Question 1.
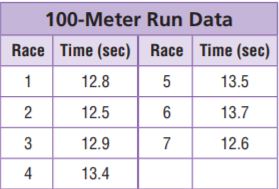
Greg’s 100-meter race results.
Answer:
The attribute is the Duration of run data.
The unit of measure is Seconds.
The likely means of measurement was taken on Stopwatch.
No.of observations are 7.
Question 2.
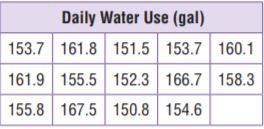
The Andrews family’s water use.
Answer:
The attribute is the amount of water used daily.
The unit of measure is Gallons.
The likely means of measurement was taken on Water meter.
No.of observations are 14.
On Your Own
Question 3.
Practice: Copy and Solve Collect data on one of the topics listed below. You may wish to work with other students. Make a chart of your results. Then describe the data set.
- Weights of cereal boxes, soup cans, or other items
- Numbers of family members
- Lengths of time to multiply two 2-digit numbers
- Numbers of pets in families
- Lengths of forearm (elbow to fingertip)
- Numbers of pages in books
Answer:
The attribute is the Number of pages in books.
The unit of measure is Numbers.
The likely means of measurement were counting.
No.of observations are 6.
Question 4.
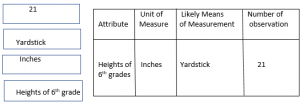
Describe the data set by writing the attribute measured, the unit of measure, the likely means of measurement, and the number of observations in the correct location on the chart.
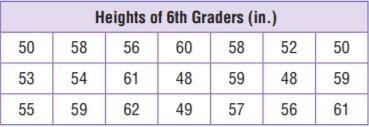

Answer:
Summarize – Page No. 658
When you summarize a reading passage, you restate the most important information in a shortened form. This allows you to understand more easily what you have read. Read the following passage:
A biologist is studying green anacondas. The green anaconda is the largest snake in the world. Finding the length of any snake is difficult because the snake can curl up or stretch out while being measured. Finding the length of a green anaconda is doubly difficult because of the animal’s great size and strength.
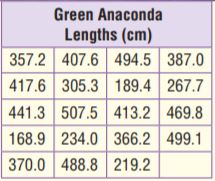
The standard method for measuring a green anaconda is to calm the snake, lay a piece of string along its entire length, and then measure the length of the string. The table at the right gives data collected by the biologist using the string method.
Question 5.
Analyze Summarize the passage in your own words
Answer: The world’s largest snake in the world is green anacondas. Finding the length of these green anacondas is very difficult because of the animal’s great size and strength. So there is a standard method for measuring. Firstly calm the snake, then lay a piece of string along its entire length, and then measure the length of the string.
Question 6.
Use your summary to name the attribute the biologist was measuring. Describe how the biologist measured this attribute.
Answer:
The attribute the biologist was measuring green anacondas. And the biologist measured by lay a piece of string along its entire length, and then measure the length of the string.
Question 7.
Give any other information that is important for describing the data set.
Answer:
Unit of measure is Centimeters
No.of observations are 19
Question 8.
Write the greatest green anaconda length that the biologist measured in feet. Round your answer to the nearest foot. (Hint: 1 foot is equal to about 30 centimeters.)
Answer: 507.5 cm, 17 feet
Explanation: The greatest green anaconda length that the biologist measured was 507.5 cm. As 1 foot= 30 cm, so 507.5÷30= 16.9 feet round off to 17 feet.
Describe Data Collection – Page No. 659
Describe the data set by listing the attribute measured, the unit of measure, the likely means of measurement, and the number of observations.
Question 1.
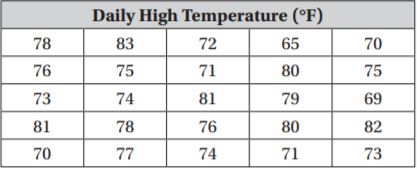
Daily temperature
Answer:
The attribute is Daily Temperature.
The unit of measure is Fahrenheit.
The likely means of measurement is Thermometer
No.of observations are 25.
Question 2.
Plant heights

Answer:
The attribute is the Height of plants
The unit of measure in inches.
The likely means of measurement is the Ruler.
No.of observations are 10.
Question 3.
Cereal in boxes

Answer:
The attribute is the Amount of Cereal in Boxes
The unit of measure is Cup.
The likely means of measurement is measuring cup
No.of observations are 16.
Question 4.
Dog weights

Answer:
The attribute is Dog weights.
The unit of measure is Pounds.
The likely means of measurement is scale.
No.of observations are 8.
Problem Solving
Question 5.
The table below gives the amount of time Preston spends on homework. Name the likely means of measurement.

Answer:
The likely means of measurement is Clock.
Question 6.
The table below shows the speed of cars on a highway. Name the unit of measure.

Answer: The unit of measure is miles per hour.
Question 7.
Gather data about the heights of your family members or friends. Then describe how you collected the data set.
Answer:
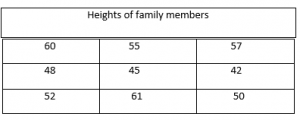
Lesson Check – Page No. 660
Question 1.
What is the attribute of the data set shown in the table?

Answer: The attribute is the Mass of produce.
Question 2.
What is the number of observations of the data set shown below?

Answer:
No.of observation: 6
Spiral Review
Question 3.
What is the area of the figure shown below?
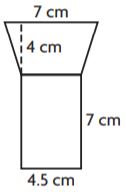
_______ cm2
Answer: 23 cm2
Explanation:
Area of the rectangle= Length×width
= 7×4.5
= 31.5 cm2
Area of trapezoid= 1/2 ×(b1+b2)×h
= 1/2 ×(7+4.5)×4
= 11.5×2
= 23 cm2
Question 4.
Each base of a triangular prism has an area of 43 square centimeters. Each lateral face has an area of 25 square centimeters. What is the surface area of the prism?
_______ cm2
Answer: 161 cm2
Explanation:
The surface area of the prism is 2×43+3×25
= 86+ 75
= 161 cm2
Question 5.
How much sand can this container hold?
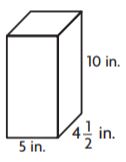
_______ in.3
Answer: 225 in.3
Explanation:
Volume= Length×width×Height
= 5×10×4 1/2
= 5 × 10 × 5/2
= 5×5×9
= 225 in.3
Question 6.
Jay says that “How much does Rover weigh today?” is a statistical question. Kim says that “How long are the puppies’ tails in the pet store?” is a statistical question. Who is NOT correct?
Answer: “How much does Rover weigh today?” is not correct as it is not a statistical question.
Share and Show – Page No. 663
For 1−4, use the data at right.
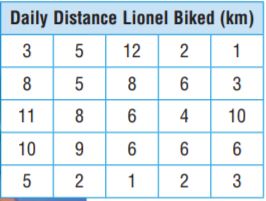
Question 1.
Complete the dot plot.

Answer:
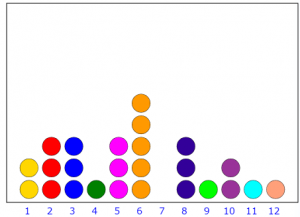
Question 2.
What was the most common distance Lionel biked? How do you know?
Answer: The most common distance Lionel biked is 6 km.
Question 3.
Make a frequency table. Use the intervals 1−3 km, 4−6 km, 7−9 km, and 10−12 km.
Answer:
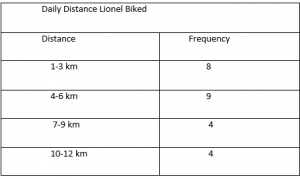
Question 4.
Make a relative frequency table. Use the same intervals as in Exercise 3.
Answer:
As there are 25 data values, so
1-3 km 8÷25= 0.32= 32% relative frequency.
4-6 km 9÷25= 0.36= 36% relative frequency.
7-9 km 4÷25= 0.16= 16% relative frequency.
10-12 km 4÷25= 0.16= 16% relative frequency.
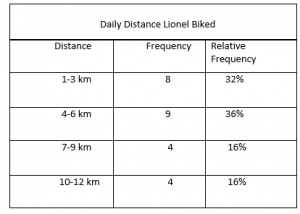
On Your Own
Practice: Copy and Solve For 5−9, use the table.
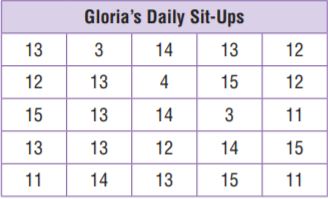
Question 5.
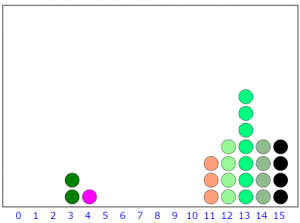
Make a dot plot of the data.
Answer:
Question 6.
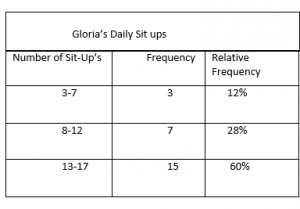
Make a frequency table of the data with three intervals.
Answer:

Question 7.
Make a relative frequency table of the data with three intervals.
Answer:
As there are 25 data values, so
3-7 3÷25= 0.12= 12% relative frequency.
8-12 7÷25= 0.28= 28% relative frequency.
13-17 15÷25= 0.6= 60% relative frequency.
Question 8.
Describe how you decided on the intervals for the frequency table.
Answer: As we found 3 intervals of equal size that cover the full range of data values.
Question 9.
Could someone use the information in the frequency table to make a dot plot? Explain.
Answer: No. Because the data is grouped in intervals, but a dot plot requires individual data values.
Unlock the Problem – Page No. 664
Question 10.
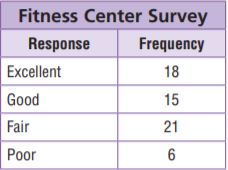
The manager of a fitness center asked members to rate the fitness center. The results of the survey are shown in the frequency table. What percent of members in the survey rated the center as excellent or good?
a. What do you need to find?
Answer: We need to find what percent of members in the survey rated the center as excellent or good.
Question 10.
b. How can you use relative frequency to help you solve the problem?
Answer: We can solve by adding the relative frequencies of excellent and good responses.
Question 10.
c. Show the steps you use to solve the problem.
Answer: 30%, 25%.
Explanation:
The total no.of responses are 18+15+21+6= 60. So the percent for excellent and good responses are
18÷60= 0.3= 30%
15÷60= 0.25= 25%
Question 10.
d. Complete the sentences.
Answer:
The percent of members who were rated excellent is 30%
The percent of members who were rated good is 25%
So total members rated excellent and good are 30%+25%= 55%
Question 11.
Use the table above. What is the difference in percent of the members in the survey that rated the fitness center as poor versus excellent?
_________ %
Answer: 20%.
Explanation: The percents for poor responses are 6÷60= 0.1= 10%, so the difference in the percent of the members in the survey that rated the fitness center as poor versus excellent is 30%-10%= 20%.
Question 12.
Julie kept a record of the number of minutes she spent reading for 20 days. Complete the frequency table by finding the frequency and the relative frequency (%).

Answer:
As there are 20 data values, so
30 mins 8÷20= 0.4= 40% relative frequency.
45 mins 4÷20= 0.2= 20% relative frequency.
60 mins 3÷20= 0.15= 15% relative frequency.
Dot Plots and Frequency Tables – Page No. 665
For 1–4, use the chart.
Question 1.
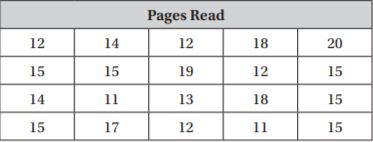
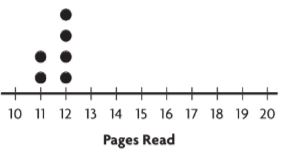
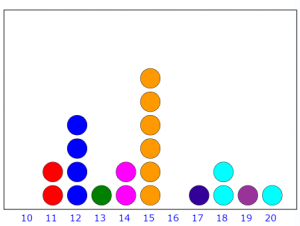
The chart shows the number of pages of a novel that Julia reads each day. Complete the dot plot using the data in the table.
Answer:
Question 2.
What number of pages does Julia read most often? Explain.
Answer: Julia reads most often 15 pages because we can see in the dot plot as 15 was the highest.
Question 3.
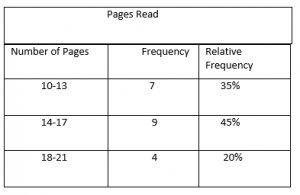
Make a frequency table in the space below. Use the intervals 10–13, 14–17, and 18–21.
Answer:

Question 4.
Make a relative frequency table in the space below.
Answer:
As there are 20 data values, so
10-13 7÷20= 0.35= 35% relative frequency.
14-17 9÷20= 0.45= 45% relative frequency.
18-21 4÷20= 0.2= 20% relative frequency.
Problem Solving
Question 5.
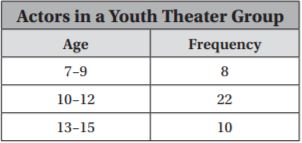
The frequency table shows the ages of the actors in a youth theater group. What percent of the actors are 10 to 12 years old?
_______ %
Answer: 55%
Explanation:
As there are 8+22+10= 40 data values, so the percent of the actors are 10 to 12 years old is
22÷40= 0.55= 55%.
Question 6.
Explain how dot plots and frequency tables are alike and how they are different.
Answer: As the dot plot is similar to the frequency table and the frequencies are represented with dots instead of using numbers each dot represents a data point.
Lesson Check – Page No. 666
Question 1.
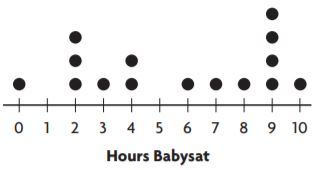
The dot plot shows the number of hours Mai babysat each week. How many hours is Mai most likely to babysit?
_______ hours
Answer: Mai is most likely to babysit for 9 hours.
Explanation: As we can see dot plot with the highest dots is 9 hours. So Mai is most likely to babysit for 9 hours.
Question 2.
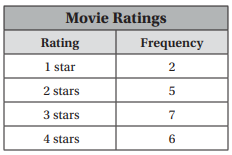
The frequency table shows the ratings that a movie received from online reviewers. What percent of the reviewers gave the movie a 4-star rating?
_______ %
Answer: 30%.
Explanation: The percent of reviewers gave the movie a 4-star rating are 6/20
= 0.30
= 30%
Spiral Review
Question 3.
The dimensions of a rectangular playground are 50 times the dimensions of a scale drawing of the playground. The area of the scale drawing is 6 square feet. What is the area of the actual playground?
_______ square feet
Answer: 15,000 square feet.
Explanation: The area of the actual playground is
= 6×50×50
= 15,000 square feet.
Question 4.
A square pyramid has a base side length of 8 feet. The height of each lateral face is 12 feet. What is the surface area of the pyramid?
_______ ft2
Answer: 256 ft2
Explanation:
The area of the base is 8×8= 64 ft2
The area of one face is 1/2 × 8 × 12
= 4×12
= 48 ft2
So the surface area of the pyramid is 64+ 4×48
= 64+192
= 256 ft2
Question 5.
A gift box is in the shape of a rectangular prism. The box has a length of 24 centimeters, a width of 10 centimeters, and a height of 13 centimeters. What is the volume of the box?
_______ cm3
Answer: 3,120 cm3
Explanation: Volume of the box= Length×width×height
= 24×10×13
= 3,120 cm3
Question 6.
For a science experiment, Juanita records the height of a plant every day in centimeters. What is the attribute measured in her experiment?
Answer: The attribute measured in her experiment was height.
Share and Show – Page No. 669
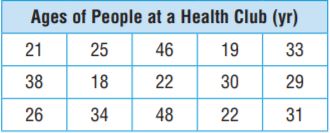
For 1–4, use the data at right.
Question 1.
Complete the frequency table for the age data in the table at right.

Answer:
Question 2.
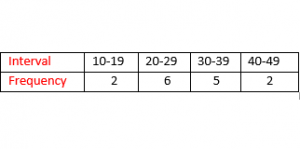
Complete the histogram for the data.
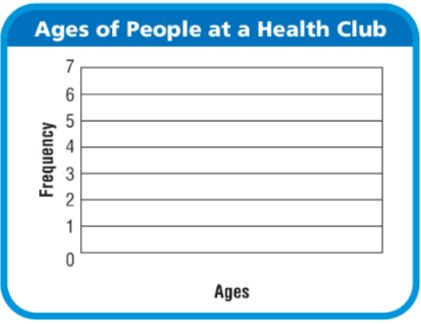
Answer:
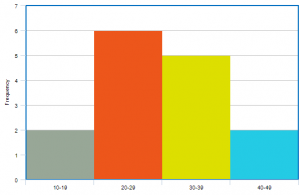
Question 3.
Use your histogram to find the number of people at the health club who are 30 or older.
_______ people
Answer: 7 people.
Explanation: The people from 30-39 are 5 and from 40-49 are 2 people.
Question 4.
Use your histogram to determine the percent of the people at the health club who are 20–29 years old.
_______ %
Answer: 40%.
Explanation: The data value is 2+6+5+2= 15, so the percent of the people at the health club who are 20–29 years old are
6÷15= 0.4= 40%.
On Your Own
Practice: Copy and Solve For 5–7, use the table.
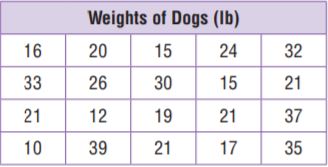
Question 5.
Make a histogram of the data using the intervals 10–19, 20–29, and 30–39.
Answer:
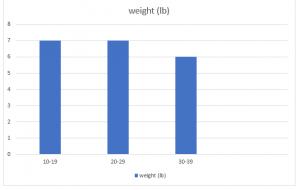
Question 6.
Make a histogram of the data using the intervals 10–14, 15–19, 20–24, 25–29, 30–34, and 35–39.
Answer:
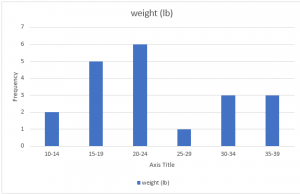
Question 7.
Compare Explain how using different intervals changed the appearance of your histogram.
Answer: In the histogram, smaller intervals shows that most of the data are clustered between 15 and 24. And larger intervals show that the data is evenly spread out.
Problem Solving + Applications – Page No. 670
The histogram shows the hourly salaries, to the nearest dollar, of the employees at a small company. Use the histogram to solve 8–11.
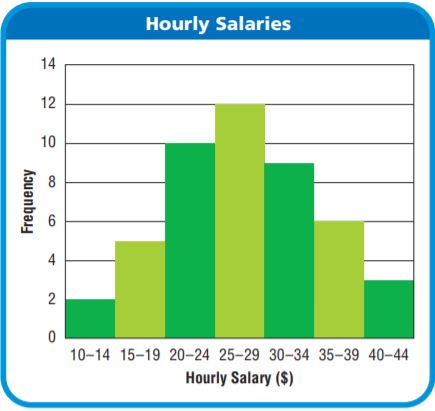
Question 8.
How many employees make less than $20 per hour?
_______ employees
Answer: 7 employees.
Explanation: 7 employees make less than $20 per hour.
Question 9.
How many employees work at the company? Explain how you know.
_______ employees
Answer: 47 employees.
Explanation: As 2+5+10+12+9+6+3= 47 employees work at the company.
Question 10.
Pose a Problem Write and solve a new problem that uses the histogram.
Answer: How many employees make more than $40 per hour?
Explanation: 3 employees.
Question 11.
Analyze Describe the overall shape of the histogram. What does this tell you about the salaries at the company?
Answer: The histogram shows that the employees are high at the interval of $25-$29 and it tells us that there is the same number of employees with salaries less than $25 as there are with salaries greater than $29.
Question 12.
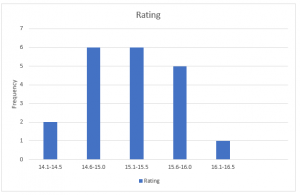
The frequency table shows the TV ratings for the show American Singer. Complete the histogram for the data.
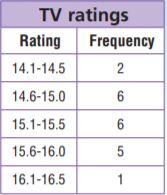
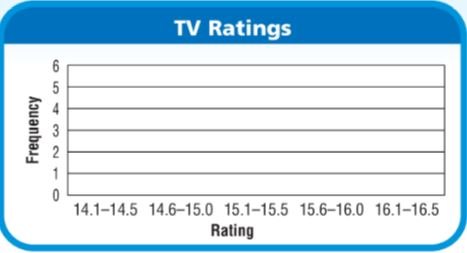
Answer:
Histograms – Page No. 671
For 1–4 use the data at right.

Question 1.
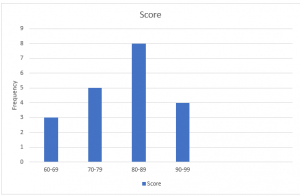
Complete the histogram for the data.
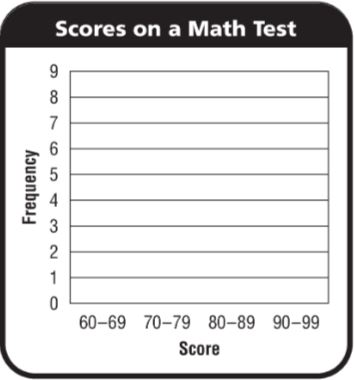
Answer:
Question 2.
What do the numbers on the y-axis represent?
Answer: The numbers on the y-axis represent the number of students.
Question 3.
How many students scored from 60 to 69?
_______ students
Answer: 3 students scored 60 to 69
Question 4.
Use your histogram to find the number of students who got a score of 80 or greater. Explain.
_______ students
Answer: 12 students.
Explanation: Students who scored 80-89 are 8 students and students who scored 90-99 are 4 students. So total students are
8+4= 12 students.
Problem Solving
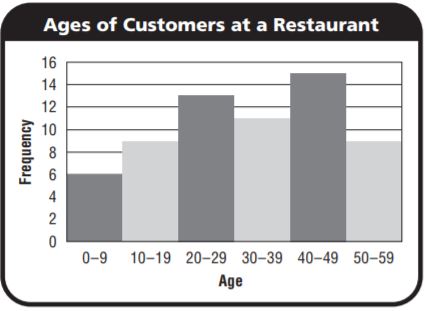
For 5–6, use the histogram.
Question 5.
For which two age groups are there the same number of customers?
Answer: The same number of customers is 10-19 and 50-59.
Question 6.
How many customers are in the restaurant? How do you know?
_______ customers
Answer: 63 customers
Explanation: Total number of customers are 6+9+13+11+15+9= 63 customers. By adding all frequencies we can get a number of customers.
Question 7.
Write a letter to another student that explains how to make a histogram and what type of data a histogram displays.
Answer: A histogram represents a bar graph with a vertical axis and a horizontal axis. The histogram displays the vertical axis with frequencies and the horizontal axis with a certain amount of intervals. We must place the intervals from lower to higher, and the height of each bar should be equal to the frequency of its corresponding intervals.
Lesson Check – Page No. 672
Question 1.
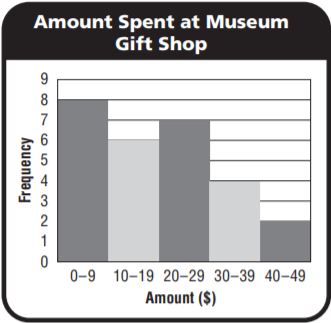
The histogram shows the amount, to the nearest dollar, that customers spent at a museum gift shop. How many customers spent less than $20?
_______ customers
Answer: 14 customers.
Explanation: The number of customers who spent less than $20 is 8+6=14 customers.
Question 2.
Use the histogram in Problem 1. How many customers bought something at the gift shop?
_______ customers
Answer: 27 customers.
Explanation: The number of customers who bought something at the gift shop is 8+6+7+4+2= 27 customers.
Spiral Review
Question 3.
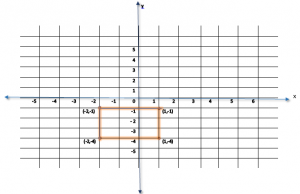
Marguerite drew a rectangle with vertices A(−2, −1), B(−2, −4), and C(1, −4). What are the coordinates of the fourth vertex?
Answer: As Marguerite draw a rectangle, so the fourth vertex is D(1,-1)
Explanation:
Question 4.
A rectangular swimming pool can hold 1,408 cubic feet of water. The pool is 22 feet long and has a depth of 4 feet. What is the width of the pool?
_______ feet
Answer: 16 feet
Explanation: Volume= LWH
1408= 22×W×4
W= 1408÷88
= 16 feet
Question 5.
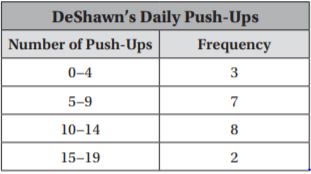
DeShawn is using this frequency table to make a relative frequency table. What percent should he write in the Relative Frequency column for 5 to 9 push-ups?
_______ %
Answer: 35%
Explanation: Data Values are 3+7+8+2= 20
As there are 3+7+8+2= 20 data values, so
5-9 7÷20= 0.35= 35% relative frequency.
Mid-Chapter Checkpoint – Vocabulary – Page No. 673
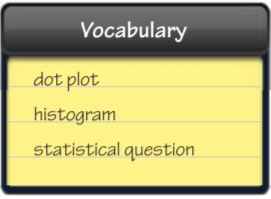
Choose the best term from the box to complete the sentence.
Question 1.
A _____ is a kind of bar graph that shows the frequency of data grouped into intervals.
Answer: A histogram is a kind of bar graph that shows the frequency of data grouped into intervals.
Question 2.
A question that asks about a set of data that varies is called a _____.
Answer: A question that asks about a set of data that varies is called a statistical question.
Concepts and Skills
Question 3.
A sports reporter records the number of touchdowns scored each week during the football season. What statistical question could the reporter ask about the data?
Answer: What was the greatest number of touchdowns scored in one week?
Question 4.
Flora records her pet hamster’s weight once every week for one year. How many observations does she make?
_______ observations
Answer: 52 observations.
Explanation: As there are 52 weeks in a year, so Flora makes 52 observations.
Question 5.
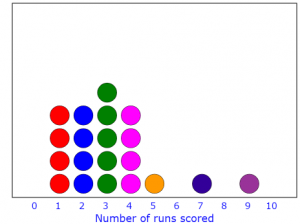
The number of runs scored by a baseball team in 20 games is given below. Draw a dot plot of the data and use it to find the most common number of runs scored in a game.

Answer:
Page No. 674
Question 6.
Write a statistical question you could ask about a set of data that shows the times visitors arrived at an amusement park.
Answer: How many visitors arrived at an amusement park each hour?
Question 7.
A school principal is trying to decide how long the breaks should be between periods. He plans to time how long it takes several students to get from one classroom to another. Name a tool he could use to collect the data.
Answer: He could use to collect the data by stopwatch.
Question 8.
The U.S. Mint uses very strict standards when making coins. On a tour of the mint, Casey asks, “How much copper is in each penny?” Lenny asks, “What is the value of a nickel?” Who asked a statistical question?
Answer: Casey asked a statistical question.
Question 9.
Chen checks the temperature at dawn and at dusk every day for a week for a science project. How many observations does he make?
_______ observations
Answer: 14 observations.
Explanation: As there are 7 days in a week, so he makes 7×2= 14 observations.
Question 10.
The table shows the lengths of the songs played by a radio station during a 90-minute period. Alicia is making a histogram of the data. What frequency should she show for the interval 160–169 seconds?
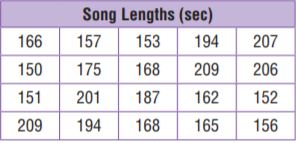
Answer: 5.
Explanation: As there are 5 values in between 160-169, so Alicia makes a frequency of 5 for the interval 160-169 seconds.
Share and Show – Page No. 677
Use counters to find the mean of the data set.
Question 1.
On the first day of a school fundraiser, five students sell 1, 1, 2, 2, and 4 gift boxes of candy.
The mean of the data set is _______.
Answer: 2.
Explanation: The mean of the data set is
= \(\frac{1+1+2+2+4}{5}
=\frac{10}{5}\)
= 2.
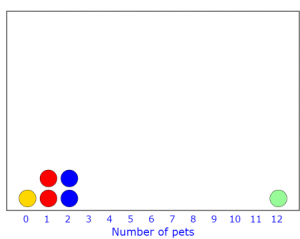
Make a dot plot for the data set and use it to check whether the given value is a balance point for the data set.
Question 2.
Rosanna’s friends have 0, 1, 1, 2, 2, and 12 pets at home. Rosanna says the mean of the data is 3. Is Rosanna correct?
Answer:
Explanation: Yes, Rosanna is correct. As the mean is
= \(\frac{0+1+1+2+2+12}{6}
=\frac{18}{6}\)
= 3
So Rosanna is correct.
Problem Solving + Applications
Question 3.
Four people go to lunch, and the costs of their orders are $6, $9, $10, and $11. They want to split the bill evenly. Find each person’s fair share. Explain your work.
Each person’s fair share is $ _______ .
Answer: $9.
Explanation: Each person’s fair share is
= \(\frac{ $6+$9+$10+$11}{4}
=\frac{$36}{4}\)
= $9.
Page No. 678
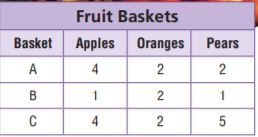
Use the table for 4–6.
Question 4.
A grocer is preparing fruit baskets to sell as holiday presents. If the grocer rearranges the apples in baskets A, B, and C so that each has the same number, how many apples will be in each basket? Use counters to find the fair share.
_______ apples
Answer: 3 apples.
Explanation: Mean for the apples are
= \(\frac{4+1+4}{3}
=\frac{9}{3}\)
= 3
So there will be 3 apples in each basket.
Question 5.
Make Arguments Can the pears be rearranged so that there is an equal whole number of pears in each basket? Explain why or why not.
Answer: No pears cannot rearrange, as three stacks of counters height are 2,1,5 so that there is an equal number in each stack, So we cannot rearrange.
Question 6.
Use counters to find the mean of the number of pears originally in baskets B and C. Draw a dot plot of the data set. Use your plot to explain why the mean you found is a balance point.
Answer: Mean= 3
Explanation: Mean= \(\frac{1+5}{2}
=\frac{6}{2}\)
= 3
As data point 1 is 2 times less than the mean and data point 5 is 2 times greater than the mean, so the points are the same distance from the mean and the mean is the balance point.

Question 7.
Four friends go to breakfast and the costs of their breakfasts are $5, $8, $9, and $10. Select True or False for each statement.
7a. The mean of the cost of the breakfasts can be found by adding each of the costs and dividing that total by 4.
7b. The mean cost of the four breakfasts is $10.
7c. The difference between the greatest cost and the mean is $2.
7d. The difference between the least cost and the mean is $2.
Answer:
7a. True
Explanation: As mean = (sum of the terms)/ (No.of terms)
7b. False
Explanation: The mean cost of the four breakfast is \(\frac{$5+$8+$9+$10}{4}
=\frac{$32}{4}\)
= $8.
7c. True
Explanation: The difference between the greatest cost and the mean is $10-$8= $2.
7d. False
Explanation: The difference between the least cost and the mean is $8-$5= $3
Mean as Fair Share and Balance Point – Page No. 679
Use counters to find the mean of the data set.
Question 1.
Six students count the number of buttons on their shirts. The students have 0, 4, 5, 2, 3, and 4 buttons.
The mean of the data set is _______ .
Answer: 3
Explanation: The mean of the data set is \(\frac{0+4+5+2+3+4}{6}
=\frac{18}{6}\)
= 3
Question 2.
Four students completed 1, 2, 2, and 3 chin-ups.
The mean of the data set is _______ .
Answer: 2
Explanation: The mean of the data set is \(\frac{1+2+2+3}{4}
=\frac{8}{4}\)
= 2.
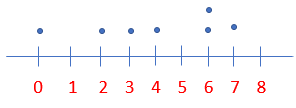
Make a dot plot for the data set and use it to check whether the given value is a balance point for the data set.
Question 3.
Sandy’s friends ate 0, 2, 3, 4, 6, 6, and 7 pretzels. Sandy says the mean of the data is 4. Is Sandy correct?
Answer: Yes, Sandy is correct.
Explanation: The mean of the data set is \(\frac{0+2+3+4+6+6+7}{7}
=\frac{28}{7}\)
= 4.
Problem Solving
Question 4.
Three baskets contain 8, 8, and 11 soaps. Can the soaps be rearranged so that there is an equal whole number of soaps in each basket? Explain why or why not.
Answer: Yes, the soaps can be rearranged.
Explanation: As the mean is 9, the soaps can be rearranged so that there is an equal whole number of soaps in each basket. And we can fit 9 in each group.
Question 5.
Five pages contain 6, 6, 9, 10, and 11 stickers. Can the stickers be rearranged so that there is an equal whole number of stickers on each page? Explain why or why not.
Answer: No
Explanation: No, we cannot rearrange the stickers. As there is a 5 stack counter which is unable to fit in for 6, 6, 9, 10, and 11 stickers
Question 6.
Describe how to use counters to find the mean of a set of data. Give a data set and list the steps to find the mean.
Answer: We will start with an unequal stack then we will move a counter from the tallest stack to the shortest stack and we will repest it until the stacks have the same height.
Lesson Check – Page No. 680
Question 1.
What is the mean of 9, 12, and 15 stamps?
The mean is _______ stamps.
Answer: 12 stamps.
Explanation: The mean is \(\frac{9+12+15}{3}
=\frac{36}{3}\)
= 12.
Question 2.
Four friends spent $9, $11, $11, and $17 on dinner. If they split the bill equally, how much does each person owe?
$ _______
Answer: $12.
Explanation: The mean is \(\frac{$9+$11+$11+$17}{4}
=\frac{$48}{4}\)
= $12.
Spiral Review
Question 3.
What figure does the net below represent?
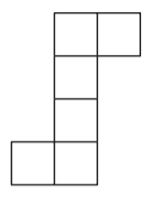
Answer: As the net has 6 equal square surfaces, it represents a cube.
Question 4.
Sarah paints the box below. She paints the whole box except for the front face. What area of the box does she paint?
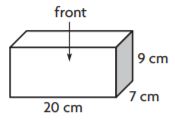
_______ cm2
Answer: 586 cm2
Explanation: The area of the box is
= 2×20×7 + 2 ×9×7 + 9×20
= 280+126+180
= 586 cm2
Question 5.
Chloe collected data and then displayed her results in the table to the right. What is the unit of measure of the data?
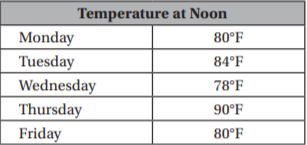
Answer: The unit of measure is Fahrenheit.
Share and Show – Page No. 683
Question 1.
Terrence records the number of e-mails he receives per day. During one week, he receives 7, 3, 10, 5, 5, 6, and 6 e-mails. What are the mean, median, and mode of the data?
Answer:
Mean: 6
Median: 6
Mode: 5,6.
Explanation:
The mean is \(\frac{7+3+10+5+5+6+6}{7}
=\frac{42}{7}\)
= 6
First, we must set the data from smallest to greatest
3,5,5,6,6,7,10
so, the median is 6.
As 5 and 6 appears twice the mode is 5,6
Question 2.
Julie goes to several grocery stores and researches the price of a 12 oz bottle of juice. Find the mean, median, and mode of the prices shown.

Answer:
The mean is $1.21
The Median is $2.08
The mode is $0.99
Explanation:
The mean is \(\frac{$0.95+$1.09+$0.99+$1.25+$0.99+$1.99}{6}
=\frac{$7.26}{6}\)
= $1.21.
First, we must set the data from smallest to greatest
$0.95,$0.99,$0.99,$1.09,$1.25,$1.99 as the count is even number we will add both middle numbers and will divide with 2
so, the median is $0.99+$1.09= $2.08÷2
= $1.04.
As $0.99 appears twice the mode is $0.99.
On Your Own
Question 3.
T.J. is training for the 200-meter dash event for his school’s track team. Find the mean, median, and mode of the times shown in the table.

Answer:
The mean is $1.21
The Median is $2.08
The mode is $0.99
Explanation:
The mean is \(\frac{22.3+22.4+23.3+24.5+22.5}{5}
=\frac{115}{5}\)
= 23
First, we must set the data from smallest to greatest
22.3,22.4,22.5,23.3,24.5
so, the median is 22.5
As no value appear twice there is no mode.
Question 4.
Make Connections Algebra The values of a data set can be represented by the expressions x, 2x, 4x, and 5x. Write the data set for x = 3 and find the mean.
The mean is _______
Answer: The mean is 9.
Explanation: As x=3, the expression is 3,2(3),4(3),5(3)
3,6,12,15
So mean= \(\frac{3+6+12+15}{4}
=\frac{36}{4}\)
= 9.
Question 5.
In the last six months, Sonia’s family used 456, 398, 655, 508, 1,186, and 625 minutes on their cell phone plan. In an effort to spend less time on the phone each month, Sonia’s family wants to try and keep the mean cell phone usage at 600 minutes or less. Over the last 6 months, by how many minutes did the mean number of minutes exceed their goal?
They exceeded their goal by _______ minutes.
Answer: 38 minutes.
Explanation: First we must find the mean
= \(\frac{456+398+655+508+1186+625}{6}=\frac{3828}{6\)
= 638
so, they exceeded their goal by 638-600= 38 minutes.
Problem Solving + Applications – Page No. 684
Sense or Nonsense?
Question 6.
Jeremy scored 85, 90, 72, 88, and 92 on five math tests, for a mean of 85.4. On the sixth test he scored a 95. He calculates his mean score for all 6 tests as shown below, but Deronda says he is incorrect. Whose answer makes sense? Whose answer is nonsense? Explain your reasoning.
Jeremy’s Work:
The mean of my first 5 test scores was 85.4, so to find the mean of all 6 test scores, I just need to find the mean of 85.4 and 95.
Mean = \(\frac{85.4+95}{2}=\frac{180.4}{2}\) = 90.2.
So, my mean score for all 6 tests is 90.2.
Deronda’s Work:
To find the mean of all 6 test scores, you need to add up all 6 scores and divide by 6.
Mean = \(\frac{85+90+72+88+92+95}{6}=\frac{522}{6}\) = 87.
So, Jeremy’s mean score for all 6 tests is 87.
Answer: Jeremy’s answer is nonsense, Deronda’s answer makes sense.
Explanation: Jeremy should add all 6 test scores and then divide the sum by 6. And Deronda used the mean formula in the right way.
Question 7.
Alex took a standardized test 4 times. His test scores were 16, 28, 24, and 32.
The mean of the test scores is _____.
The median of the test scores is _____.
The mode of the test scores is _____.
Answer:
The mean of the test scores is 25.
The median of the test scores is 26.
The mode of the test scores is there is no mode.
Explanation:
The mean of the test scores is \(\frac{16+28+24+32}{4}
= \frac{100}{4}\)
= 25.
The median of the test scores is 16,24,28,32
= \(\frac{24+28}{2}
= \frac{52}{2}\)
= 26.
As there are no repeated values, so there is no mode.
Measures of Center – Page No. 685
Use the table for 1–4.
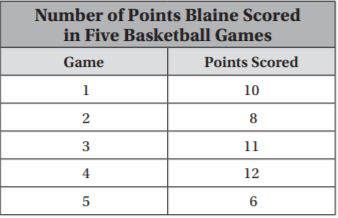
Question 1.
What is the mean of the data?
The mean is _______ points.
Answer: 9.4 points.
Explanation: The mean is \(\frac{10+8+11+12+6}{5}
=\frac{47}{5}\)
= 9.4
Question 2.
What is the median of the data?
The median is _______ points.
Answer: 10 points.
Explanation: The median is 6,8,10,11,12
10.
Question 3.
What is the mode(s) of the data?
Answer: No mode.
Explanation: As there are no repeated values, so there is no mode.
Question 4.
Suppose Blaine played a sixth game and scored 10 points during the game. Find the new mean, median, and mode.
Answer:
Mean 9.5.
Median 10.
Mode 10.
Explanation:
The mean is \(\frac{10+8+11+12+6+10}{6}
= \frac{57}{6}\)
= 9.5.
The median is 6,8,10,10,11,12
= \(\frac{10+10}{2}
= \frac{20}{2}\)
= 10.
As 10 is repeated, so the mode is 10.
Problem Solving
Question 5.
An auto manufacturer wants their line of cars to have a median gas mileage of 25 miles per gallon or higher. The gas mileage for their five models are 23, 25, 26, 29, and 19. Do their cars meet their goal? Explain.
Answer: 25.
Explanation:
The median is 19,23,25,26,29
25.
So the car meets its goal.
Question 6.
A sporting goods store is featuring several new bicycles, priced at $300, $250, $325, $780, and $350. They advertise that the average price of their bicycles is under $400. Is their ad correct? Explain.
Answer: Their ad is incorrect.
Explanation: The mean is \(\frac{$300+$250+$325+$780+$350}{5}
= \frac{$2005}{5}\)
= $401
Their ad is incorrect. As the average price is more than $400.
Question 7.
Explain how to find the mean of a set of data.
Answer: By dividing the sum of data by the number of data we can find the mean.
Lesson Check – Page No. 686
Question 1.
The prices for a video game at 5 different stores are $39.99, $44.99, $29.99, $35.99, and $31.99. What is the mode(s) of the data?
Answer: As there are no repeated values, so there is no mode.
Question 2.
Manuel is keeping track of how long he practices the saxophone each day. The table gives his practice times for the past five days. What is the mean of his practice times?
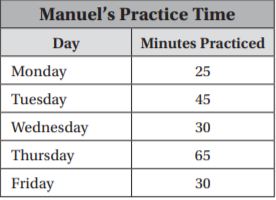
Answer: 39.
Explanation: The mean is \(\frac{25+45+30+65+30}{5}
= \frac{195}{5}\)
= 39.
Spiral Review
Question 3.
What is the surface area of the triangular prism shown below?
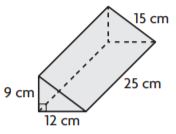
_______ cm2
Answer: 1008 cm2
Explanation: The Surface area triangular prism= 25×9+25×12+25×15+2×12×9×12
= 225+300+375+108
= 1008 cm2
Question 4.
Kate records the number of miles that she bikes each day. She displayed the number of daily miles in the dot plot below. Each dot represents the number of miles she biked in one day. How many days did she bike 4–7 miles?
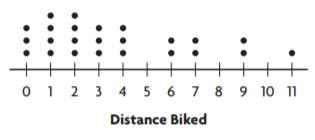
Answer: 7 days
Explanation: By counting dots from 4-7 we will get to know how many days did she bike. So it is for 7 days.
Question 5.
Six people eat breakfast together at a restaurant. The costs of their orders are $4, $5, $9, $8, $6, and $10. If they want to split the check evenly, how much should each person pay?
Answer: $7.
Explanation: The mean is \(\frac{$4+$5+$9+$8+$6+$10}{6}
= \frac{42}{6}\)
= $7.
So each should pay $7.
Share and Show – Page No. 689
Question 1.
Find the outlier by drawing a dot plot of the data.


Answer: The outlier is 15.
Explanation:
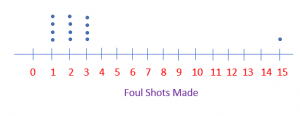
Question 2.
The prices of the X-40 Laser Printer at five different stores are $99, $68, $98, $105, and $90. The mean price is $92, and the median price is $98. Identify the outlier and describe how the mean and median are affected by it.
Answer: The outlier is $68.
Explanation: Outliers are the data values which won’t fit the pattern. In this $68 is an outlier.
The mean price without outlier is \(\frac{$99+$98+$105+$90}{4}
= \frac{392}{4}\)
= $98.
The median is $90,$98,$99,$105
= \(\frac{$98+$99}{2}
= \frac{$197}{2}\)
= $98.5
Question 3.
Identify the outlier in the data set of melon weights. Then describe the effect the outlier has on the mean and median.

Answer: The outlier is 14.
Explanation:
The mean with outlier is \(\frac{47+45+48+45+49+47+14+45+51+46+47}{11}
= \frac{$484}{11}\)
= 44 oz.
The mean without outlier is \(\frac{47+45+48+45+49+47+45+51+46+47}{10}
= \frac{$470}{10}\)
= 47 oz.
The outlier decreases mean from 47 to 44 oz.
The median is 14,45,45,45,46,47,47,47,48,49,51.
= 47
There is no change in the median with the outlier.
Question 4.
Use Reasoning In a set of Joanne’s test scores, there is an outlier. On the day of one of those tests, Joanne had the flu. Do you think the outlier is greater or less than the rest of her scores? Explain
Answer: The outlier is less than the rest of her score because if Joanne had the flu her test score from the day is probably lower thn her score.
Problem Solving + Applications – Page No. 690
Use the table for 5–7.
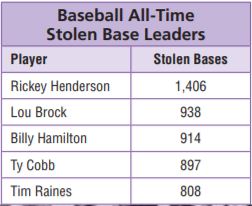
Question 5.
Which player’s number of stolen bases is an outlier?
Answer: Rickey Henderson.
Explanation: The player is Rickey Henderson number 1,406 is an outlier.
Question 6.
What effect does the outlier have on the median of the data set?
Answer: The outlier increases from 905.5 to 914.
Explanation: The median with outlier is 914 and the median without outlier is \(\frac{897+914}{2}
= \frac{1811}{2}\)
= 905.5
The outlier increases from 905.5 to 914.
Question 7.
Miguel wrote that the mean of the data set is 992.6. Is this the mean with or without the outlier? Explain how you can tell without doing a calculation.
Answer: This is the mean is with outlier as the mean 992.6 is greater than the data values except for the outlier.
Question 8.
Does an outlier have any effect on the mode of a data set? Explain
Answer: The outlier will not effect the mode of a data set because an outlier must be greater or lesser than the data value, so it cannot be the same as any other data value.
Question 9.
The prices of mesh athletic shorts at five different stores are $9, $16, $18, $20, and $22. The mean price is $17 and the median price is $18. Identify the outlier and describe how the mean and median are affected by it.
Answer: The outlier is $9. The outlier decreases both the mean and the median.
Explanation: The mean without outlier is \(\frac{$16+$18+$20+$22}{4}
= \frac{$76}{4}\)
= $19.5.
The median without outlier is $16,$18,$20,$22
= \(\frac{$18+$20}{2}
= \frac{$38}{2}\)
= $19.
The outlier decreases both the mean and the median.
Effects of Outliers – Page No. 691
Question 1.
Identify the outlier in the data set of students in each class. Then describe the effect the outlier has on the mean and median.

Answer: The outlier is 12. The outlier decreases both mean and median.
Explanation:
The mean with outlier is \(\frac{30+22+26+21+24+28+23+26+28+12}{10}
= \frac{240}{10}\)
= 24.
The mean without outlier is \(\frac{30+22+26+21+24+28+23+26+28}{9}
= \frac{228}{9}\)
= 25.3.
The outlier decreases mean from 24 to 25.3.
The median with outlier is 12,21,22,23,24,26,26,28,28,30.
= \(\frac{24+26}{2}
= \frac{50}{2}\)
= 25
The median without outlier is 21,22,23,24,26,26,28,28,30.
= 26
The outlier decreases both mean and median.
Question 2.
Identify the outlier in the data set of pledge amounts. Then describe the effect the outlier has on the mean and median.

Answer: The outlier is $100. The outlier increases mean from $22 to $31.75 and no effect on median.
Explanation:
The mean with outlier is \(\frac{$100+$10+$15+$20+$17+$20+$32+$40}{8}
= \frac{$254}{8}\)
= $31.75.
The mean without outlier is \(\frac{$10+$15+$20+$17+$20+$32+$40}{7}
= \frac{$154}{7}\)
= 22.
The outlier increases mean from $22 to $31.75.
The median with outlier is $10,$15,$17,$20,$20,$32,$40,$100.
= \(\frac{$20+$20}{2}
= \frac{$40}{2}\)
= $20
The median without outlier is $10,$15,$17,$20,$20,$32,$40.
= $20.
The outlier has no effect on median.
Problem Solving
Question 3.
Duke’s science quiz scores are 99, 91, 60, 94, and 95. Describe the effect of the outlier on the mean and median.
Answer: The outlier is 60. The outlier decreases the mean from 94.75 to 87.8 and decreases the median from 94.5 to 94.
Explanation:
The mean with outlier is \(\frac{99+91+60+94+95}{5}
= \frac{439}{5}\)
= 87.8.
The mean without outlier is \(\frac{99+91+94+95}{4}
= \frac{379}{4}\)
= 94.75.
The outlier decreases mean from 94.75 to 87.8.
The median with outlier is 60,91,94,95,99.
= 94.
The median without outlier is 91,94,95,99.
= \(\frac{94+95}{2}
= \frac{189}{2}\)
= 94.5
The outlier decreases the median from 94.5 to 94.
Question 4.
The number of people who attended an art conference for five days was 42, 27, 35, 39, and 96. Describe the effect of the outlier on the mean and median.
Answer: The outlier is 96. The outlier increases the mean from 35.75 to 47.8 and increases the median from 37 to 39.
Explanation:
The mean with outlier is \(\frac{42+27+35+39+96}{5}
= \frac{239}{5}\)
=47.8 .
The mean without outlier is \(\frac{42+27+35+39}{4}
= \frac{143}{4}\)
= 35.75.
The outlier increases mean from 35.75 to 47.8.
The median with the outlier is 27,35,39,42,96.
= 39.
The median without outlier is 27,35,39,42.
= \(\frac{35+39}{2}
= \frac{74}{2}\)
= 37.
The outlier increases the median from 37 to 39.
Question 5.
Find or create a set of data that has an outlier. Find the mean and median with and without the outlier. Describe the effect of the outlier on the measures of center.
Answer:
Lesson Check – Page No. 692
Question 1.
What is the outlier for the data set?
19, 19, 27, 21, 77, 18, 23, 29
Answer: The outlier is 77.
Explanation: As 77 is not fit in the data set, so 77 is an outlier.
Question 2.
The number of counties in several states is 64, 15, 42, 55, 41, 60, and 52. How does the outlier change the median?
Answer: The outlier is 15. The outlier decreases the median from 52 to 53.5.
Explanation:
The median with the outlier is 15,41,42,52,55,60,64.
= 52.
The median without outlier is 41,42,52,55,60,64.
= \(\frac{52+55}{2}
= \frac{107}{2}\)
= 53.5
The outlier decreases the median from 52 to 53.5.
Spiral Review
Question 3.
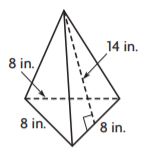
Hector covers each face of the pyramid below with construction paper. The area of the base of the pyramid is 28 square inches. What area will he cover with paper?
_______ in.2
Answer: 196 in.2
Explanation:
Area= 1/2 bh
= 1/2 × 8×14
= 4×14
= 56 in.2
The surface area is 28+3×56
= 28+168
= 196 in.2
Question 4.
Mr. Stevenson measured the heights of several students and recorded his findings in the chart below. How many observations did he complete?

Answer: No.of observations are 14.
Question 5.
Kendra is making a histogram for the data in the chart. She uses the intervals 0–4, 5–9, 10–14, and 15–19. What should be the height of the longest bar in her histogram?

Answer: So the height of the longest bar is 5.
Explanation:
The frequency of intervals from 0-4 is 2.
The frequency of intervals from 5-9 is 5.
The frequency of intervals from 10-14 is 4.
The frequency of intervals from 15-19 is 4.
So the height of the longest bar is 5.
Question 6.
Sharon has 6 photo files on her computer. The numbers below are the sizes of the files in kilobytes. What is the median number of kilobytes for the files?
69.7, 38.5, 106.3, 109.8, 75.6, 89.4
The median is _______ kilobytes.
Answer: 82.5 Kilobytes.
Explanation: The median is 38.5,69.7,75.6,89.4,106.3,109.8
= \(\frac{75.6+89.4}{2}
= \frac{165}{2}\)
= 82.5 Kilobytes.
Share and Show – Page No. 695
Question 1.
The table shows the number of goals scored by the Florida Panthers National Hockey League team in the last 20 games of the 2009 season. What was the most common number of goals the team scored?


Answer: The most common number of goals the team scored is 2.
Explanation: As 2 has appeared 6 times.

Question 2.
Draw a histogram of the hockey data. Use it to find the percent of the games in which the Panthers scored more than 3 goals.
Answer:
Explanation:
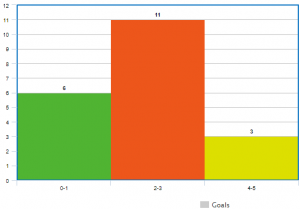
Question 3.
Use Appropriate Tools If you needed to find the mean of a data set, which data display—dot plot or histogram—would you choose? Explain your reasoning.
Answer: To find the mean data set the best tool is a dot plot because in a dot plot we can add all the data values to find the mean but in a histogram does not show individual values.
On Your Own – Page No. 696
Question 4.
Corey collected data on the ages of the parents of his classmates. Make a data display and use it to find the percent of parents at least 30 years old but under 50 years old.
42, 36, 35, 49, 52, 43, 41, 32, 45, 39, 50, 38, 27, 29, 37, 39
Answer: 75% of parents at least 30 years old but under 50 years old.
Explanation: Total parents are 16 and 12 parents who are at least 30 years old but under 50 years. So percent is 12/16= 0.75
= 75% of parents at least 30 years old but under 50 years old.
Question 5.
What is the mode of the data in Exercise 4?
Answer: 39
Explanation: As 39 appears two times, so the mode is 39.
Question 6.
Explain An online retail store sold 500 electronic devices in one week. Half of the devices were laptop computers and 20% were desktop computers. The remaining devices sold were tablets. How many tablets were sold? Explain how you found your answer.
Answer: 150 tablets.
Explanation:
Number of devices sold are
= 100%-50%-20%
= 100%-70%
= 30% of devices
So, number of tablets sold are 30/100 ×500
= 150 tablets.
Question 7.
A recipe for punch calls for apple juice and cranberry juice. The ratio of apple juice to cranberry juice is 3:2. Tyrone wants to make at least 20 cups of punch, but no more than 30 cups of punch. Describe two different ways he can use apple juice and cranberry juice to make the punch.
Answer: Tyrone can use 60:40 and 90:60.
Explanation: For 20 cups Tyrone can use 60:40 and for 30 cups he can use 90:60
Question 8.
The data set shows the total points scored by the middle school basketball team in the last 14 games. What is the most common number of points scored in a game? Explain how to find the answer using a dot plot.

Answer: The most common number of points scored in a game is 39
Explanation:

Problem Solving Data Displays – Page No. 697
Read each problem and solve.
Question 1.
Josie collected data on the number of siblings her classmates have. Make a data display and determine the percent of Josie’s classmates that have more than 2 siblings.
5, 1, 2, 1, 2, 4, 3, 2, 2, 6
_______ %
Answer: 40%.
Explanation: Total number of classmates are 10 members and 4 of them have more than 2 siblings, so the percent of Josie’s classmates is 4÷10= 0.4= 40%.
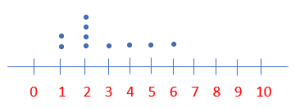
Question 2.
The following data show the number of field goals a kicker attempted each game. Make a data display and tell which number of field goals is the mode.
4, 6, 2, 1, 3, 1, 2, 1, 5, 2, 2, 3
Answer: The mode of data is 2.
Explanation: As 2 is repeated 4 times, so mode is 2.
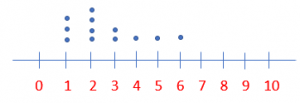
Question 3.
The math exam scores for a class are shown below. Make a data display. What percent of the scores are 90 and greater?
91, 68, 83, 75, 81, 99, 97, 80, 85, 70, 89, 92, 77, 95, 100, 64, 88, 96, 76, 88
Answer: 35% of the scores are 90 and greater.
Explanation: Total data display is 20 scores and 7 of them are greater than 90. So the percent of scores is 7÷20= 0.35
= 35%.
Question 4.
The heights of students in a class are shown below in inches. Make a data display. What percent of the students are taller than 62 inches?
63, 57, 60, 64, 59, 62, 65, 58, 63, 65, 58, 61, 63, 64
Answer: 50% of the students are taller than 62 inches.
Explanation: Total data display is 14 scores and 7 of them are taller than 62 inches. So the percent of scores is 7÷14= 0.5
= 50%.
Question 5.
Write and solve a problem for which you would use a dot plot or histogram to answer questions about given data.
Answer:
Lesson Check – Page No. 698
Question 1.
The number of student absences is shown below. What is the mode of the absences?
2, 1, 3, 2, 1, 1, 3, 2, 2, 10, 4, 5, 1, 5, 1
Answer: 1
Explanation: The mode is the data value with the most dots, so the mode of absence is 1.
Question 2.
Kelly is making a histogram of the number of pets her classmates own. On the histogram, the intervals of the data are 0–1, 2–3, 4–5, 6–7. What is the range of the data?
Answer: 7
Explanation: The range of data is 7.
Spiral Review
Question 3.
The area of the base of the rectangular prism shown below is 45 square millimeters. The height is 5 \(\frac{1}{2}\) millimeters. What is the volume of the prism?
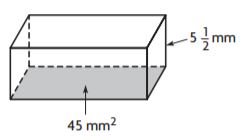
_______ \(\frac{□}{□}\) mm3
Answer: 247 1/2 mm3
Explanation:
As l×w= 45 mm2
Area of the base is l×w
V= l×w×h
= 45×h
= 45 × 5 1/2
= 45 × 11/2
= 495/2
= 247 1/2 mm3
Question 4.
The frequency table shows the number of runs scored by the Cougars in 20 of their baseball games. In what percent of the games did they score 5 or fewer runs?
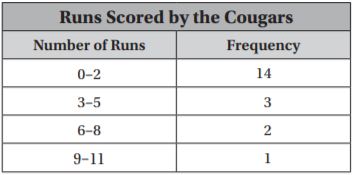
_______ %
Answer: 85%.
Explanation: The Cougars scores 5 or fewer runs in 17 of their 20 games. So the percent of the games did they score 5 or fewer runs is 17/20= 0.85 = 85%.
Question 5.
There are 5 plates of bagels. The numbers of bagels on the plates are 8, 10, 9, 10, and 8. Shane rearranges the bagels so that each plate has the same amount. How many bagels are now on each plate?
Answer: 9
Explanation: There are 9 bagels on each plate.
Question 6.
By how much does the median of the data set 12, 9, 9, 11, 14, 28 change if the outlier is removed?
Answer: The outlier is 28.
Explanation:
The median without outlier is 9,9,11,12,14
= 11
The median with outlier is 9,9,11,12,14,28
= (11+12)/2
= 11.5.
The median was decreased when the outlier is removed.
Chapter 12 Review/Test – Page No. 699
Question 1.
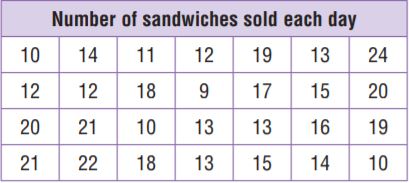
The data set shows the total number of sandwiches sold each day for 28 days. What is the most common number of sandwiches sold in a day?
______ sandwiches
Answer: 13 sandwiches.
Explanation: The most common number of sandwiches sold are 13.
Question 2.
Michael’s teacher asks, “How many items were sold on the first day of the fund raiser?” Explain why this is not a statistical question.
Answer: As there is no variability in the number of items sold on the first day of the fundraiser, so it is not a statistical question.
Question 3.
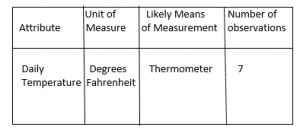
Describe the data set by writing the attribute measured, the unit of measure, the likely means of measurement, and the number of observations in the correct location on the chart.

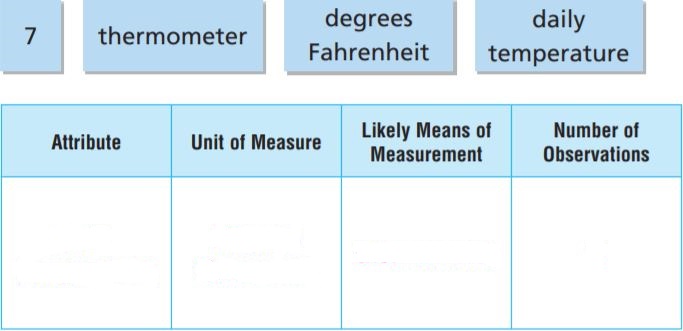
Answer:
Page No. 700
Question 4.
The numbers of points scored by a football team in 7 different games are 26, 38, 33, 20, 27, 3, and 28. For numbers 4a–4c, select True or False to indicate whether the statement is correct.
4a. The outlier in the data set is 3
4b. The difference between the outlier and the median is 24.
4c. The outlier in this set of data affects the mean by increasing it.
4a.
Answer: True.
Explanation: The outlier is 3.
4b.
Answer: True.
Explanation: The median is 3,20,26,27,28,33,38
= 27
and outlier is 3, so difference between median and outlier is 27-3= 24.
4c.
Answer: False
Explanation: The mean with outlier is \(\frac{26+38+33+20+27+3+28}{7}
= \frac{175}{7}\)
= 25
The mean without outlier is \(\frac{26+38+33+20+27+28}{6}
= \frac{172}{6}\)
= 28.6
The mean increases without the outlier.
Question 5.
Mr. Jones gave a quiz to his math class. The students’ scores are listed in the table. Make a dot plot of the data.
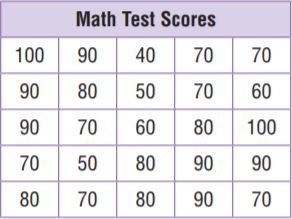
Answer:

Question 6.
Melanie scored 10, 10, 11, and 13 points in her last 4 basketball games.
The mean of the test scores is _____.
The median of the test scores is _____.
The mode of the test scores is _____.
Answer:
The mean of the test scores is 11.
The median of the test scores is 10.5
The mode of the test scores is 10.
Explanation:
The mean of the test scores is \(\frac{10+10+11+13}{4}
= \frac{44}{4}\)
= 11.
The median of the test scores is 10,10,11,13
= \(\frac{10+11}{2}
= \frac{21}{2}\)
= 10.5
The mode of the test scores is 10. As 10 is repeated twice.
Page No. 701
Question 7.
The Martin family goes out for frozen yogurt to celebrate the last day of school. The costs of their frozen yogurts are $1, $1, $2, and $4. Select True or False for each statement.
7a. The mean cost for the frozen yogurts can be found by adding each cost and dividing that total by 4.
7b. The mean cost of the four frozen yogurts is $2.
7c. The difference between the greatest cost and the mean is $1.
7d. The difference between the least cost and the mean is $1.
7a.
Answer: True.
Explanation: To find the mean we will add each cost and divide that total by 4.
7b.
Answer: True.
Explnation: The mean is \(\frac{$1+$1+$2+$4}{4}
= \frac{$8}{4}\)
= $2.
Answer:
7c. False.
Explanation: The difference between the greatest cost and the mean is $4-$2= $2.
Answer:
7d. True.
Explanation: The difference between the least cost and the mean is $2-$1= $1.
Question 8.
The histogram shows the amount of time students spent on homework for the week. For numbers 8a–8d, choose True or False to indicate whether the statement is correct.
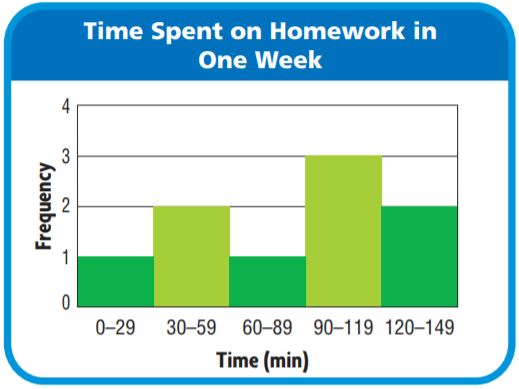
8a. The number of students that spent between 30 minutes and 59 minutes on homework is 2.
8b. The greatest number of students spent between 90 minutes and 119 minutes on homework.
8c. Five of the students spent less than 60 minutes on homework for the week.
8d. Six of the students spent 60 minutes or more on homework for the week.
8a.
Answer: True.
8b.
Answer: True.
8c.
Answer: False
Explanation: Three of the students spent less than 60 minutes.
8d.
Answer: True.
Page No. 702
Question 9.
The dot plot shows how many games of chess 8 different members of the chess club played in one month. If Jackson is a new member of the chess club, how many games of chess is he likely to play in one month? Explain how the dot plot helped you find the answer.
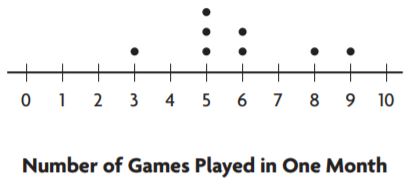
Answer: Jackson played 5 games of chess in one month.
Explanation: As the tallest stack in this dot plot is 5 games.
Question 10.
Larry is training for a bicycle race. He records how far he rides each day. Find the mode of the data.

Answer: 15
Explanation: As 15 repeated 3 times, so mode of the data is 15.
Question 11.
The amounts of money Connor earned each week from mowing lawns for 5 weeks are $12, $61, $71, $52, and $64. The mean amount earned is $52 and the median amount earned is $61. Identify the outlier and describe how the mean and median are affected by it.
Answer: The outliernis $12. The outlier decreases both mean and median.
Explanation: The mean without outlier is \(\frac{$61+$71+$52+$64}{4}
= \frac{248}{4}\)
= 62.
The median without outlier is $52,$61,$64,$71.
= \(\frac{$61+$64}{2}
= \frac{125}{2}\)
= 62.5
The outlier decreases both mean and median.
Question 12.
The frequency table shows the height, in inches, of 12 basketball players. What fraction of the players are 70 inches or taller?
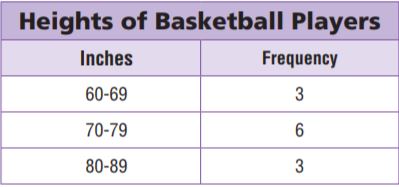
\(\frac{□}{□}\)
Answer: \(\frac{3}{4}\).
Explanation: The total number of players who are 70 inches or taller are 6+3= 9, so fraction is \(\frac{9}{12}\)
= \(\frac{3}{4}\).
Page No. 703
Question 13.
A teacher surveys her students to find out how much time the students spent eating lunch on Monday.
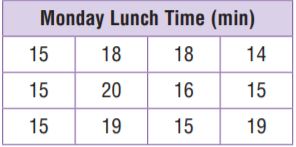
She uses _____ as the unit of measure.
She uses ______ as the unit of measure.
Answer: She uses minutes as the unit of measure.
Question 14.
For numbers 14a–14d, choose Yes or No to indicate whether the question is a statistical question.
14a. What are the heights of the trees in the park?
14b. How old are the trees in the park?
14c. How tall is the cypress tree on the north side of the lake this morning?
14d. What are the diameters of the trees in the park?
14a.
Answer: Yes.
14b.
Answer: Yes.
14c.
Answer: No.
14d. Yes.
Question 15.
Five friends have 8, 6, 5, 2, and 4 baseball cards to divide equally among themselves.
Each friend will get _____ cards.
Each friend will get ______ cards.
Answer: 5 cards.
Explanation: Each friend will get \(\frac{8+6+5+2+4}{5}
= \frac{25}{5}\)
= 5
Question 16.
The data set shows the ages of the members of the cheerleading squad. What is the most common age of the members of the squad? Explain how to find the answer using a dot plot.
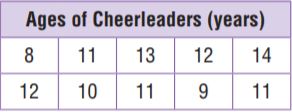
Answer: 11 is the most common age of the members of the squad.
Explanation:
Page No. 704
Question 17.
The band director kept a record of the number of concert tickets sold by 20 band members. Complete the frequency table by finding the frequency and the relative frequency.
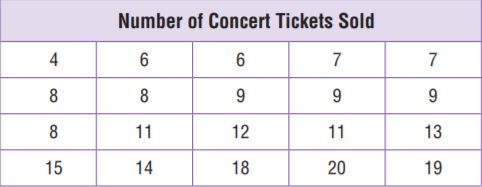
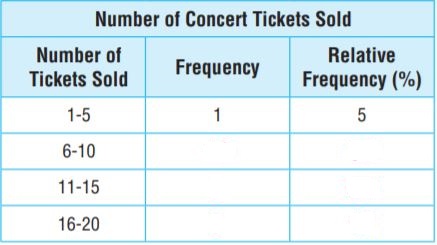
Answer:
Explanation:
Question 18.
Gilbert is training for a marathon by running each week. The table shows the distances, in miles, that he ran each week during the first 7 weeks.

Part A
Gilbert set a goal that the mean number of miles he runs in 7 weeks is at least 14 miles. Did Gilbert reach his goal? Use words and numbers to support your answer.
Answer: No, Gilbert did not reach his goal as 13 is less than 14.
Explanation: The mean number of miles he runs in 7 weeks \(\frac{8+10+9+10+15+18+21}{7}
= \frac{91}{7}\)
= 13
Question 18.
Part B
Suppose Gilbert had run 18 miles during week 5 and 22 miles during week 6. Would he have reached his goal? Use words and numbers to support your answer
Answer: As the mean is 14, Gilbert reached his goal.
Explanation: The mean is \(\frac{8+10+9+10+22+18+21}{7}
= \frac{98}{7}\)
= 14.
Final Words
Tap the above links and start your preparation from now itself. You can understand the concepts of Data Displays and Measures of Center in-depth here. Bookmark our ccssmathanswers.com to get the answers with explanations for all grade 6 chapters.
