Eureka Math Grade 7 Module 1 Lesson 19 Answer Key

Engage NY Eureka Math 7th Grade Module 1 Lesson 19 Answer Key

Eureka Math Grade 7 Module 1 Lesson 19 Example Answer Key

Exploring Area Relationships

Use the diagrams below to find the scale factor and then find the area of each figure.
Example 1
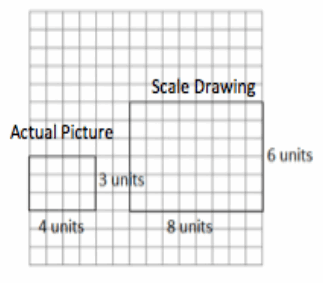
Engage NY Math 7th Grade Module 1 Lesson 19 Example Answer Key 1
Scale factor: _________
Actual Area = ______________
Scale Drawing Area = ________________
Value of the Ratio of the Scale Drawing Area to the Actual Area: _________
Answer:
Scale factor: 2
Actual Area = 12 square units
Scale Drawing Area = 48 square units
Value of the Ratio of the Scale Drawing Area to the Actual Area:
\(\frac{48}{12}\) = 4

Example 2.
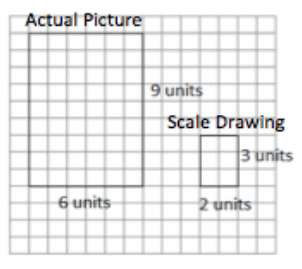
Engage NY Math 7th Grade Module 1 Lesson 19 Example Answer Key 2
Scale factor: _________
Actual Area = ______________
Scale Drawing Area = ________________
Value of the Ratio of the Scale Drawing Area to the Actual Area: _________
Answer:
Scale factor: \(\frac{1}{3}\)
Actual Area = 54 square units
Scale Drawing Area = 6 square units
Value of the Ratio of Scale Drawing Area to Actual Area:
\(\frac{6}{54}\) = \(\frac{1}{9}\)

Example 3.
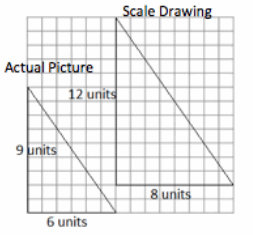
Engage NY Math 7th Grade Module 1 Lesson 19 Example Answer Key 500
Scale factor: \(\frac{4}{3}\)
Actual Area = 27 square units
Scale Drawing Area = 48 square units
Value of the Ratio of Scale Drawing Area to Actual Area:
\(\frac{48}{27}\) = \(\frac{16}{9}\)

Guide students through completing the results statements on the student materials.

Results:
What do you notice about the ratio of the areas in Examples 1–3? Complete the statements below.
When the scale factor of the sides was 2, then the value of the ratio of the areas was __ .
Answer:
4
When the scale factor of the sides was \(\frac{1}{3}\), then the value of the ratio of the areas was __.
Answer:
\(\frac{1}{9}\)

When the scale factor of the sides was \(\frac{4}{3}\), then the value of the ratio of the areas was ___.
Answer:
\(\frac{16}{9}\)

Based on these observations, what conclusion can you draw about scale factor and area?
Answer:
The ratio of the areas is the scale factor multiplied by itself or squared.

If the scale factor is r, then the ratio of the areas is ___.
Answer:
r2 to 1.

→ Why do you think this is? Why do you think it is squared (opposed to cubed or something else)?
→ When you are comparing areas, you are dealing with two dimensions instead of comparing one linear measurement to another.
→ How might you use this information in working with scale drawings?
→ In working with scale drawings, you could take the scale factor, r, and calculate r2 to determine the relationship between the area of the scale drawing and the area of the actual picture. Given a blueprint for a room, the scale drawing dimensions could be used to find the scale drawing area and could then be applied to determine the actual area. The actual dimensions would not be needed.
→ Suppose a rectangle has an area of 12 square meters. If the rectangle is enlarged by a scale factor of three, what is the area of the enlarged rectangle based on Examples 1–3? Look and think carefully!
→ If the scale factor is 3, then the ratio of scale drawing area to actual area is 32 to 12, or 9 to 1. So, if its area is 12 square meters before it is enlarged to scale, then the enlarged rectangle will have an area of 12∙(\(\frac{9}{1}\)), or 12∙9, resulting in an area of 108 square meters.

Example 4:
They Said Yes!
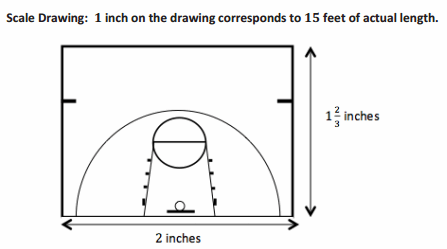
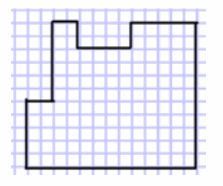
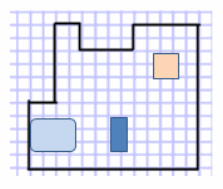
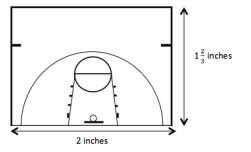
The Student Government liked your half-court basketball plan. They have asked you to calculate the actual area of the court so that they can estimate the cost of the project.
Based on your drawing below, what will the area of the planned half-court be?
Scale Drawing: 1 inch on the drawing corresponds to 15 feet of actual length
Engage NY Math 7th Grade Module 1 Lesson 19 Example Answer Key 5
Does the actual area you found reflect the results we found from Examples 1–3? Explain how you know.
Answer:
Method 1: Use the measurements we found in yesterday’s lesson to calculate the area of the half-court.
Actual area = 25 feet × 30 feet =750 square feet
Method 2: Apply the newly discovered Ratio of Area relationship.

Note to teachers: This can be applied to the given scale with no unit conversions (shown on left) or to the scale factor (shown on right). Both options are included here as possible student work and would provide for a rich discussion of why they both work and what method is preferred. See guiding questions below.
Answer:
Using Scale:
The Value of the Ratio of Areas: (\(\frac{15}{1}\))2 = 225
Scale Drawing Area = 2 in.× 1\(\frac{2}{3}\) in.
= \(\frac{10}{3}\) square inches
Let x = scale drawing area, and let y = actual area.
y = kx
y = 225(\(\frac{10}{3}\))
y = \(\frac{225}{1}\).\(\frac{10}{3}\)
y = 750
The actual area using the given scale is 750 square feet.

Using Scale Factor:
The Value of the Ratio of Areas (\(\frac{180}{1}\))2 = 32400
Scale Drawing Area = 2 in.×1\(\frac{2}{3}\) in.
= \(\frac{10}{3}\) square inches
Let x = scale drawing area, and let y = actual area.
y = kx
y = 32400(\(\frac{10}{3}\))
y = \(\frac{324000}{3}\)
y = 108000
The actual area is 108,000 square inches, or
108000 square inches × \(\frac{1 square feet}{144 square feet}\) = 750 square feet.
Ask students to share how they found their answer. Use guiding questions to find all three options as noted above.
→ What method do you prefer?
→ Is there a time you would choose one method over the other?
→ If we do not already know the actual dimensions, it might be faster to use Method 1 (ratio of areas). If we are re-carpeting a room based upon a scale drawing, we could just take the dimensions from the scale drawing, calculate area, and then apply the ratio of areas to find the actual amount of carpet we need to buy.
Guide students to complete the follow-up question in their student materials.

Does the actual area you found reflect the results we found from Examples 1–3? Explain how you know.
Answer:
Yes, the scale of 1 inch to 15 feet has a scale factor of 180, so the ratio of area should be (180)2, or 32,400.
The drawing area is (2)(1\(\frac{2}{3}\)), or \(\frac{10}{3}\) square inches.
The actual area is 25 feet by 30 feet, or 750 square feet, or 108,000 square inches.
The value of the ratio of the areas is \(\frac{108,000}{\frac{10}{3}}\), or \(\frac{324,000}{10}\), or 32,400

It would be more efficient to apply this understanding to the scale, eliminating the need to convert units.
If we use the scale of \(\frac{15}{1}\), then the ratio of area is \(\frac{225}{1}\).
The drawing area is (2)(1\(\frac{2}{3}\)), or \(\frac{10}{3}\) square inches.
The actual area is 25 feet by 30 feet, or 750 square feet.
The ratio of area is \(\frac{750}{\frac{10}{3}}\), \(\frac{2250}{10}\), or \(\frac{225}{1}\).

Eureka Math Grade 7 Module 1 Lesson 19 Exercise Answer Key

Allow time for students to answer independently and then share results.

Question 1.
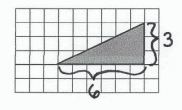
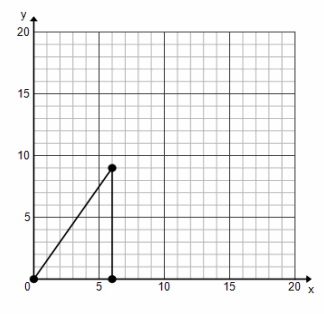
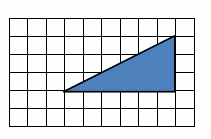
The triangle depicted by the drawing has an actual area of 36 square units. What is the scale of the drawing? (Note: Each square on the grid has a length of 1 unit.)
Eureka Math Grade 7 Module 1 Lesson 19 Exercise Answer Key 8
Answer:
Eureka Math Grade 7 Module 1 Lesson 19 Exercise Answer Key 9
Scale Drawing Area: \(\frac{1}{2}\) ∙ 6∙ 3 = 9 square units. Ratio of Scale Drawing Area to Actual Area: \(\frac{9}{36}\) = r2
Therefore, r (scale factor) = \(\frac{3}{6}\) since \(\frac{3}{6}\) ∙ \(\frac{3}{6}\) = \(\frac{9}{36}\). The scale factor is \(\frac{1}{2}\) . The scale is 1 unit of drawing length represents 2 units of actual length.

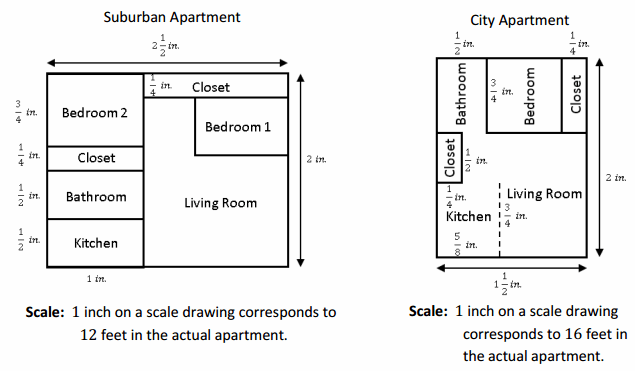
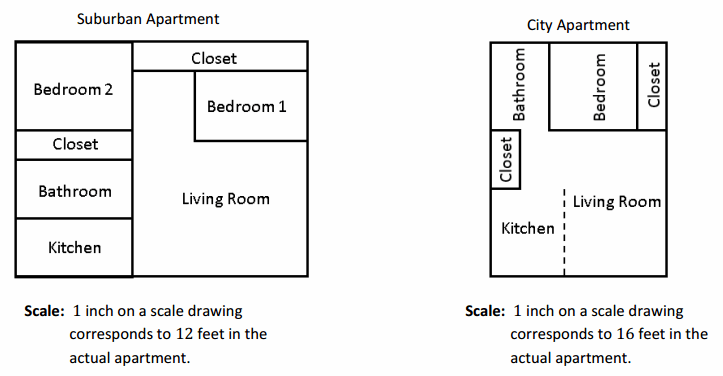
For Exercise 2, allow students time to measure the drawings of the apartments using a ruler and then compare measurements with a partner. Students then continue to complete parts (a)–(f) with a partner. Allow students time to share responses. Sample answers to questions are given below.

Question 2.
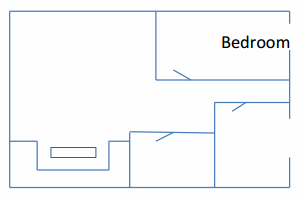
Use the scale drawings of two different apartments to answer the questions. Use a ruler to measure.
Eureka Math Grade 7 Module 1 Lesson 19 Exercise Answer Key 10
Answer:
Eureka Math Grade 7 Module 1 Lesson 19 Exercise Answer Key 11
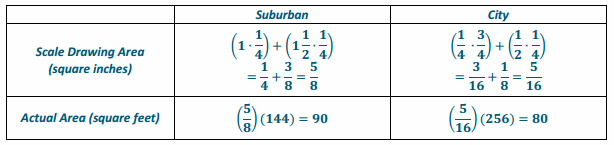
a. Find the scale drawing area for both apartments, and then use it to find the actual area of both apartments.
Answer:

Eureka Math Grade 7 Module 1 Lesson 19 Exercise Answer Key 11.1

b. Which apartment has closets with more square footage? Justify your thinking.
Answer:
Eureka Math Grade 7 Module 1 Lesson 19 Exercise Answer Key 12
The suburban apartment has greater square footage in the closet floors.

c. Which apartment has the largest bathroom? Justify your thinking.
Answer:

Eureka Math Grade 7 Module 1 Lesson 19 Exercise Answer Key 13
The city apartment has the largest bathroom.

d. A one-year lease for the suburban apartment costs $750 per month. A one-year lease for the city apartment costs $925. Which apartment offers the greater value in terms of the cost per square foot?
Answer:
The suburban cost per square foot is \(\frac{750}{720}\), or approximately $1.04 per square foot. The city cost per square foot is \(\frac{925}{768}\), or approximately $1.20 per square foot. The suburban apartment offers a greater value (cheaper cost per square foot), $1.04 versus $1.20.

Eureka Math Grade 7 Module 1 Lesson 19 Exit Ticket Answer Key

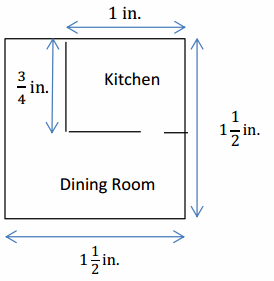
A 1-inch length in the scale drawing below corresponds to a length of 12 feet in the actual room.
Eureka Math Grade 7 Module 1 Lesson 19 Exit Ticket Answer Key 14

Question 1.
Describe how the scale or the scale factor can be used to determine the area of the actual dining room.
Answer:
The scale drawing will need to be enlarged to get the area or dimensions of the actual dining room. Calculate the area of the scale drawing, and then multiply by the square of the scale (or scale factor) to determine the actual area.

Question 2.
Find the actual area of the dining room.
Answer:
Scale drawing area of dining room: (1\(\frac{1}{2}\) in.×\(\frac{3}{4}\) in.) + (\(\frac{3}{4}\) in. × \(\frac{1}{2}\)in.) = \(\frac{12}{8}\) in2 or 1\(\frac{1}{2}\) in2
Actual area of the dining room: \(\frac{12}{8}\) ft.× 144 ft. = 216 ft2
Or similar work completing conversions and using scale factor

Question 3.
Can a rectangular table that is 7 ft. long and 4 ft. wide fit into the narrower section of the dining room? Explain your answer.
Answer:
The narrower section of the dining room measures \(\frac{3}{4}\) by \(\frac{1}{2}\) in the drawing, or 9 feet by 6 feet in the actual room. Yes, the table will fit; however, it will only allow for 1 additional foot around all sides of the table for movement or chairs.
Eureka Math Grade 7 Module 1 Lesson 19 Exit Ticket Answer Key 14

Eureka Math Grade 7 Module 1 Lesson 22 Answer Key

Engage NY Eureka Math 7th Grade Module 1 Lesson 22 Answer Key

Eureka Math Grade 7 Module 1 Lesson 22 Exploratory Challenge Answer Key

Using the new scale drawing of your dream room, list the similarities and differences between this drawing and the original drawing completed for Lesson 20.
Similarities
Differences
Answer:
Similarities
– Same room shape
– Placement of furniture
– Space between furniture
– Drawing of the original room
– Proportional

Differences
– One is bigger than the other
– Different scale factors

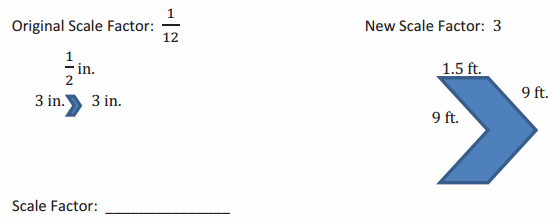
Original Scale Factor: ___
Answer:
\(\frac{1}{20}\)
New scale Factor: ___
Answer:
\(\frac{1}{30}\)

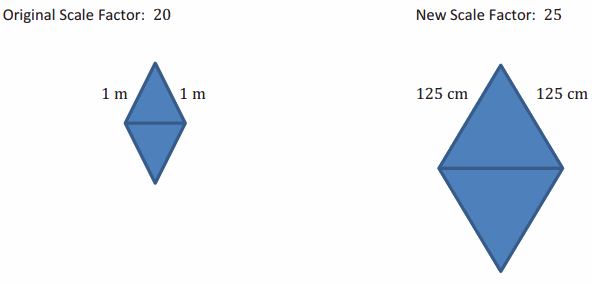
What is the relationship between these scale factors?
Answer:
\(\frac{1}{4}\)
Key Idea:
Two different scale drawings of the same top-view of a room are also scale drawings of each other. In other words, a scale drawing of a different scale can also be considered a scale drawing of the original scale drawing.

Eureka Math Grade 7 Module 1 Lesson 22 Example Answer Key

Example 1:
Building a Bench
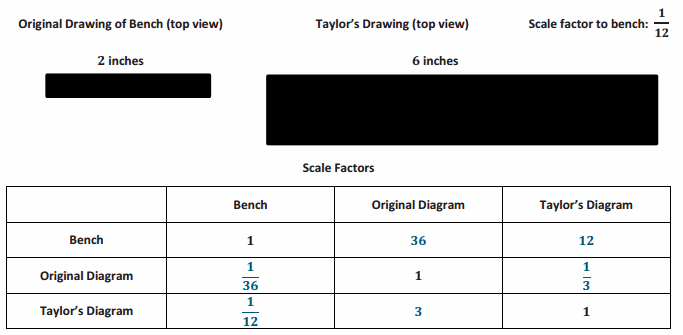
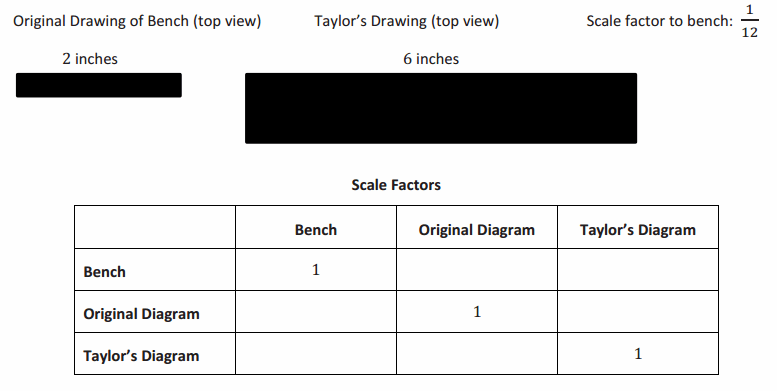
To surprise her mother, Taylor helped her father build a bench for the front porch. Taylor’s father had the instructions with drawings, but Taylor wanted to have her own copy. She enlarged her copy to make it easier to read. Using the following diagram, fill in the missing information. To complete the first row of the table, write the scale factor of the bench to the bench, the bench to the original diagram, and the bench to Taylor’s diagram. Complete the remaining rows similarly.

The pictures below show the diagram of the bench shown on the original instructions and the diagram of the bench shown on Taylor’s enlarged copy of the instruction.
Engage NY Math 7th Grade Module 1 Lesson 22 Example Answer Key 1
Answer:
Engage NY Math 7th Grade Module 1 Lesson 22 Example Answer Key 2

Eureka Math Grade 7 Module 1 Lesson 22 Exercise Answer Key

Exercise 1.
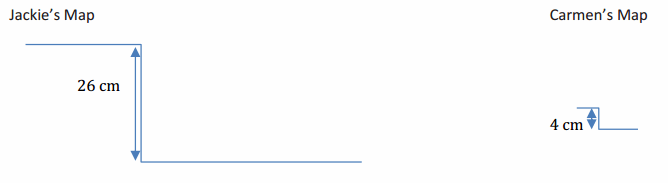
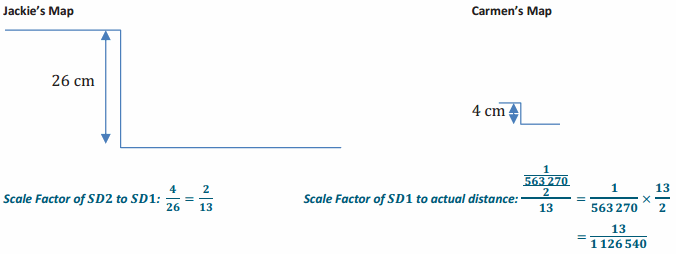
Carmen and Jackie were driving separately to a concert. Jackie printed a map of the directions on a piece of paper before the drive, and Carmen took a picture of Jackie’s map on her phone. Carmen’s map had a scale factor of \(\frac{1}{563,270}\). Using the pictures, what is the scale of Carmen’s map to Jackie’s map? What was the scale factor of Jackie’s printed map to the actual distance?
Eureka Math Grade 7 Module 1 Lesson 22 Exercise Answer Key 3
Answer:
Eureka Math Grade 7 Module 1 Lesson 22 Exercise Answer Key 4

Exercise 2.
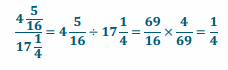
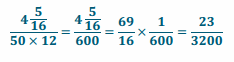
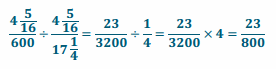
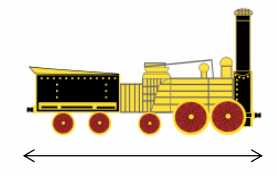
Ronald received a special toy train set for his birthday. In the picture of the train on the package, the boxcar has the following dimensions: length is 4\(\frac{5}{16}\) inches; width is 1\(\frac{1}{8}\) inches; height is 1\(\frac{5}{8}\) inches. The toy boxcar that Ronald received has dimensions l is 17.25 inches; w is 4.5 inches; h is 6.5 inches. If the actual boxcar is 50 feet long:
a. Find the scale factor of the picture on the package to the toy set.
Answer:
Eureka Math Grade 7 Module 1 Lesson 22 Exercise Answer Key 5

b. Find the scale factor of the picture on the package to the actual boxcar.
Answer:
Eureka Math Grade 7 Module 1 Lesson 22 Exercise Answer Key 6

c. Use these two scale factors to find the scale factor between the toy set and the actual boxcar.
Answer:
Eureka Math Grade 7 Module 1 Lesson 22 Exercise Answer Key 7

d. What is the width and height of the actual boxcar?
Answer:
Eureka Math Grade 7 Module 1 Lesson 22 Exercise Answer Key 8

Eureka Math Grade 7 Module 1 Lesson 22 Problem Set Answer Key

Question 1.
For the scale drawing, the actual lengths are labeled onto the scale drawing. Measure the lengths, in centimeters, of the scale drawing with a ruler, and draw a new scale drawing with a scale factor (SD2 to SD1) of \(\frac{1}{2}\).
Eureka Math Grade 7 Module 1 Lesson 22 Problem Set Answer Key 9
Answer:
Eureka Math Grade 7 Module 1 Lesson 22 Problem Set Answer Key 10

Question 2.
Compute the scale factor of the new scale drawing (SD2) to the first scale drawing (SD1) using the information from the given scale drawings.
a. Eureka Math Grade 7 Module 1 Lesson 22 Problem Set Answer Key 11
Answer:
\(\frac{1}{48}\)

b. Eureka Math Grade 7 Module 1 Lesson 22 Problem Set Answer Key 12
Answer:
36

c. Eureka Math Grade 7 Module 1 Lesson 22 Problem Set Answer Key 13
Answer:
\(\frac{5}{4}\)

Eureka Math Grade 7 Module 1 Lesson 22 Exit Ticket Answer Key

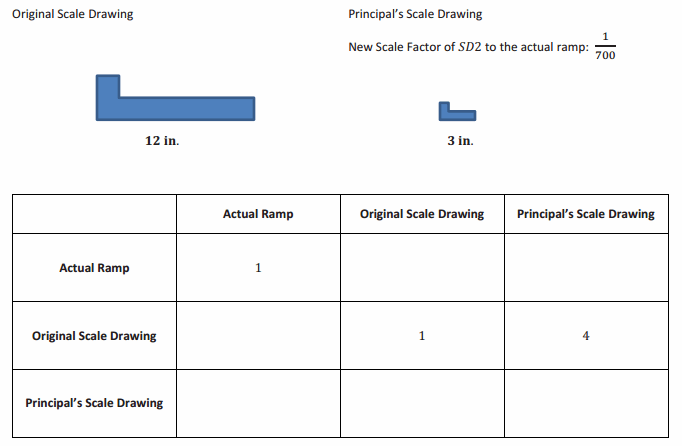
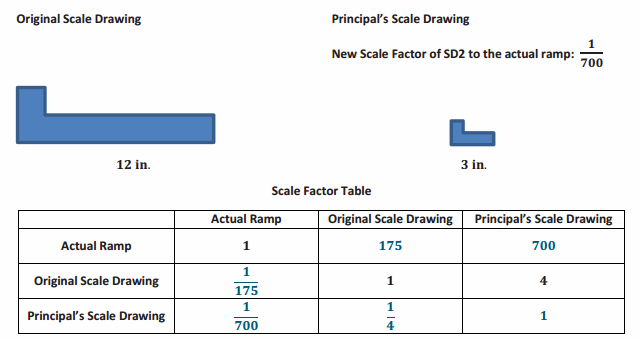
The school is building a new wheelchair ramp for one of the remodeled bathrooms. The original drawing was created by the contractor, but the principal drew another scale drawing to see the size of the ramp relative to the walkways surrounding it. Find the missing values on the table.
Eureka Math Grade 7 Module 1 Lesson 22 Exit Ticket Answer Key 99
Answer:
Eureka Math Grade 7 Module 1 Lesson 22 Exit Ticket Answer Key 100

Eureka Math Grade 7 Module 1 Lesson 18 Answer Key

Engage NY Eureka Math 7th Grade Module 1 Lesson 18 Answer Key

Eureka Math Grade 7 Module 1 Lesson 18 Example Answer Key

Example 1.
Basketball at Recess?
Vincent proposes an idea to the Student Government to install a basketball hoop along with a court marked with all the shooting lines and boundary lines at his school for students to use at recess. He presents a plan to install a half-court design as shown below. After checking with the school administration, he is told it will be approved if it fits on the empty lot that measures 25 feet by 75 feet on the school property. Will the lot be big enough for the court he planned? Explain.
Engage NY Math 7th Grade Module 1 Lesson 18 Example Answer Key 1
Answer:
Engage NY Math 7th Grade Module 1 Lesson 18 Example Answer Key 2
Scale Factor: 1 inch corresponds to (15∙12) inches, or 180 inches, so the scale factor is 180. Let k = 180, x represent the scale drawing lengths in inches, and y represent the actual court lengths in inches. The y-values must be converted from feet to inches.
To find actual length: y = 180x
y = 180(2)
y = 360 inches, or 30 feet
To find actual width: y = 180x
y = 180(1 \(\frac{2}{3}\))
y = \(\frac{180}{1}\)∙\(\frac{5}{3}\)
y = 300 inches, or 25 feet
The actual court measures 25 feet by 30 feet. Yes, the lot is big enough for the court Vincent planned. The court will take up the entire width of the lot.

Example 2
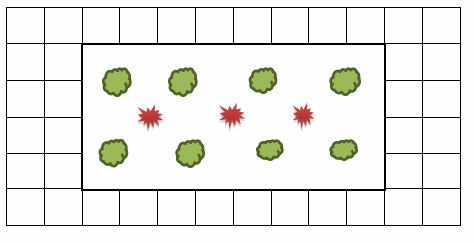
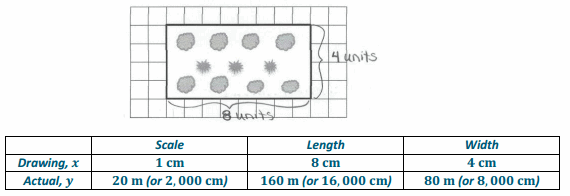
The diagram shown represents a garden. The scale is 1 centimeter for every 20 meters. Each square in the drawing measures 1 cm by 1 cm. Find the actual length and width of the garden based upon the given drawing.
Engage NY Math 7th Grade Module 1 Lesson 18 Example Answer Key 3
Answer:
Engage NY Math 7th Grade Module 1 Lesson 18 Example Answer Key 4
Method 1:
Using the given scale: 1 cm of scale drawing length corresponds to 20 m of actual length.
k = 0 Drawing length to actual length
To find the actual length: y = 20x Where x represents the the scale drawing measurements in centimeters, and y represents the actual measurement in meters.
y = 20(8) Substitute the scale drawing length in place of x.
y = 160
The actual length is 80 m.
To find actual width: Divide the actual length by 2 since its drawing width is half the length.
The actual width is 80 m.

Method 2:
Use the scale factor: 1 cm of scale drawing length corresponds to 2000 cm of actual length.
k = 2000 Drawing length to actual length (in same units)
To find actual length: y = 2000x Where x represents the drawing measurement in centimeters, and
y represents the actual measurement in centimeters.
y = 2000(8) Substitute the scale drawing length in place of x.
y = 16000
The actual length is 16,000 cm, or 160 m.

To find actual width: y = 2000x
y = 2000(4) Substitute the scale drawing width in place of x.
y = 8000

Example 3
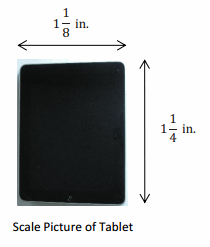
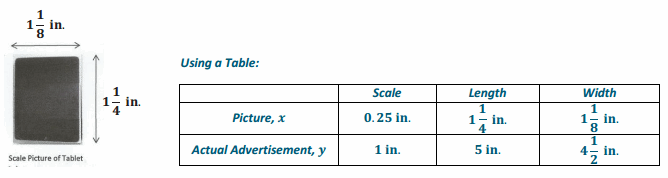
A graphic designer is creating an advertisement for a tablet. She needs to enlarge the picture given here so that 0.25 inches on the scale picture corresponds to 1 inch on the actual advertisement. What will be the length and width of the tablet on the advertisement?
Engage NY Math 7th Grade Module 1 Lesson 18 Example Answer Key 50
Answer:
Engage NY Math 7th Grade Module 1 Lesson 18 Example Answer Key 51
Using an Equation:
Find the constant of proportionality, k: k = 4
k = 4 (Scale factor since units of measure are the same; it is an enlargement.)
To find Actual Length: y = 4x Where x represents the picture measurement, and y represents the
actual advertisement measurement.
y = 4(1 \(\frac{1}{4}\)) Substitute the picture length in place of x.
y = 5
To find Actual Width: y = 4x
y = 4(1\(\frac{1}{8}\)) Substitute the picture width in place of y.
y = 4\(\frac{1}{2}\)
The tablet will be 5 inches by 4\(\frac{1}{2}\) inches on the actual advertisement.

Eureka Math Grade 7 Module 1 Lesson 18 Exercise Answer Key

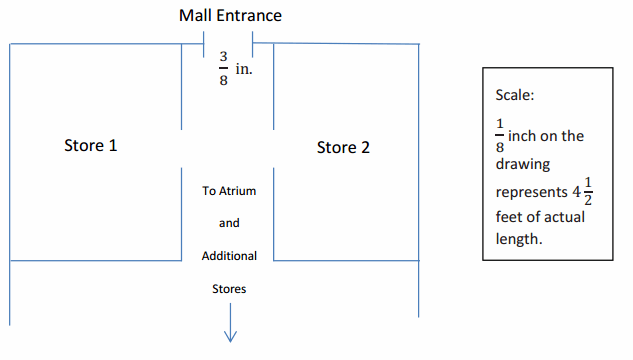
Students from the high school are going to perform one of the acts from their upcoming musical at the atrium in the mall. The students want to bring some of the set with them so that the audience can get a better feel for the whole production. The backdrop that they want to bring has panels that measure 10 feet by 10 feet. The students are not sure if they will be able to fit these panels through the entrance of the mall since the panels need to be transported flat (horizontal). They obtain a copy of the mall floor plan, shown below, from the city planning office. Use this diagram to decide if the panels will fit through the entrance. Use a ruler to measure.
Eureka Math Grade 7 Module 1 Lesson 18 Exercise Answer Key 52
Answer the following questions.

a. Find the actual distance of the mall entrance, and determine whether the set panels will fit.
Answer:
Step 1: Relationship between lengths in drawing and lengths in actual
Scale: Eureka Math Grade 7 Module 1 Lesson 18 Exercise Answer Key 83  or the value of the ratio \(\frac{36}{1}\) feet to inches
Scale factor calculations: Eureka Math Grade 7 Module 1 Lesson 18 Exercise Answer Key 53 inches to inches

Eureka Math Grade 7 Module 1 Lesson 18 Exercise Answer Key 90
= 432, an enlargement
Step 2: Find the actual distance of the entrance.
Using the given scale: \(\frac{3}{8}\)∙\(\frac{36}{1}\) = 13\(\frac{1}{2}\)
The actual distance of the entrance is 13 \(\frac{1}{2}\) feet wide.
OR
Using the scale factor: \(\frac{3}{8}\)∙\(\frac{432}{1}\) = 162
The actual distance of the entrance is 162 inches, or 13\(\frac{1}{2}\) feet, wide.
Yes, the set panels, which are 10 ft. ×10 ft. , will fit (lying flat) through the mall entrance.

b. What is the scale factor? What does it tell us?
Answer:
The scale factor is 432. Each length on the scale drawing is \(\frac{1}{432}\) of the actual length. The actual lengths are 432 times larger than the lengths in the scale drawing.

Eureka Math Grade 7 Module 1 Lesson 18 Problem Set Answer Key

Question 1.
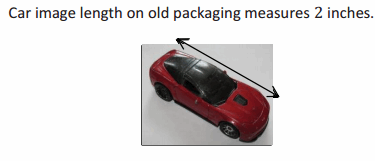
A toy company is redesigning its packaging for model cars. The graphic design team needs to take the old image shown below and resize it so that \(\frac{1}{2}\) inch on the old packaging represents \(\frac{1}{3}\) inch on the new package. Find the length of the image on the new package.
Engage NY Math Grade 7 Module 1 Lesson 18 Problem Set Answer Key 65
Answer:
\(\frac{4}{3}\) inches; the scale \(\frac{1}{2}\) to \(\frac{1}{3}\) and the length of the original figure is 2, which is 4 halves, so in the scale drawing the length will be 4 thirds.

Question 2.
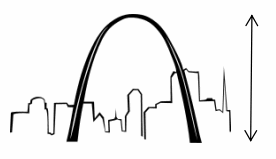
The city of St. Louis is creating a welcome sign on a billboard for visitors to see as they enter the city. The following picture needs to be enlarged so that \(\frac{1}{2}\) inch represents 7 feet on the actual billboard. Will it fit on a billboard that measures 14 feet in height?
Engage NY Math Grade 7 Module 1 Lesson 18 Problem Set Answer Key 66
Answer:
Yes, the drawing measures 1 inch in height, which corresponds to 14 feet on the actual billboard.

Question 3.
Your mom is repainting your younger brother’s room. She is going to project the image shown below onto his wall so that she can paint an enlarged version as a mural. Use a ruler to determine the length of the image of the train. Then determine how long the mural will be if the projector uses a scale where 1 inch of the image represents 2 \(\frac{1}{2}\) feet on the wall.
Engage NY Math Grade 7 Module 1 Lesson 18 Problem Set Answer Key 67
Answer:
The scale drawing measures 2 inches, so the image will measure 2 × 2.5, or 5 feet long, on the wall.

Question 4.
A model of a skyscraper is made so that 1 inch represents 75 feet. What is the height of the actual building if the height of the model is 18 \(\frac{3}{5}\) inches?
Answer:
1,395 feet

Question 5.
The portrait company that takes little league baseball team photos is offering an option where a portrait of your baseball pose can be enlarged to be used as a wall decal (sticker). Your height in the portrait measures 3 \(\frac{1}{2}\) inches. If the company uses a scale where 1 inch on the portrait represents 20 inches on the wall decal, find the height on the wall decal. Your actual height is 55 inches. If you stand next to the wall decal, will it be larger or smaller than you?
Answer:
Your height on the wall decal is 70 inches. The wall decal will be larger than your actual height (when you stand next to it).

Question 6.
The sponsor of a 5K run/walk for charity wishes to create a stamp of its billboard to commemorate the event. If the sponsor uses a scale where 1 inch represents 4 feet, and the billboard is a rectangle with a width of 14 feet and a length of 48 feet, what will be the shape and size of the stamp?
Answer:
The stamp will be a rectangle measuring 3 \(\frac{1}{2}\) inches by 12 inches.
Question 7.
Danielle is creating a scale drawing of her room. The rectangular room measures 20 \(\frac{1}{2}\) ft. by 25 ft. If her drawing uses the scale where 1 inch represents 2 feet of the actual room, will her drawing fit on an 8 \(\frac{1}{2}\) in. by 11 in. piece of paper?
Answer:
No, the drawing would be 10\(\frac{1}{4}\) inches by 12 \(\frac{1}{2}\) inches, which is larger than the piece of paper.
Question 8.
A model of an apartment is shown below where \(\frac{1}{4}\) inch represents 4 feet in the actual apartment. Use a ruler to measure the drawing and find the actual length and width of the bedroom.
Engage NY Math Grade 7 Module 1 Lesson 18 Problem Set Answer Key 80
Answer:
Ruler measurements: 1\(\frac{1}{8}\) inches by \(\frac{9}{16}\) inches.
The actual length would be 18 feet, and the actual width would be 9 feet.

Eureka Math Grade 7 Module 1 Lesson 18 Exit Ticket Answer Key

A drawing of a surfboard in a catalog shows its length as 8\(\frac{4}{9}\) inches. Find the actual length of the surfboard if \(\frac{1}{2}\) inch length on the drawing corresponds to \(\frac{3}{8}\) foot of actual length.
Answer:
Engage NY Math 7th Grade Module 1 Lesson 18 Exit Ticket Answer Key 60
y = kx
y = \(\frac{3}{4}\) x
=8 \(\frac{4}{9}\) ∙\(\frac{3}{4}\)
= \(\frac{76}{9}\) ∙\(\frac{3}{4}\)
= \(\frac{19}{3}\) ∙\(\frac{1}{1}\)
The actual surfboard measures 6 \(\frac{1}{3}\) feet long.

Note: Students could also use an equation where y represents the scale drawing, and x represents the actual measurement, in which case, k would equal \(\frac{4}{3}\) .

Eureka Math Grade 7 Module 1 Lesson 16 Answer Key

Engage NY Eureka Math 7th Grade Module 1 Lesson 16 Answer Key

Eureka Math Grade 7 Module 1 Lesson 16 Opening Exercise Answer Key

Opening Exercise: Can You Guess the Image?

Question 1.
Eureka Math Grade 7 Module 1 Lesson 16 Opening Exercise Answer Key 1
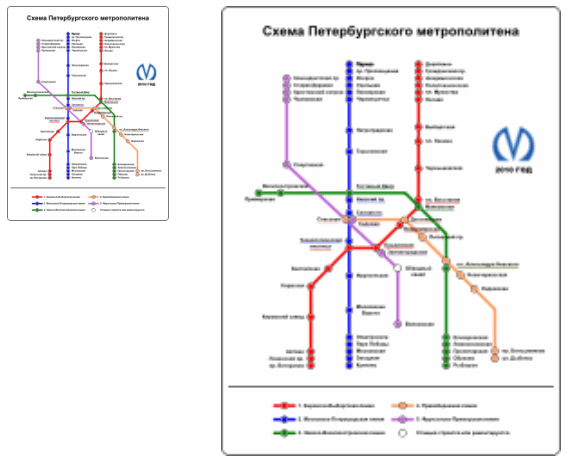
This is a reduction of a subway map.
Eureka Math Grade 7 Module 1 Lesson 16 Opening Exercise Answer Key 2

Question 2.
Eureka Math Grade 7 Module 1 Lesson 16 Opening Exercise Answer Key 2.1
Answer:
Eureka Math Grade 7 Module 1 Lesson 16 Opening Exercise Answer Key 2.2

Eureka Math Grade 7 Module 1 Lesson 16 Example Answer Key

Example 1.
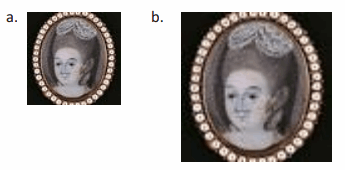
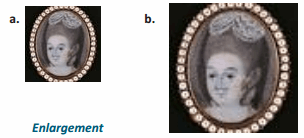
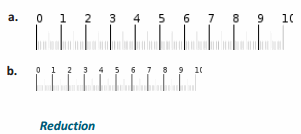
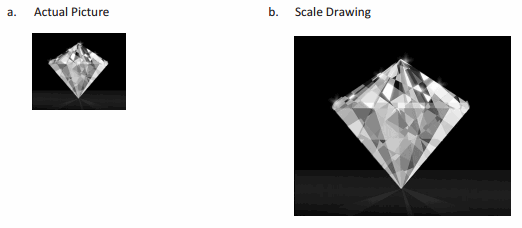
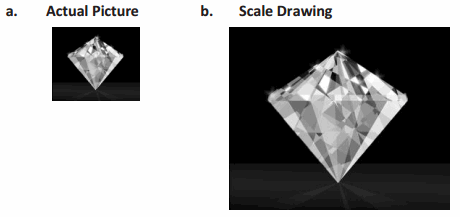
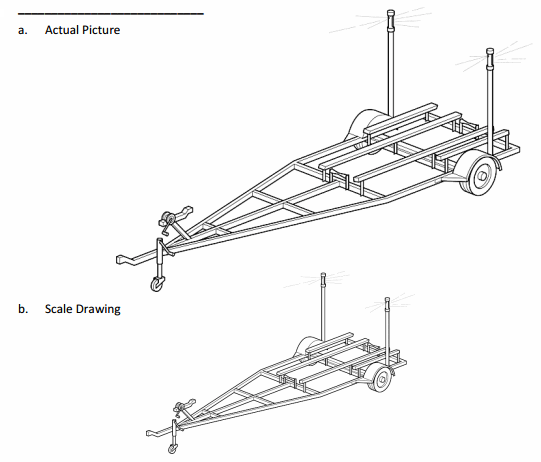
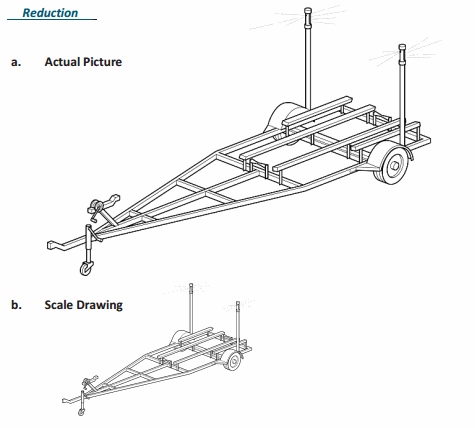
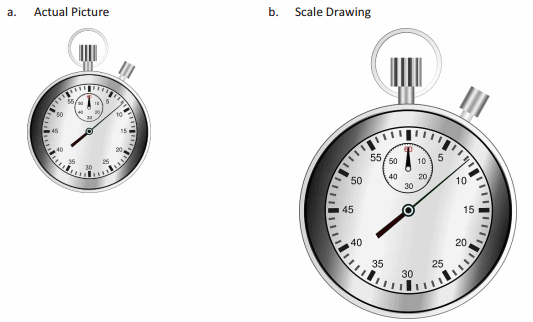
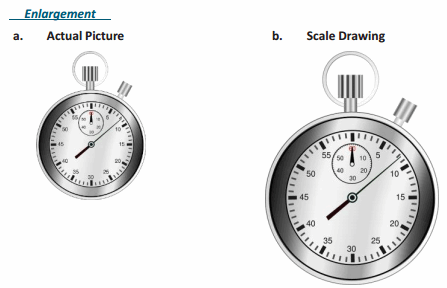
For the following problems, (a) is the actual picture, and (b) is the scale drawing. Is the scale drawing an enlargement or a reduction of the actual picture?

Question 1.
Engage NY Math 7th Grade Module 1 Lesson 16 Example Answer Key 15
Answer:
Engage NY Math 7th Grade Module 1 Lesson 16 Example Answer Key 16

Question 2.
Engage NY Math 7th Grade Module 1 Lesson 16 Example Answer Key 17
Answer:
Engage NY Math 7th Grade Module 1 Lesson 16 Example Answer Key 18

SCALE DRAWING: A reduced or enlarged two-dimensional drawing of an original two-dimensional drawing.

Example 2.
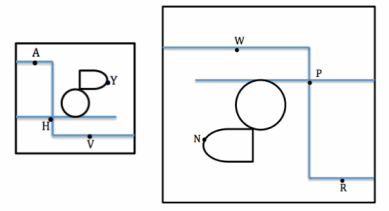
Derek’s family took a day trip to a modern public garden. Derek looked at his map of the park that was a reduction of the map located at the garden entrance. The dots represent the placement of rare plants. The diagram below is the top-view as Derek held his map while looking at the posted map.
Engage NY Math 7th Grade Module 1 Lesson 16 Example Answer Key 19
What are the corresponding points of the scale drawings of the maps?
Point A to ___ Point V to ___ Point H to ___ Point Y to ___
Answer:
Point A to Point R Point V to Point W Point H to Point P Point Y to Point N

Eureka Math Grade 7 Module 1 Lesson 16 Exploratory Challenge Answer Key

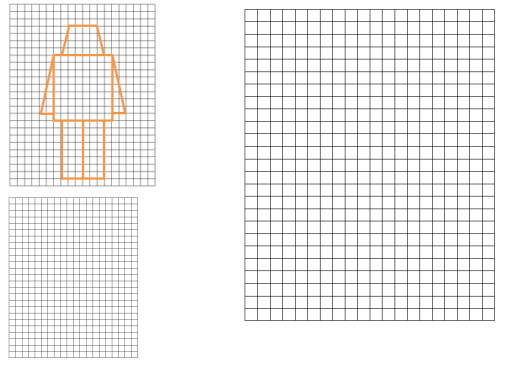
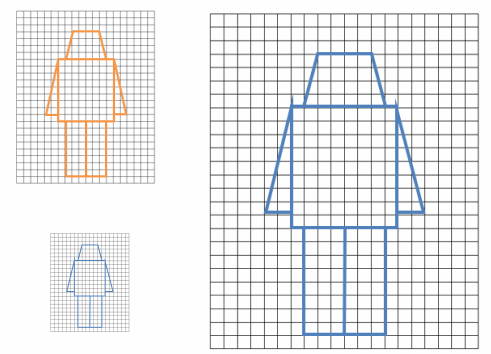
Create scale drawings of your own modern nesting robots using the grids provided.
Eureka Math Grade 7 Module 1 Lesson 16 Exploratory Challenge Answer Key 20
Answer:
Eureka Math Grade 7 Module 1 Lesson 16 Exploratory Challenge Answer Key 21

Example 3.
Celeste drew an outline of a building for a diagram she was making and then drew a second one mimicking her original drawing. State the coordinates of the vertices and fill in the table.
Eureka Math Grade 7 Module 1 Lesson 16 Exploratory Challenge Answer Key 22
Notes
Answer:
Eureka Math Grade 7 Module 1 Lesson 16 Exploratory Challenge Answer Key 23

Eureka Math Grade 7 Module 1 Lesson 16 Exercise Answer Key

Exercise
Luca drew and cut out a small right triangle for a mosaic piece he was creating for art class. His mother liked the mosaic piece and asked if he could create a larger one for their living room. Luca made a second template for his triangle pieces.
Eureka Math Grade 7 Module 1 Lesson 16 Exercise Answer Key 24
Answer:
Eureka Math Grade 7 Module 1 Lesson 16 Exercise Answer Key 25

a. Does a constant of proportionality exist? If so, what is it? If not, explain.
Answer:
No, because the ratios of corresponding side lengths are not equal or proportional to each other.

b. Is Luca’s enlarged mosaic a scale drawing of the first image? Explain why or why not.
Answer:
No, the enlarged mosaic image is not a scale drawing of the first image. We know this because the images do not have all side lengths proportional to each other; there is no constant of proportionality.

Eureka Math Grade 7 Module 1 Lesson 16 Exit Ticket Answer Key

Use the following figure on the graph for Problems 1 and 2.
Eureka Math Grade 7 Module 1 Lesson 16 Exit Ticket Answer Key 26

Question 1.
a. If the original lengths are multiplied by 2, what are the new coordinates?
Answer:
(0,0), (12,18), (12,0)

b. Use the table to organize lengths (the vertical and horizontal legs).
Eureka Math Grade 7 Module 1 Lesson 16 Exit Ticket Answer Key 27
Answer:
Eureka Math Grade 7 Module 1 Lesson 16 Exit Ticket Answer Key 28

c. Is the new drawing a reduction or an enlargement?
Answer:
Enlargement

d. What is the constant of proportionality?
Answer:
2

Question 2.
a. If the original lengths are multiplied by \(\frac{1}{3}\) , what are the new coordinates?
Answer:
(0,0), (2,3), (2,0)

b. Use the table to organize lengths (the vertical and horizontal legs).
Eureka Math Grade 7 Module 1 Lesson 16 Exit Ticket Answer Key 29
Answer:
Eureka Math Grade 7 Module 1 Lesson 16 Exit Ticket Answer Key 30

c. Is the new drawing a reduction or an enlargement?
Answer:
Reduction

d. What is the constant of proportionality?
Answer:
\(\frac{1}{3}\)

Eureka Math Grade 7 Module 1 Lesson 16 Problem Set Answer Key

For Problems 1–3, identify if the scale drawing is a reduction or an enlargement of the actual picture.

Question 1.
Eureka Math Grade 7 Module 1 Lesson 16 Problem Set Answer Key 60
Answer:
Enlargement
Eureka Math Grade 7 Module 1 Lesson 16 Problem Set Answer Key 41

Question 2.
Eureka Math Grade 7 Module 1 Lesson 16 Problem Set Answer Key 42
Answer:
Eureka Math Grade 7 Module 1 Lesson 16 Problem Set Answer Key 43

Question 3.
Eureka Math Grade 7 Module 1 Lesson 16 Problem Set Answer Key 44
Answer:
Eureka Math Grade 7 Module 1 Lesson 16 Problem Set Answer Key 45

Question 4.
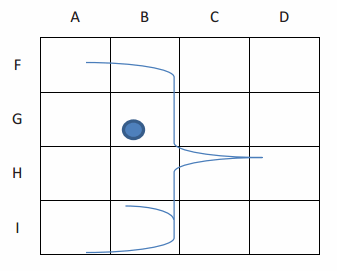
Using the grid and the abstract picture of a face, answer the following questions:
Eureka Math Grade 7 Module 1 Lesson 16 Problem Set Answer Key 46
a. On the grid, where is the eye?
Answer:
Intersection BG

b. What is located in DH?
Answer:
Tip of the nose

c. In what part of the square BI is the chin located?
Answer:
Bottom right corner

Question 5.
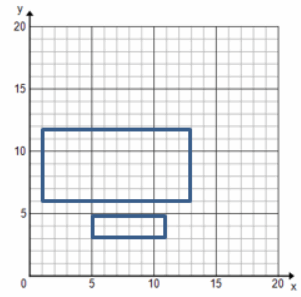
Use the blank graph provided to plot the points and decide if the rectangular cakes are scale drawings of each other.
Cake 1: (5, 3), (5, 5), (11, 3), (11, 5)
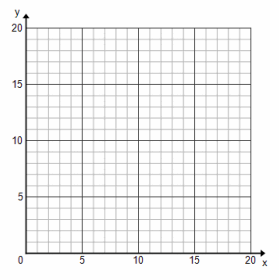
Cake 2: (1, 6), (1, 12), (13, 12), (13, 6)
How do you know?
Eureka Math Grade 7 Module 1 Lesson 16 Problem Set Answer Key 47.1
Answer:
These images are not scale drawings of each other because the short length of Cake 2 is three times longer than Cake 1, but the longer length of Cake 2 is only twice as long as Cake 1. Both should either be twice as long or three times as long to have one-to-one correspondence and to be scale drawings of each other.
Eureka Math Grade 7 Module 1 Lesson 16 Problem Set Answer Key 47

Eureka Math Grade 7 Module 1 Lesson 20 Answer Key

Engage NY Eureka Math 7th Grade Module 1 Lesson 20 Answer Key

Eureka Math Grade 7 Module 1 Lesson 20 Exploratory Challenge Answer Key

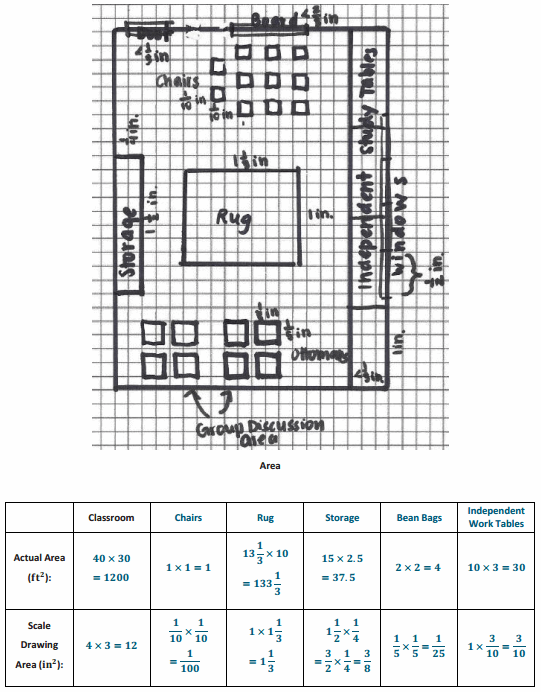
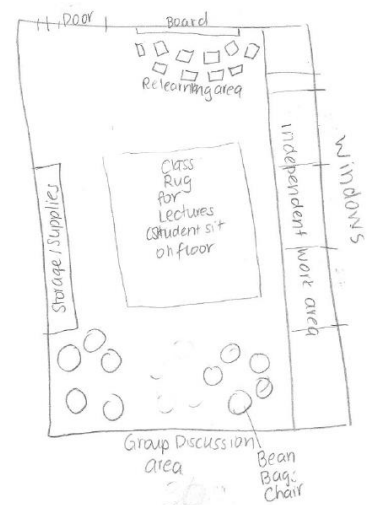
Inform students they will be working in pairs to create their dream classroom. The principal is looking for ideas to create spaces conducive to enjoyable and increased learning. Be as creative as you can be! Didn’t you always think there should be nap time? Now, you can create an area for it!
Allow each student to work at his or her own pace. Guidelines are provided in the Student Pages.

Exploratory Challenge: Your Dream Classroom
Guidelines
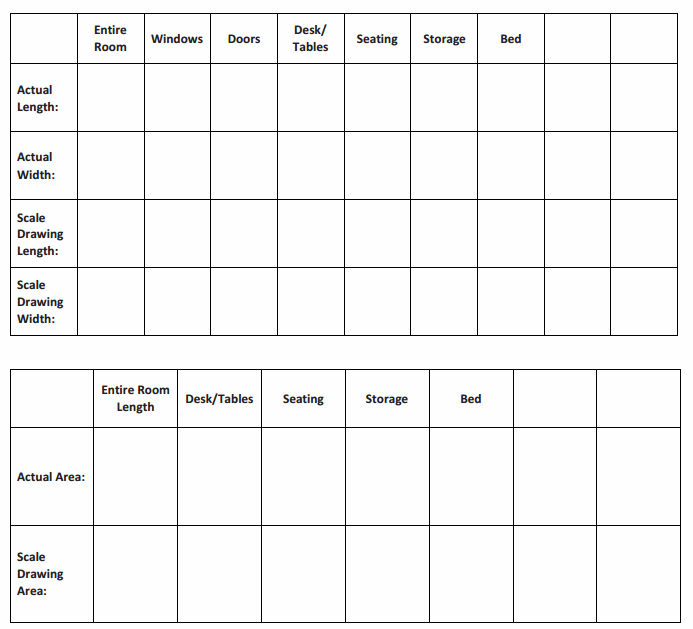
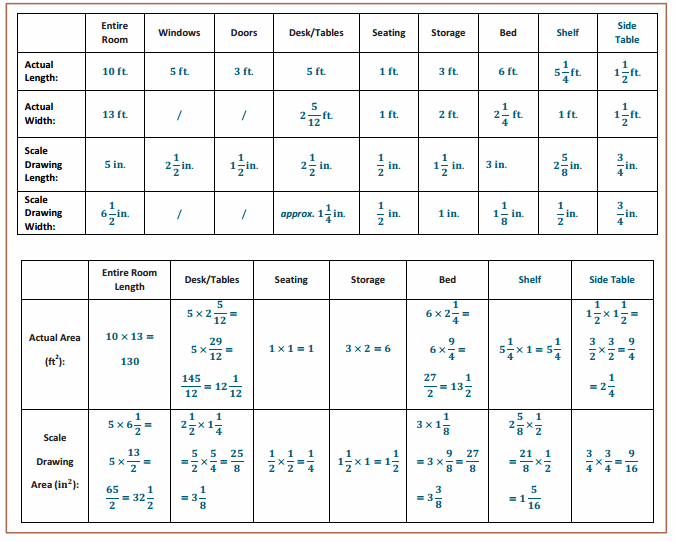
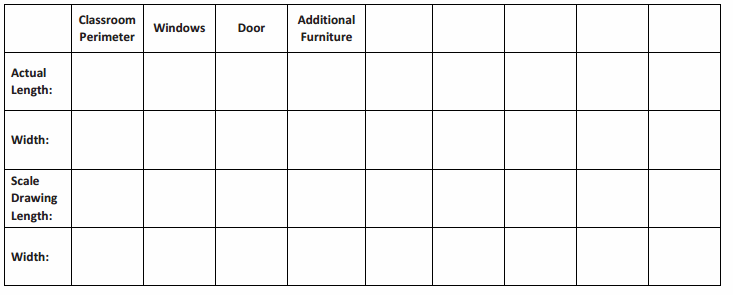
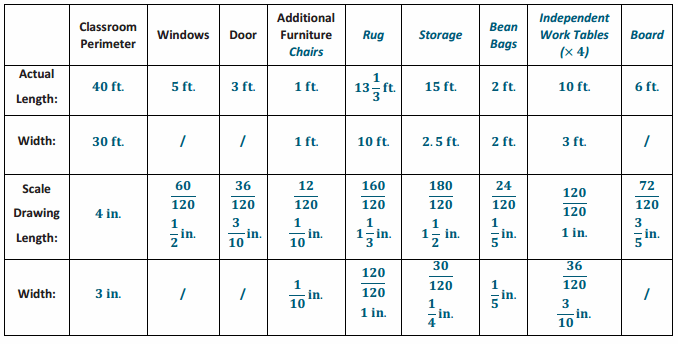
Take measurements: All students should work with the perimeter of the classroom as well as the doors and windows. Give students the dimensions of the room. Have students use the table provided to record the measurements.

Create your dream classroom, and use the furniture catalog to pick out your furniture: Students should discuss what their ideal classroom should look like with their partners and pick out furniture from the catalog. Students should record the actual measurements on the given table.

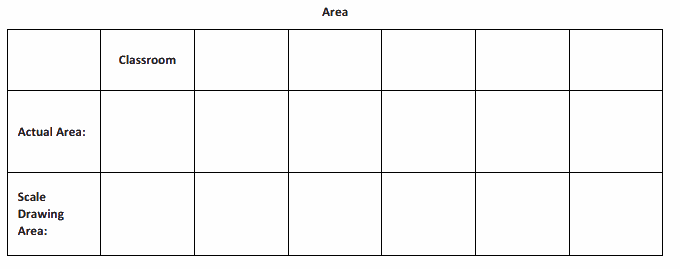
Determine the scale and calculate scale drawing lengths and widths: Each pair of students should determine its own scale. The calculation of the scale drawing lengths, widths, and areas is to be included.

Scale Drawing: Using a ruler and referring back to the calculated scale length, students should draw the scale drawing including the doors, windows, and furniture.
Eureka Math Grade 7 Module 1 Lesson 20 Exploratory Challenge Answer Key 1
Scale: __
Answer:
Eureka Math Grade 7 Module 1 Lesson 20 Exploratory Challenge Answer Key 2
Scale: \(\frac{1}{120}\)

Initial Sketch: Use this space to sketch the classroom perimeter, draw out your ideas, and play with the placement of the furniture.
Answer:
Eureka Math Grade 7 Module 1 Lesson 20 Exploratory Challenge Answer Key 4

Scale Drawing: Use a ruler and refer back to the calculated scale length, draw the scale drawing including the doors, windows, and furniture.
Eureka Math Grade 7 Module 1 Lesson 20 Exploratory Challenge Answer Key 5
Eureka Math Grade 7 Module 1 Lesson 20 Exploratory Challenge Answer Key 6
Answer:
Eureka Math Grade 7 Module 1 Lesson 20 Exploratory Challenge Answer Key 7

Eureka Math Grade 7 Module 1 Lesson 20 Problem Set Answer Key

Interior Designer:
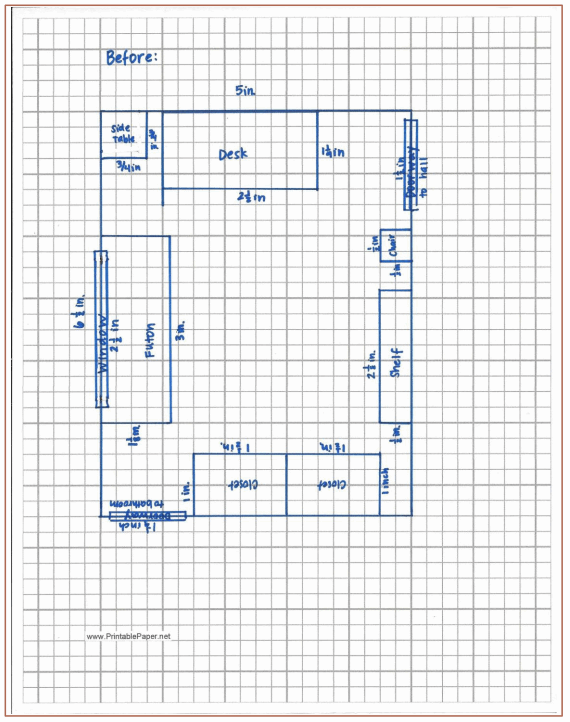
You won a spot on a famous interior designing TV show! The designers will work with you and your existing furniture to redesign a room of your choice. Your job is to create a top-view scale drawing of your room and the furniture within it.
→ With the scale factor being \(\frac{1}{24}\), create a scale drawing of your room or other favorite room in your home on a sheet of 8.5 × 11-inch graph paper.
→ Include the perimeter of the room, windows, doorways, and three or more furniture pieces (such as tables, desks, dressers, chairs, bed, sofa, and ottoman).
→ Use the table to record lengths and include calculations of areas.
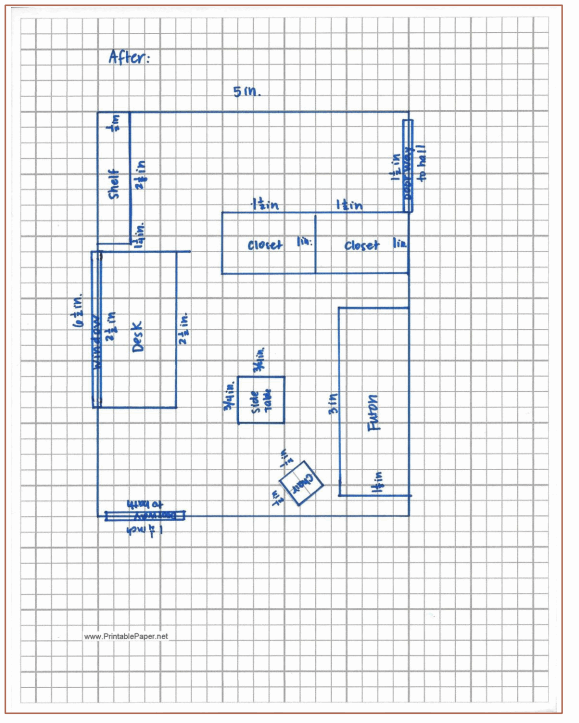
→ Make your furniture “moveable” by duplicating your scale drawing and cutting out the furniture.
→ Create a “before” and “after” to help you decide how to rearrange your furniture. Take a photo of your “before.”
→ What changed in your furniture plans?
→ Why do you like the “after” better than the “before”?
Eureka Math Grade 7 Module 1 Lesson 20 Problem Set Answer Key 10
Eureka Math Grade 7 Module 1 Lesson 20 Problem Set Answer Key 11
Answer:
Eureka Math Grade 7 Module 1 Lesson 20 Problem Set Answer Key 12
Eureka Math Grade 7 Module 1 Lesson 20 Problem Set Answer Key 13
Eureka Math Grade 7 Module 1 Lesson 20 Problem Set Answer Key 14

Eureka Math Grade 7 Module 1 Lesson 20 Exit Ticket Answer Key

Question 1.
Your sister has just moved into a loft-style apartment in Manhattan and has asked you to be her designer. Indicate the placement of the following objects on the floorplan using the appropriate scale: queen-size bed (60 in. by 80 in.), sofa (36 in. by 64 in.), and dining table (48 in. by 48 in.) In the following scale drawing, 1 cm represents 2 ft. Each square on the grid is 1 cm².
Eureka Math Grade 7 Module 1 Lesson 20 Exit Ticket Answer Key 8
Answer:
Eureka Math Grade 7 Module 1 Lesson 20 Exit Ticket Answer Key 8.1
Queen Bed: 60 ÷ 12 = 5, 5 ÷ 2 = 2 \(\frac{1}{2}\)
80 ÷ 12 = 6\(\frac{2}{3}\), 6 \(\frac{2}{3}\)÷2=3 \(\frac{1}{3}\)
The queen bed is 2 \(\frac{1}{2}\) cm by 3 \(\frac{1}{3}\) cm in the scale drawing.
Sofa: 36 ÷ 12 = 3, 3 ÷ 2 = 1 \(\frac{1}{2}\)
64 ÷ 12 = 5 \(\frac{1}{3}\), 5 \(\frac{1}{3}\) ÷ 2 = 2 \(\frac{2}{3}\)
The sofa is 1 \(\frac{1}{2}\) cm by 2 \(\frac{2}{3}\) cm in the scale drawing.
Dining Table: 48 ÷ 12 = 4, 4 ÷ 2 = 2
The dining table is 2 cm by 2 cm in the scale drawing.

Question 2.
Choose one object and explain the procedure to find the scale lengths.
Answer:
Take the actual measurements in inches and divide by 12 inches to express the value in feet. Then divide the actual length in feet by 2 since 2 feet represents 1 centimeter. The resulting quotient is the scale length.

Eureka Math Grade 7 Module 1 Lesson 13 Answer Key

Engage NY Eureka Math 7th Grade Module 1 Lesson 13 Answer Key

Eureka Math Grade 7 Module 1 Lesson 13 Example Answer Key

Example 1.
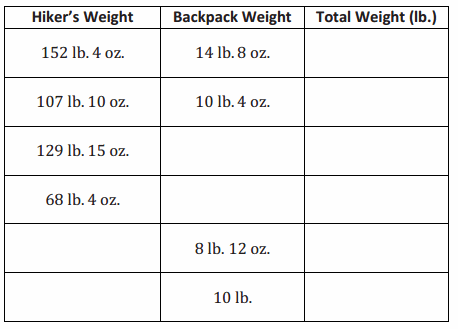
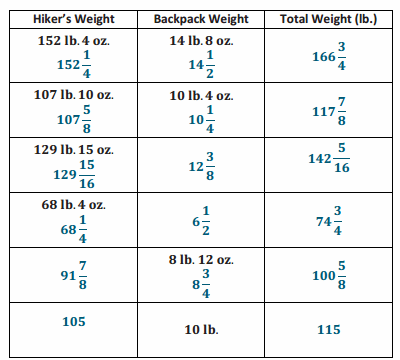
A group of 6 hikers are preparing for a one-week trip. All of the group’s supplies will be carried by the hikers in backpacks. The leader decides that each hiker will carry a backpack that is the same fraction of weight to all of the other hikers’ weights. This means that the heaviest hiker would carry the heaviest load. The table below shows the weight of each hiker and the weight of the backpack.
Complete the table. Find the missing amounts of weight by applying the same value of the ratio as the first two rows.
Engage NY Math 7th Grade Module 1 Lesson 13 Example Answer Key 1
Answer:
Engage NY Math 7th Grade Module 1 Lesson 13 Example Answer Key 2

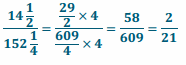
Value of the ratio of backpack weight to hiker weight:
Engage NY Math 7th Grade Module 1 Lesson 13 Example Answer Key 3

Equations:
Backpack weight (pounds): B
Hiker’s weight (pounds): H
B = \(\frac{2}{21}\) H
B = \(\frac{2}{21}\) (129 \(\frac{15}{16}\) )
B = 12\(\frac{3}{8}\)

Example 2.
When a business buys a fast food franchise, it is buying the recipes used at every restaurant with the same name. For example, all Pizzeria Specialty House Restaurants have different owners, but they must all use the same recipes for their pizza, sauce, bread, etc. You are now working at your local Pizzeria Specialty House Restaurant, and listed below are the amounts of meat used on one meat-lovers pizza.
\(\frac{1}{4}\) cup of sausage
\(\frac{1}{3}\) cup of pepperoni
\(\frac{1}{6}\) cup of bacon
\(\frac{1}{8}\) cup of ham
\(\frac{1}{8}\) cup of beef

What is the total amount of toppings used on a meat-lovers pizza? __ cup(s)
Answer:
1

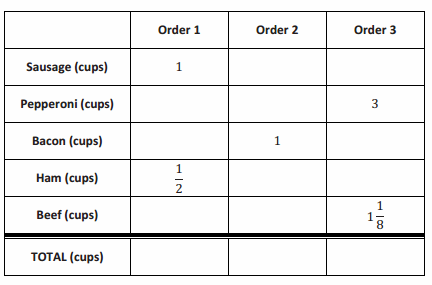
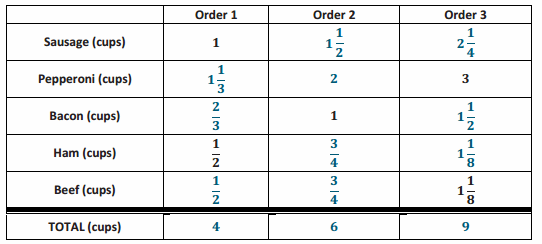
The meat must be mixed using this ratio to ensure that customers receive the same great tasting meat-lovers pizza from every Pizzeria Specialty House Restaurant nationwide. The table below shows 3 different orders for meat-lovers pizzas on the night of the professional football championship game. Using the amounts and total for one pizza given above, fill in every row and column of the table so the mixture tastes the same.
Engage NY Math 7th Grade Module 1 Lesson 13 Example Answer Key 20
Answer:
Engage NY Math 7th Grade Module 1 Lesson 13 Example Answer Key 20.1

Eureka Math Grade 1 Module 1 Lesson 13 Exercise Answer Key

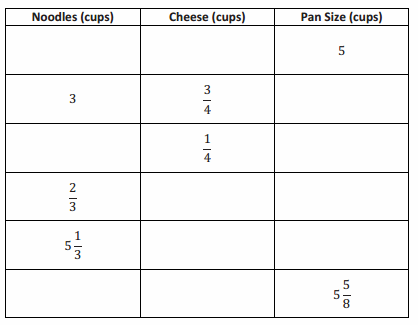
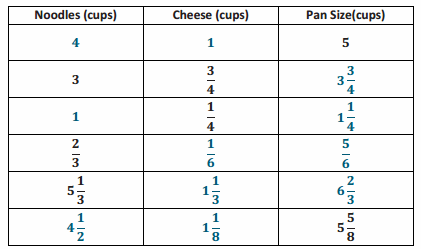
The table below shows 6 different-sized pans that could be used to make macaroni and cheese. If the ratio of ingredients stays the same, how might the recipe be altered to account for the different-sized pans?

Eureka Math Grade 7 Module 1 Lesson 13 Exercise Answer Key 21
Answer:
Eureka Math Grade 7 Module 1 Lesson 13 Exercise Answer Key 21.1

Method 1: Equations
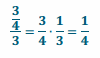
Find the constant rate. To do this, use the row that gives both quantities, not the total. To find the unit rate:
Eureka Math Grade 7 Module 1 Lesson 13 Exercise Answer Key 22
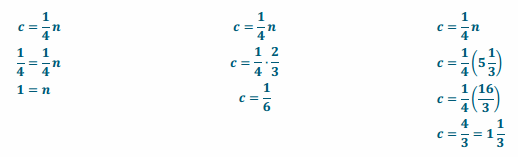
Write the equation of the relationship. c = \(\frac{1}{4}\) n, where c represents the cups of cheese and n represents the cups of noodles.
Eureka Math Grade 7 Module 1 Lesson 13 Exercise Answer Key 23

Method 2: Proportions
Find the constant rate as described in Method 1.
Set up proportions.
y represents the number of cups of cheese, and x represents the number of cups of noodles.
Eureka Math Grade 1 Module 1 Lesson 13 Exercise Answer Key 24

Eureka Math Grade 7 Module 1 Lesson 13 Problem Set Answer Key

Question 1.
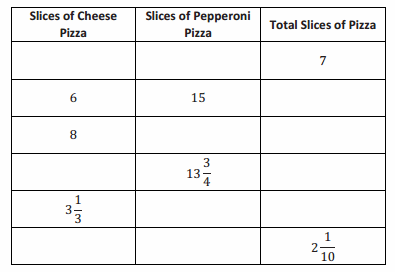
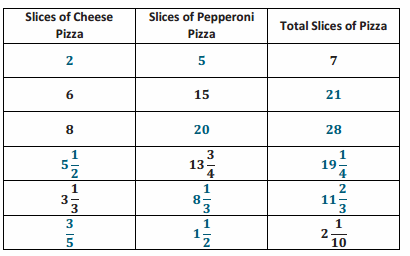
Students in 6 classes, displayed below, ate the same ratio of cheese pizza slices to pepperoni pizza slices. Complete the following table, which represents the number of slices of pizza students in each class ate.
Eureka Math Grade 7 Module 1 Lesson 13 Problem Set Answer Key 50
Answer:
Eureka Math Grade 7 Module 1 Lesson 13 Problem Set Answer Key 51

Question 2.
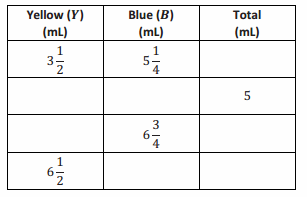
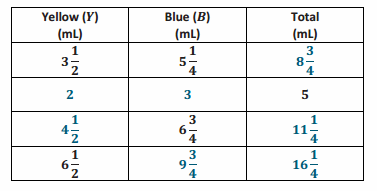
To make green paint, students mixed yellow paint with blue paint. The table below shows how many yellow and blue drops from a dropper several students used to make the same shade of green paint.
a. Complete the table.
Eureka Math Grade 7 Module 1 Lesson 13 Problem Set Answer Key 52
Answer:
Eureka Math Grade 7 Module 1 Lesson 13 Problem Set Answer Key 53

b. Write an equation to represent the relationship between the amount of yellow paint and blue paint.
Answer:
B = 1.5Y

Question 3.
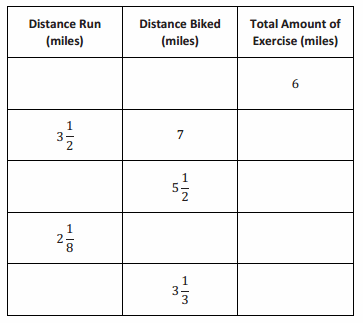
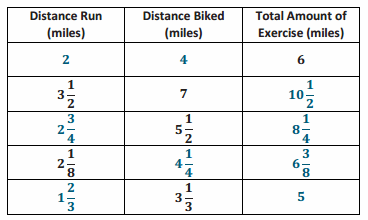
The ratio of the number of miles run to the number of miles biked is equivalent for each row in the table.
a. Complete the table.
Eureka Math Grade 7 Module 1 Lesson 13 Problem Set Answer Key 54
Answer:
Eureka Math Grade 7 Module 1 Lesson 13 Problem Set Answer Key 55

b. What is the relationship between distances biked and distances run?
Answer:
The distances biked were twice as far as the distances run.

Question 4.
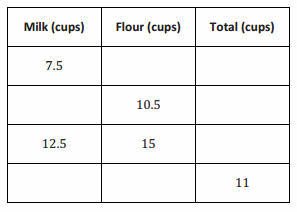
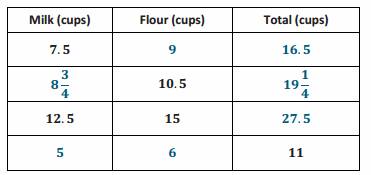
The following table shows the number of cups of milk and flour that are needed to make biscuits. Complete the table.
Eureka Math Grade 7 Module 1 Lesson 13 Problem Set Answer Key 56
Answer:
Eureka Math Grade 7 Module 1 Lesson 13 Problem Set Answer Key 57

Eureka Math Grade 7 Module 1 Lesson 13 Exit Ticket Answer Key

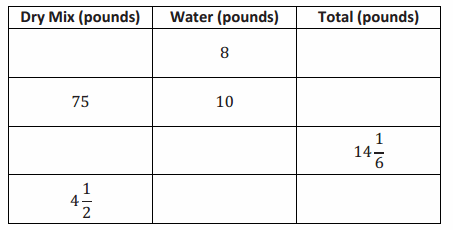
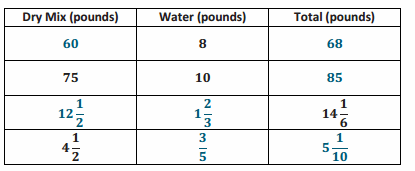
The table below shows the combination of a dry prepackaged mix and water to make concrete. The mix says for every 1 gallon of water stir 60 pounds of dry mix. We know that 1 gallon of water is equal to 8 pounds of water. Using the information provided in the table, complete the remaining parts of the table.
Engage NY Math 7th Grade Module 1 Lesson 13 Exit Ticket Answer Key 25
Answer:
Engage NY Math 7th Grade Module 1 Lesson 13 Exit Ticket Answer Key 26

Eureka Math Grade 7 Module 1 Lesson 11 Answer Key

Engage NY Eureka Math 7th Grade Module 1 Lesson 11 Answer Key

Eureka Math Grade 7 Module 1 Lesson 11 Example Answer Key

Example 1.
Who is Faster?
Answer:
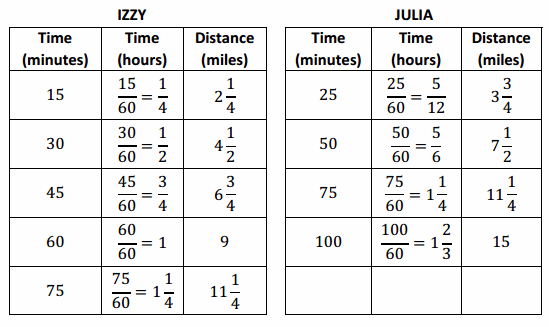
During their last workout, Izzy ran 2\(\frac{1}{4}\) miles in 15 minutes, and her friend Julia ran 3\(\frac{3}{4}\) miles in 25 minutes. Each girl thought she was the faster runner. Based on their last run, which girl is correct? Use any approach to find the solution.

Tables:
Engage NY Math 7th Grade Module 1 Lesson 11Example Answer Key 1
→ When looking at and comparing the tables, it appears that Julia went farther, so this would mean she ran faster. Is that assumption correct? Explain your reasoning.
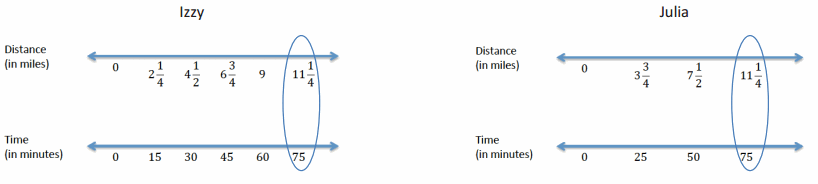
→ By creating a table of equivalent ratios for each runner showing the elapsed time and corresponding distance ran, it may be possible to find a time or a distance that is common to both tables. It can then be determined if one girl had a greater distance for a given time or if one girl had less time for a given distance. In this case, at 75 minutes, both girls ran 11\(\frac{1}{4}\) miles, assuming they both ran at a constant speed.
→ How can we use the tables to determine the unit rate?
→ Since we assumed distance is proportional to time, the unit rate or constant of proportionality can be determined by dividing the distance by the time. When the time is in hours, then the unit rate is calculated in miles per hour, which is 9. If the time is in minutes, then the unit rate is calculated in miles per minute, which is \(\frac{3}{20}\).
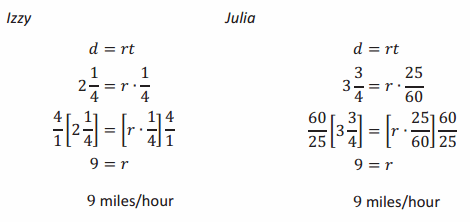
→ Discuss: Some students may have chosen to calculate the unit rates for each of the girls. To calculate the unit rate for Izzy, students divided the distance ran, 2\(\frac{1}{4}\) , by the elapsed time, \(\frac{15}{60}\) , which has a unit rate of 9. To find the unit rate for Julia, students divided 3 \(\frac{3}{4}\) by \(\frac{25}{60}\) and arrived at a unit rate of 9, as well, leading students to conclude that neither girl was faster.

→ We all agree that the girls ran at the same rate; however, some members of the class identified the unit rate as 9 while others gave a unit rate of \(\frac{3}{20}\) . How can both groups of students be correct?
→ Time can be represented in minutes; however, in real-world contexts, most people are comfortable with distance measured by hours. It is easier for a person to visualize 9 miles per hour compared to \(\frac{3}{20}\) miles per minute, although it is an acceptable answer.

Equations:
Engage NY Math 7th Grade Module 1 Lesson 11Example Answer Key 20

→ What assumptions are made when using the formula d = rt in this problem?
→ We are assuming the distance is proportional to time, and that Izzy and Julia ran at a constant rate. This means they ran the same speed the entire time not slower at one point or faster at another.
Picture:
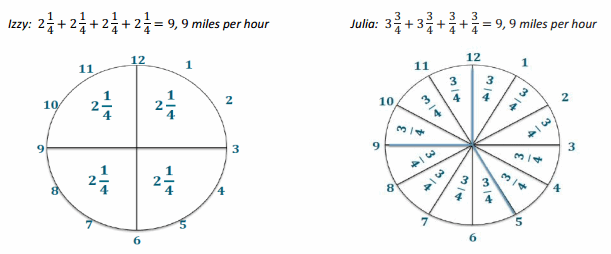
→ Some students may decide to draw a clock.
→ Possible student explanation:
For Izzy, every 15 minutes of running results in a distance of 2 \(\frac{1}{4}\) miles. Since the clock is divided into 15-minute intervals, I added the distance for each 15-minute interval until I reached 60 minutes. Julia’s rate is 3 \(\frac{3}{4}\) miles in 25 minutes, so I divided the clock into 25-minute intervals. Each of those 25-minute intervals represents 3 \(\frac{3}{4}\) miles. At 50 minutes, the distance represented is two times 3 \(\frac{3}{4}\) , or 7 \(\frac{1}{2}\) miles. To determine the distance ran in the last ten minutes, I needed to determine the distance for 5 minutes: 3 \(\frac{3}{4}\) ÷5 = \(\frac{3}{4}\) . Therefore, 3 \(\frac{3}{4}\) + 3 \(\frac{3}{4}\) + \(\frac{3}{4}\) + \(\frac{3}{4}\) = 9, or 9 miles per hour.

Total Distance for 1 hour
Engage NY Math 7th Grade Module 1 Lesson 11Example Answer Key 30

→ How do you find the value of a 5-minute time increment? What are you really finding?
→ To find the value of a 5-minute increment, you need to divide 3 \(\frac{3}{4}\) by 5 since 25 minutes is five 5-minute increments. This is finding the unit rate for a 5-minute increment.
→ Why were 5-minute time increments chosen?
→ 5-minute time increments were chosen for a few reasons. First, a clock can be separated into 5-minute intervals, so it may be easier to visualize what fractional part of an hour one has when given a 5-minute interval. Also, 5 is the greatest common factor of the two given times.
→ What if the times had been 24 and 32 minutes or 18 and 22 minutes? How would this affect the time increments?
→ If the times were 24 and 32 minutes, then the time increment would be 8-minute intervals. This is because 8 is the greatest common factor of 24 and 32.
→ If the times were 18 and 22 minutes, then the comparison should be broken into 2-minute intervals since the greatest common factor of 18 and 22 is 2.

Double Number Line Approach:
Engage NY Math 7th Grade Module 1 Lesson 11Example Answer Key 35

Example 2
Is Meredith Correct?
A turtle walks \(\frac{7}{8}\) of a mile in 50 minutes. What is the unit rate when the turtle’s speed is expressed in miles per hour?
a. To find the turtle’s unit rate, Meredith wrote the following complex fraction. Explain how the fraction \(\frac{5}{6}\) was obtained.
Answer:
Engage NY Math 7th Grade Module 1 Lesson 11Example Answer Key 36
To determine the unit rate, Meredith divided the distance walked by the amount of time it took the turtle. Since the unit rate is expressed in miles per hour, 50 minutes needs to be converted to hours. Since 60 minutes is equal to 1 hour, 50 minutes can be written as \(\frac{50}{60}\) hours, or \(\frac{5}{6}\) hours.

→ How can we determine the unit rate? We need a denominator of 1 hour. Right now, the denominator is \(\frac{5}{6}\) hours.
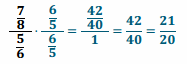
→ We can multiply \(\frac{5}{6}\) by its multiplicative inverse \(\frac{6}{5}\) to determine a denominator of 1 hour.
→ Using this information, determine the unit rate in miles per hour.

b. Determine the unit rate when the turtle’s speed is expressed in miles per hour.
Engage NY Math 7th Grade Module 1 Lesson 11Example Answer Key 37
Answer:
The unit rate is \(\frac{21}{20}\) . The turtle’s speed is \(\frac{21}{20}\) mph.

Eureka Math Grade 7 Module 1 Lesson 11 Exercise Answer Key

Exercise 1.
For Anthony’s birthday, his mother is making cupcakes for his 12 friends at his daycare. The recipe calls for 3 \(\frac{1}{3}\) cups of flour. This recipe makes 2 \(\frac{1}{2}\) dozen cupcakes. Anthony’s mother has only 1 cup of flour. Is there enough flour for each of his friends to get a cupcake? Explain and show your work.
Answer:
Eureka Math Grade 7 Module 1 Lesson 11 Exercise Answer Key 38
No, since Anthony has 12 friends, he would need 1 dozen cupcakes. This means you need to find the unit rate. Finding the unit rate tells us how much flour his mother needs for 1 dozen cupcakes. Upon finding the unit rate, Anthony’s mother would need 1 \(\frac{1}{3}\) cups of flour; therefore, she does not have enough flour to make cupcakes for all of his friends.

Exercise 2.
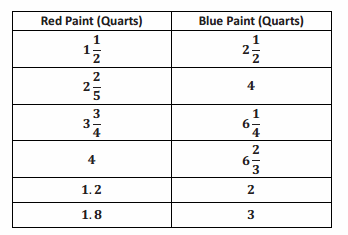
Sally is making a painting for which she is mixing red paint and blue paint. The table below shows the different mixtures being used.
Eureka Math Grade 7 Module 1 Lesson 11 Exercise Answer Key 39
a. What is the unit rate for the values of the amount of blue paint to the amount of red paint?
Answer:
\(\frac{5}{3}\) = 1\(\frac{2}{3}\)

b. Is the amount of blue paint proportional to the amount of red paint?
Answer:
Yes. Blue paint is proportional to red paint because there exists a constant, \(\frac{5}{3}\) =1 \(\frac{2}{3}\) , such that when each amount of red paint is multiplied by the constant, the corresponding amount of blue paint is obtained.

c. Describe, in words, what the unit rate means in the context of this problem.
Answer:
For every 1 \(\frac{2}{3}\) quarts of blue paint, Sally must use 1 quart of red paint.

Eureka Math Grade 7 Module 1 Lesson 11 Problem Set Answer Key

Question 1.
Determine the quotient: 2 \(\frac{4}{7}\) ÷1 \(\frac{3}{6}\) .
Answer:
1\(\frac{5}{7}\)

Question 2.
One lap around a dirt track is \(\frac{1}{3}\) mile. It takes Bryce \(\frac{1}{9}\) hour to ride one lap. What is Bryce’s unit rate, in miles, around the track?
Answer:
3

Question 3.
Mr. Gengel wants to make a shelf with boards that are 1 \(\frac{1}{3}\) feet long. If he has an 18-foot board, how many pieces can he cut from the big board?
Answer:
13 \(\frac{1}{2}\) boards

Question 4.
The local bakery uses 1.75 cups of flour in each batch of cookies. The bakery used 5.25 cups of flour this morning.
a. How many batches of cookies did the bakery make?
Answer:
3 batches

b. If there are 5 dozen cookies in each batch, how many cookies did the bakery make?
Answer:
5(12) = 60
There are 60 cookies per batch.
60(3) = 180
So, the bakery made 180 cookies.

Question 5.
Jason eats 10 ounces of candy in 5 days.
a. How many pounds does he eat per day? (Recall: 16 ounces =1 pound)
Answer:
\(\frac{1}{8}\) lb. each day

b. How long will it take Jason to eat 1 pound of candy?
Answer:
8 days

Eureka Math Grade 7 Module 1 Lesson 11 Exit Ticket Answer Key

Which is the better buy? Show your work and explain your reasoning.
Eureka Math Grade 7 Module 1 Lesson 11 Exit Ticket Answer Key 40
Answer:
Eureka Math Grade 7 Module 1 Lesson 11 Exit Ticket Answer Key 41
2\(\frac{1}{2}\) lb. is the best buy because the price per pound is cheaper.

Eureka Math Grade 7 Module 1 Lesson 17 Answer Key

Engage NY Eureka Math 7th Grade Module 1 Lesson 17 Answer Key

Eureka Math Grade 7 Module 1 Lesson 17 Example Answer Key

Example 1.
Jake’s Icon
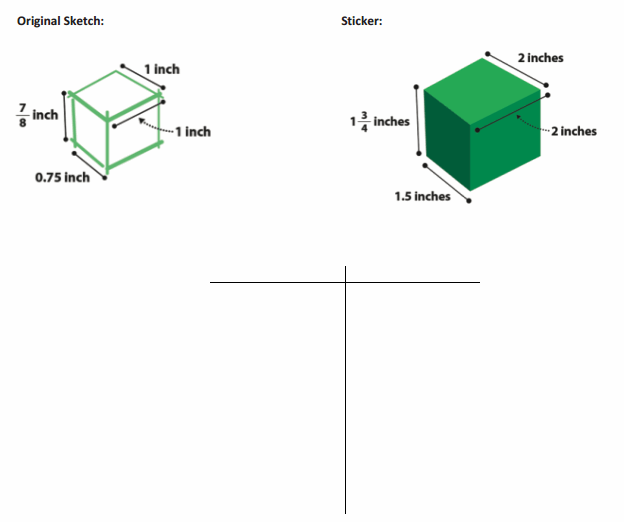
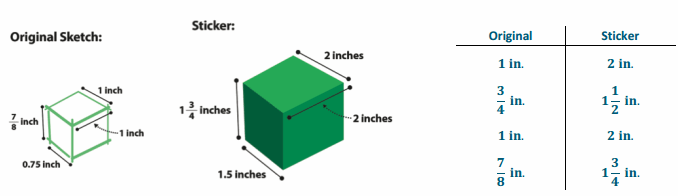
Jake created a simple game on his computer and shared it with his friends to play. They were instantly hooked, and the popularity of his game spread so quickly that Jake wanted to create a distinctive icon so that players could easily identify his game. He drew a simple sketch. From the sketch, he created stickers to promote his game, but Jake wasn’t quite sure if the stickers were proportional to his original sketch.
Engage NY Math 7th Grade Module 1 Lesson 17 Example Answer Key 1
Answer:
Engage NY Math 7th Grade Module 1 Lesson 17 Example Answer Key 500

Steps to check for proportionality for scale drawing and original object or picture:
1. Record the lengths of the scale drawing on the table.
2. Record the corresponding lengths on the actual object or picture on the table.
3. Check for the constant of proportionality.

Key Idea:
The scale factor can be calculated from the ratio of any length in the scale drawing to its corresponding length in the actual picture. The scale factor corresponds to the unit rate and the constant of proportionality.
Scaling by factors greater than 1 enlarges the segment, and scaling by factors less than 1 reduces the segment.

→ What relationship do you see between the measurements?
→ The corresponding lengths are proportional.
→ Is the sticker proportional to the original sketch?
→ Yes, the sticker lengths are twice as long as the lengths in the original sketch.
→ How do you know?
→ The unit rate, 2, is the same for the corresponding measurements.
→ What is this called?
→ Constant of proportionality
→ Introduce the term scale factor and review the key idea box with students.
→ Is the new figure larger or smaller than the original?
→ Larger
→ What is the scale factor for the sticker? How do you know?
→ The scale factor is two because the scale factor is the same as the constant of proportionality. It is the ratio of a length in the scale drawing to the corresponding length in the actual picture, which is 2 to 1. The enlargement is represented by a number greater than 1.
→ Each of the corresponding lengths is how many times larger?
→ Two times
→ What can you predict about an image that has a scale factor of 3?
→ The lengths of the scaled image will be three times as long as the lengths of the original image.

Example 2.
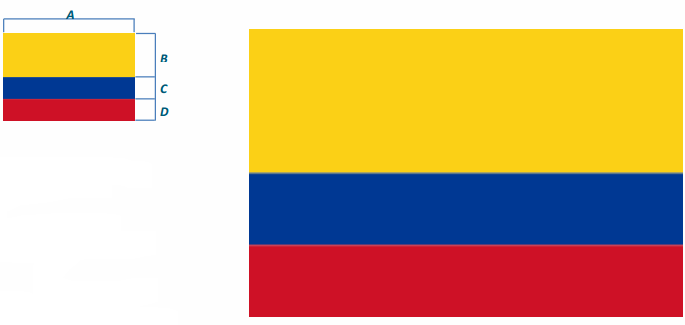
Use a scale factor of 3 to create a scale drawing of the picture below.
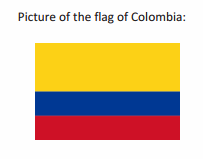
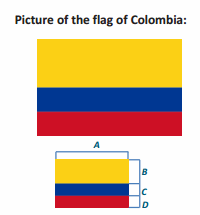
Picture of the flag of Colombia:
Engage NY Math 7th Grade Module 1 Lesson 17 Example Answer Key 2
Answer:
Engage NY Math 7th Grade Module 1 Lesson 17 Example Answer Key 2.4
A. 1\(\frac{1}{2}\)in. × 3 = 4\(\frac{1}{2}\)in.
B. \(\frac{1}{2}\)in. × 3 = 1\(\frac{1}{2}\)in.
C. \(\frac{1}{4}\)in. × 3 = \(\frac{3}{4}\)in.
D. \(\frac{1}{4}\)in. × 3 = \(\frac{3}{4}\)in.

Example 3.
Your family recently had a family portrait taken. Your aunt asks you to take a picture of the portrait using your phone and send it to her. If the original portrait is 3 feet by 3 feet, and the scale factor is \(\frac{1}{18}\), draw the scale drawing that would be the size of the portrait on your phone.
Sketch and notes:
Answer:
Sketch and notes:
3 × 12in. = 36in.
36in. × \(\frac{1}{18}\) = 2in.
Engage NY Math 7th Grade Module 1 Lesson 17 Example Answer Key 3

Eureka Math Grade 7 Module 1 Lesson 17 Exercise Answer Key

Exercise 1.
App Icon
Eureka Math Grade 7 Module 1 Lesson 17 Exercise Answer Key 4
Answer:
Eureka Math Grade 7 Module 1 Lesson 17 Exercise Answer Key 4.1

Exercise 2.
Use a Scale factor of 3 to create a scale drawing of the picture below.
Picture of the flag of Colombia:
Eureka Math Grade 7 Module 1 Lesson 17 Exercise Answer Key 5
Answer:
Eureka Math Grade 7 Module 1 Lesson 17 Exercise Answer Key 6
Scale Factor = \(\frac{1}{2}\)
Sketch and notes:
A. 1 \(\frac{1}{2}\) in.×\(\frac{1}{2}\) = \(\frac{3}{4}\) in.
B. \(\frac{1}{2}\) in.×\(\frac{1}{2}\) = \(\frac{1}{4}\) in.
C. \(\frac{1}{4}\) in.×\(\frac{1}{2}\) = \(\frac{1}{8}\) in.
D. \(\frac{1}{4}\) in.×\(\frac{1}{2}\) =\(\frac{1}{8}\) in.

Exercise 3
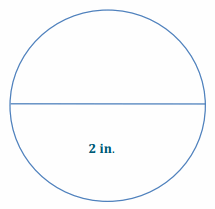
John is building his daughter a doll house that is a miniature model of their house. The front of their house has a circular window with a diameter of 5 feet. If the scale factor for the model house is \(\frac{1}{30}\), make a sketch of the circular doll house window.
Answer:
5 × 12 in. = 60 in.
60 in. × \(\frac{1}{30}\) = 2 in.
Eureka Math Grade 7 Module 1 Lesson 17 Exercise Answer Key 7

Eureka Math Grade 7 Module 1 Lesson 17 Problem Set Answer Key

Question 1.
Giovanni went to Los Angeles, California, for the summer to visit his cousins. He used a map of bus routes to get from the airport to his cousin’s house. The distance from the airport to his cousin’s house is 56 km. On his map, the distance was 4 cm. What is the scale factor?
Answer:
The scale factor is \(\frac{1}{1,400,000}\) . I had to change kilometers to centimeters or centimeters to kilometers or both to meters in order to determine the scale factor.

Question 2.
Nicole is running for school president. Her best friend designed her campaign poster, which measured 3 feet by 2 feet. Nicole liked the poster so much, she reproduced the artwork on rectangular buttons that measured 2 inches by 1\(\frac{1}{3}\) inches. What is the scale factor?

Answer:
The scale factor is \(\frac{2}{3}\).

Question 3.
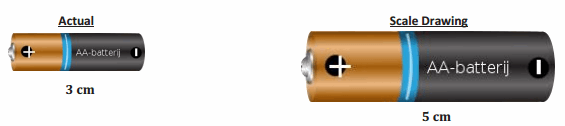
Find the scale factor using the given scale drawings and measurements below.
Scale factor: ___
Eureka Math Grade 7 Module 1 Lesson 17 Problem Set Answer Key 8.3
Answer:
Eureka Math Grade 7 Module 1 Lesson 17 Problem Set Answer Key 8.3
Scale Factor: \(\frac{5}{3}\)

Question 4.
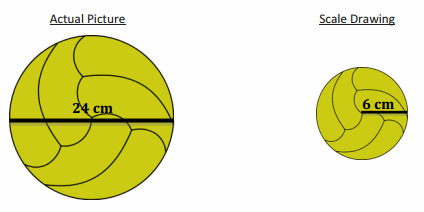
Find the scale factor using the given scale drawings and measurements below.
Scale Factor: ___
Eureka Math Grade 7 Module 1 Lesson 17 Exit Ticket Answer Key 9
Answer:
Eureka Math Grade 7 Module 1 Lesson 17 Exit Ticket Answer Key 10
Scale Factor: \(\frac{1}{2}\)
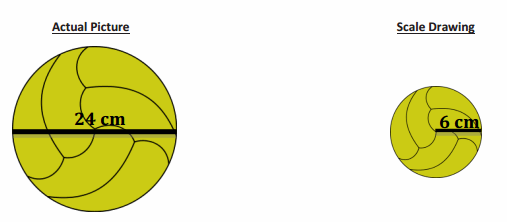
** compare diameter to diameter or radius to radius.

Question 5.
Using the given scale factor, create a scale drawing from the actual pictures in centimeters:
a. Scale factor: 3
Eureka Math Grade 7 Module 1 Lesson 17 Problem Set Answer Key 501
Answer:
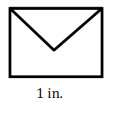
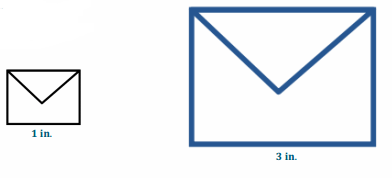
Small Picture : 1 in.
Large Picture: 3 in.
Eureka Math Grade 7 Module 1 Lesson 17 Problem Set Answer Key 11

b. Scale factor: \(\frac{3}{4}\)
Eureka Math Grade 7 Module 1 Lesson 17 Problem Set Answer Key 502
Answer:
Eureka Math Grade 7 Module 1 Lesson 17 Problem Set Answer Key 12

Question 6.
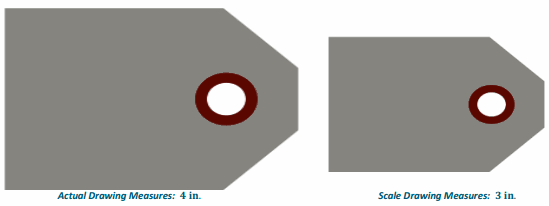
Hayden likes building radio-controlled sailboats with her father. One of the sails, shaped like a right triangle, has side lengths measuring 6 inches, 8 inches, and 10 inches. To log her activity, Hayden creates and collects drawings of all the boats she and her father built together. Using the scale factor of \(\frac{1}{4}\) , create a scale drawing of the sail.
Answer:
A triangle with sides 1.5 inches, 2 inches, and 2.5 inches is drawn.
Eureka Math Grade 7 Module 1 Lesson 17 Exit Ticket Answer Key

A rectangular pool in your friend’s yard is 150 ft. × 400 ft. Create a scale drawing with a scale factor of \(\frac{1}{600}\) . Use a table or an equation to show how you computed the scale drawing lengths.
Answer:
Eureka Math Grade 7 Module 1 Lesson 17 Exit Ticket Answer Key 8

Eureka Math Grade 7 Module 1 Lesson 12 Answer Key

Engage NY Eureka Math 7th Grade Module 1 Lesson 12 Answer Key

Eureka Math Grade 7 Module 1 Lesson 12 Example Answer Key

Example 1.
Time to Remodel
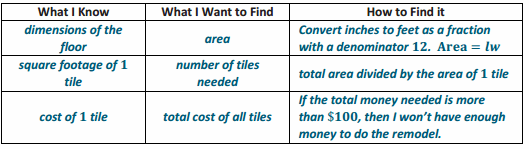
You have decided to remodel your bathroom and install a tile floor. The bathroom is in the shape of a rectangle, and the floor measures 14 feet, 8 inches long by 5 feet, 6 inches wide. The tiles you want to use cost $5 each, and each tile covers 4\(\frac{2}{3}\) square feet. If you have $100 to spend, do you have enough money to complete the project?
Make a Plan: Complete the chart to identify the necessary steps in the plan and find a solution.
Engage NY Math 7th Grade Module 1 Lesson 12 Example Answer Key 0.1
Answer:
Engage NY Math 7th Grade Module 1 Lesson 12 Example Answer Key 1

Compare your plan with a partner. Using your plans, work together to determine how much money you will need to complete the project and if you have enough money.
Answer:
Dimensions:
5 ft.,6 in.=5 \(\frac{1}{2}\) ft.
14 ft.,8 in.= 14 \(\frac{2}{3}\) ft.
Area (square feet):
A = lw
A = (5 \(\frac{1}{2}\) ft.)(14 \(\frac{2}{3}\) ft.)
A = (\(\frac{11}{2}\) ft.)(\(\frac{44}{3}\) ft.)
A = \(\frac{242}{3}\) = 80 \(\frac{2}{3}\)2
Number of Tiles:
Engage NY Math 7th Grade Module 1 Lesson 12 Example Answer Key 2
I cannot buy part of a tile, so I will need to purchase 18 tiles.
Total Cost: 18(5)=$90
Do I have enough money?
Yes. Since the total is less than $100, I have enough money.

Generate discussion about completing the plan and finding the solution. If needed, pose the following questions:
→ Why was the mathematical concept of area, and not perimeter or volume, used?
→ Area was used because we were “covering” the rectangular floor. Area is 2 dimensional, and we were given two dimensions, length and width of the room, to calculate the area of the floor. If we were just looking to put trim around the outside, then we would use perimeter. If we were looking to fill the room from floor to ceiling, then we would use volume.
→ Why would 5.6 inches and 14.8 inches be incorrect representations for 5 feet, 6 inches and 14 feet, 8 inches?
→ The relationship between feet and inches is 12 inches for every 1 foot. To convert to feet, you need to figure out what fractional part 6 inches is of a foot, or 12 inches. If you just wrote 5.6, then you would be basing the inches out of 10 inches, not 12 inches. The same holds true for 14 feet, 8 inches.
→ How is the unit rate useful?
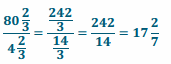
→ The unit rate for a tile is given as 4 \(\frac{2}{3}\) . We can find the total number of tiles needed by dividing the area (total square footage) by the unit rate.
→ Can I buy 17 \(\frac{2}{7}\) tiles?
→ No, you have to buy whole tiles and cut what you may need.
→ How would rounding to 17 tiles instead of rounding to 18 tiles affect the job?
→ Even though the rules of rounding would say round down to 17 tiles, we would not in this problem. If we round down, then the entire floor would not be covered, and we would be short. If we round up to 18 tiles, the entire floor would be covered with a little extra.

Eureka Math Grade 7 Module 1 Lesson 12 Exercise Answer Key

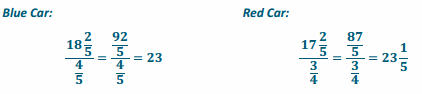
Which car can travel farther on 1 gallon of gas?
Blue Car: travels 18 \(\frac{2}{5}\) miles using 0.8 gallons of gas
Red Car: travels 17 \(\frac{2}{5}\) miles using 0.75 gallons of gas
Answer:
Finding the Unit Rate:
Eureka Math Grade 7 Module 1 Lesson 12 Exercise Answer Key 50
Rate:
Eureka Math Grade 7 Module 1 Lesson 12 Exercise Answer Key 51
The red car traveled \(\frac{1}{5}\) mile farther on one gallon of gas.

Eureka Math Grade 7 Module 1 Lesson 12 Problem Set Answer Key

Question 1.
You are getting ready for a family vacation. You decide to download as many movies as possible before leaving for the road trip. If each movie takes 1 \(\frac{2}{5}\) hours to download, and you downloaded for 5 \(\frac{1}{4}\) hours, how many movies did you download?
Answer:
3 \(\frac{3}{4}\) movies; however, since you cannot download \(\frac{3}{4}\) of a movie, then you downloaded 3 movies.

Question 2.
The area of a blackboard is 1\(\frac{1}{3}\) square yards. A poster’s area is \(\frac{8}{9}\) square yards. Find the unit rate and explain, in words, what the unit rate means in the context of this problem. Is there more than one unit rate that can be calculated? How do you know?
Answer:
1 \(\frac{1}{2}\) . The area of the blackboard is 1 \(\frac{1}{2}\) times the area of the poster.
Yes. There is another possible unit rate: \(\frac{2}{3}\). The area of the poster is \(\frac{2}{3}\) the area of the blackboard.

Question 3.
A toy jeep is 12 \(\frac{1}{2}\) inches long, while an actual jeep measures 18 \(\frac{3}{4}\) feet long. What is the value of the ratio of the length of the toy jeep to the length of the actual jeep? What does the ratio mean in this situation?
Answer:
Eureka Math Grade 7 Module 1 Lesson 12 Problem Set Answer Key 60
Every 2 inches in length on the toy jeep corresponds to 3 feet in length on the actual jeep.

Question 4.
To make 5 dinner rolls, \(\frac{1}{3}\) cup of flour is used.
a. How much flour is needed to make one dinner roll?
Answer:
\(\frac{1}{15}\) cup

b. How many cups of flour are needed to make 3 dozen dinner rolls?
Answer:
2 \(\frac{2}{5}\) cups

c. How many rolls can you make with 5 \(\frac{2}{3}\) cups of flour?
Answer:
85 rolls

Eureka Math Grade 7 Module 1 Lesson 12 Exit Ticket Answer Key

If 3\(\frac{3}{4}\) lb. of candy cost $20.25, how much would 1 lb. of candy cost?
Answer:
5 \(\frac{2}{5}\) = 5.4
One pound of candy would cost $5.40.
Students may find the unit rate by first converting $20.25 to \(\frac{81}{4}\) and then dividing by \(\frac{15}{4}\).

Eureka Math Grade 7 Module 1 Lesson 14 Answer Key

Engage NY Eureka Math 7th Grade Module 1 Lesson 14 Answer Key

Eureka Math Grade 7 Module 1 Lesson 14 Example Answer Key

Example 1.
Bargains
Peter’s Pants Palace advertises the following sale: Shirts are \(\frac{1}{2}\) off the original price; pants are \(\frac{1}{3}\) off the original price; and shoes are \(\frac{1}{4}\) off the original price.
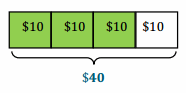
a. If a pair of shoes costs $40, what is the sales price?
Answer:
Method 1: Tape Diagram
Engage NY Math 7th Grade Module 1 Lesson 14 Example Answer Key 1
After \(\frac{1}{4}\) of the price is taken off the original price, the discounted price is $30.

Method 2:
Subtracting \(\frac{1}{4}\) of the price from the original price
40 – \(\frac{1}{4}\) (40)
40 – 10
$30

Method 3:
Finding the fractional part of the price being paid by subtracting \(\frac{1}{4}\) of the price from 1 whole
(1 – \(\frac{1}{4}\) )40
(\(\frac{3}{4}\) )40
$30

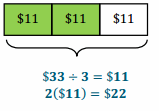
b. At Peter’s Pants Palace, a pair of pants usually sells for $33.00. What is the sales price of Peter’s pants?
Answer:
Method 1: Tape Diagram
Engage NY Math 7th Grade Module 1 Lesson 14 Example Answer Key 2

Method 2:
Use the given rate of discount, multiply by the price, and then subtract from the original price.
33 – \(\frac{1}{3}\) (33) = 33 – 11 = $22
The consumer pays \(\frac{2}{3}\) of the original price.

Method 3:
Subtract the rate from 1 whole, and then multiply that rate by the original price.
1 – \(\frac{1}{3}\) = \(\frac{2}{3}\)
\(\frac{2}{3}\)(33) = $22.00

Use questioning to guide students to develop the methods above. Students do not need to use all three methods, but should have a working understanding of how and why they work in this problem.

Example 2.
Big Al’s Used Cars
A used car salesperson receives a commission of \(\frac{1}{12}\) of the sales price of the car for each car he sells. What would the sales commission be on a car that sold for $21,999?
Answer:
Commission = $21999(\(\frac{1}{12}\) ) = $1833.25
The sales commission would be $1,833.25 for a car sold for $21,999.

Example 3.
Tax Time
As part of a marketing plan, some businesses mark up their prices before they advertise a sales event. Some companies use this practice as a way to entice customers into the store without sacrificing their profits.
A furniture store wants to host a sales event to improve its profit margin and to reduce its tax liability before its inventory is taxed at the end of the year.
How much profit will the business make on the sale of a couch that is marked up by \(\frac{1}{3}\) and then sold at a \(\frac{1}{5}\) off discount if the original price is $2,400?
Answer:
Markup: $2400 + $2400(\(\frac{1}{3}\) ) =$3200 or $2400(1 \(\frac{1}{3}\) ) =$3200
Markdown: $3200 – $3200(\(\frac{1}{5}\) ) = $2560 or $3200(\(\frac{4}{5}\) ) =$2560
Profit = sales price – original price = $2560 – $2400 = $160.00

Example 4.
Born to Ride
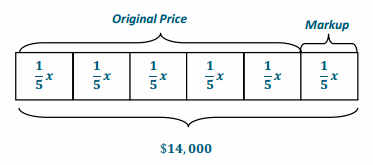
A motorcycle dealer paid a certain price for a motorcycle and marked it up by \(\frac{1}{5}\) of the price he paid. Later, he sold it for $14,000. What is the original price?
Engage NY Math 7th Grade Module 1 Lesson 14 Example Answer Key 50
Let x = the original price
x + \(\frac{1}{5}\) x = 14000
\(\frac{6}{5}\) x=14000
(\(\frac{5}{6}\) ) \(\frac{6}{5}\) x = (\(\frac{5}{6}\) )14000
x = 11666.67

\(\frac{6}{5}\)x = 14000
(\(\frac{5}{6}\) )(\(\frac{6}{5}\) x)=(14000)(\(\frac{5}{6}\) )
x=14000(\(\frac{5}{6}\) )
x = 11666.67
The original price of the car is $11,666.67.

Eureka Math Grade 7 Module 1 Lesson 14 Problem Set Answer Key

Question 1.
A salesperson will earn a commission equal to \(\frac{1}{3}\) 2 of the total sales. What is the commission earned on sales totaling $24,000?
Answer:
(\(\frac{1}{3}\) 2)$24000=$750

Question 2.
DeMarkus says that a store overcharged him on the price of the video game he bought. He thought that the price was marked \(\frac{1}{4}\) of the original price, but it was really \(\frac{1}{4}\) off the original price. He misread the advertisement. If the original price of the game was $48, what is the difference between the price that DeMarkus thought he should pay and the price that the store charged him?
Answer:
\(\frac{1}{4}\) of $48 = $12 (the price DeMarkus thought he should pay); \(\frac{1}{4}\) off $48 = $36; Difference between prices:
$36 – $12=$24

Question 3.
What is the cost of a $1,200 washing machine after a discount of \(\frac{1}{5}\) the original price?
Answer:
(1 – \(\frac{1}{5}\) )$1200=$960 or $1200 – \(\frac{1}{5}\) ($1200)=$960

Question 4.
If a store advertised a sale that gave customers a \(\frac{1}{4}\) discount, what is the fractional part of the original price that the customer will pay?
Answer:
1 – \(\frac{1}{4}\) = \(\frac{3}{4}\) of original price

Question 5.
Mark bought an electronic tablet on sale for \(\frac{1}{4}\) off the original price of $825.00. He also wanted to use a coupon for \(\frac{1}{5}\) off the sales price. How much did Mark pay for the tablet?
Answer:
$825 (\(\frac{3}{4}\) ) =$618.75, then $618.75 (\(\frac{4}{5}\) ) =$495

Question 6.
A car dealer paid a certain price for a car and marked it up by \(\frac{7}{5}\) of the price he paid. Later, he sold it for $24,000. What is the original price?
Answer:
x + \(\frac{7}{5}\) x=24000
\(\frac{12}{5}\) x=24000
x = 10000
The original price was $10,000.

Question 7.
Joanna ran a mile in physical education class. After resting for one hour, her heart rate was 60 beats per minute. If her heart rate decreased by \(\frac{2}{5}\), what was her heart rate immediately after she ran the mile?
Answer:
x – \(\frac{2}{5}\)x = 60
\(\frac{3}{5}\) x=60
x = 100
Her heart rate was 100 beats per minute.

Eureka Math Grade 7 Module 1 Lesson 14 Exit Ticket Answer Key

Question 1.
A bicycle shop advertised all mountain bikes priced at a \(\frac{1}{3}\) discount.
a. What is the amount of the discount if the bicycle originally costs $327?
Answer:
\(\frac{1}{3}\) ($327)=$109 discount

b. What is the discount price of the bicycle?
Answer:
\(\frac{2}{3}\) ($327)=$218 discount price. Methods will vary.

c. Explain how you found your solution to part (b).
Answer:
Answers will vary.

Question 2.
A hand-held digital music player was marked down by \(\frac{1}{4}\) of the original price.
a. If the sales price is $128.00, what is the original price?
Answer:
x-\(\frac{1}{4}\) x=128
\(\frac{3}{4}\) x=128
x = 170.67
The original price is $170.67.

b. If the item was marked up by \(\frac{1}{2}\) before it was placed on the sales floor, what was the price that the store paid for the digital player?
Answer:
x + \(\frac{1}{2}\)x = 170.67
\(\frac{3}{2}\) x = 170.67
x = 113.78
The price that the store paid for the digital player was $113.78.

c. What is the difference between the discount price and the price that the store paid for the digital player?
Answer:
$128 – $113.78 = $14.22

Eureka Math Grade 7 Module 1 Lesson 15 Answer Key

Engage NY Eureka Math 7th Grade Module 1 Lesson 15 Answer Key

Eureka Math Grade 7 Module 1 Lesson 15 Example Answer Key

Example 1.
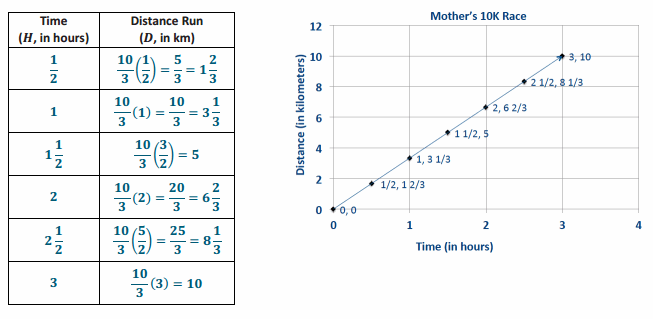
Mother’s 10K Race
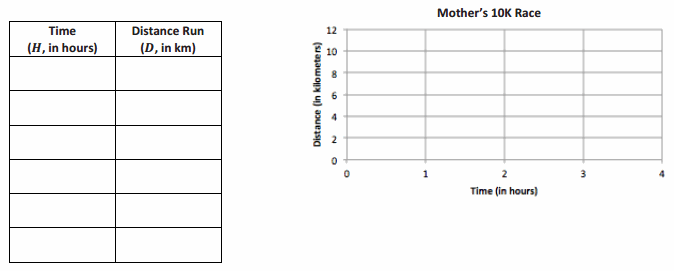
Sam’s mother has entered a 10K race. Sam and his family want to show their support for their mother, but they need to figure out where they should go along the race course. They also need to determine how long it will take her to run the race so that they will know when to meet her at the finish line. Previously, his mother ran a 5K race with a time of 1\(\frac{1}{2}\) hours. Assume Sam’s mother will run the same rate as the previous race in order to complete the chart.

→ Discuss with your partner: Can you find Sam’s mother’s average rate for the entire race based on her previous race time?
→ 3\(\frac{1}{3}\) km/h, or \(\frac{10}{3}\) km/h

Create a table that shows how far Sam’s mother has run after each half hour from the start of the race, and graph it on the coordinate plane to the right.
Engage NY Math 7th Grade Module 1 Lesson 15 Example Answer Key 0.1
Answer:
Engage NY Math 7th Grade Module 1 Lesson 15 Example Answer Key 1

a. What are some specific things you notice about this graph?
Answer:
It forms a line through the origin; it relates time (in hours) to the distance run (in kilometers); the line through the origin means that the values are proportional.

b. What is the connection between the table and the graph?
Answer:
The time (in hours) is on the horizontal axis, and the distance run (in kilometers) is on the vertical axis; the coordinates of the points on the line are the same as the pairs of numbers in the table.

c. What does the point (2, 6\(\frac{2}{3}\) ) represent in the context of this problem?
Answer:
After 2 hours, she has run 6 \(\frac{2}{3}\) km.

Discuss the responses with the class and draw a conclusion.
→ Write an equation that models the data in the chart. Record the student responses so that they can see all of the responses.
→ D = 3\(\frac{1}{3}\) H, where D represents the distance, and H represents the hours (or D=\(\frac{10}{3}\) H).

Example 2.
Gourmet Cooking
After taking a cooking class, you decide to try out your new cooking skills by preparing a meal for your family. You have chosen a recipe that uses gourmet mushrooms as the main ingredient. Using the graph below, complete the table of values and answer the following questions.
Engage NY Math 7th Grade Module 1 Lesson 15 Example Answer Key 50
Answer:
Engage NY Math 7th Grade Module 1 Lesson 15 Example Answer Key 51

a. Is this relationship proportional? How do you know from examining the graph?
Answer:
Yes, the relationship is proportional because the graph is a line that passes through the origin.

b. What is the unit rate for cost per pound?
Answer:
k = \(\frac{16}{2}\) = 8. The unit rate is 8.

c. Write an equation to model this data.
Answer:
C = 8w

d. What ordered pair represents the unit rate, and what does it mean?
Answer:
(1, 8) The unit rate is 8, which means that one pound of mushrooms costs $8.00.

e. What does the ordered pair (2, 16) mean in the context of this problem?
Answer:
(2, 16) This means 2 pounds of mushrooms cost $16.00.

f. If you could spend $10.00 on mushrooms, how many pounds could you buy?
Answer:
C = 8w; C = 10;(\(\frac{1}{8}\) )10 = (\(\frac{1}{8}\) )8w; 1 \(\frac{1}{4}\) = w. You can buy 1.25 pounds of mushrooms with $10.00.

g. What would be the cost of 30 pounds of mushrooms?
Answer:
C = 8w; w = 30; C = 8(30); C = $240

Eureka Math Grade 7 Module 1 Lesson 15 Problem Set Answer Key

Question 1.
Students are responsible for providing snacks and drinks for the Junior Beta Club Induction Reception. Susan and Myra were asked to provide the punch for the 100 students and family members who will attend the event. The chart below will help Susan and Myra determine the proportion of cranberry juice to sparkling water needed to make the punch. Complete the chart, graph the data, and write the equation that models this proportional relationship.
Eureka Math Grade 7 Module 1 Lesson 15 Problem Set Answer Key 83
Answer:
Eureka Math Grade 7 Module 1 Lesson 15 Problem Set Answer Key 84
C = \(\frac{4}{5}\) S, where C represents the number of cups of cranberry juice, and S represents the number of cups of sparkling water.

Question 2.
Jenny is a member of a summer swim team.
a. Using the graph, determine how many calories she burns in one minute.
Answer:
Jenny burns 100 calories every 15 minutes, so she burns 6 \(\frac{2}{3}\) calories each minute.

Eureka Math Grade 7 Module 1 Lesson 15 Problem Set Answer Key 85

b. Use the graph to determine the equation that models the number of calories Jenny burns within a certain number of minutes.
Answer:
C = 6 \(\frac{2}{3}\) t, where C represents the number of calories burned, and t represents the time she swims in minutes.

c. How long will it take her to burn off a 480-calorie smoothie that she had for breakfast?
Answer:
It will take Jenny 72 minutes of swimming to burn off the smoothie she had for breakfast.

Question 3.
Students in a world geography class want to determine the distances between cities in Europe. The map gives all distances in kilometers. The students want to determine the number of miles between towns so they can compare distances with a unit of measure with which they are already familiar. The graph below shows the relationship between a given number of kilometers and the corresponding number of miles.
Eureka Math Grade 7 Module 1 Lesson 15 Problem Set Answer Key 86
a. Find the constant of proportionality, or the rate of miles per kilometer, for this problem, and write the equation that models this relationship.
Answer:
The constant of proportionality is \(\frac{5}{8}\) .
The equation that models this situation is M=\(\frac{5}{8}\) K, where M represents the number of miles, and K represents the number of kilometers.

b. What is the distance in kilometers between towns that are 5 miles apart?
Answer:
The distance between towns that are 5 miles apart is 8 km.

c. Describe the steps you would take to determine the distance in miles between two towns that are 200 kilometers apart?
Answer:
Solve the equation M = \(\frac{5}{8}\) (200). To find the number of miles for 200 km, multiply 200 by \(\frac{5}{8}\).
200(\(\frac{5}{8}\)) = 125. The two towns are 125 miles apart.

Question 4.
During summer vacation, Lydie spent time with her grandmother picking blackberries. They decided to make blackberry jam for their family. Her grandmother said that you must cook the berries until they become juice and then combine the juice with the other ingredients to make the jam.
a. Use the table below to determine the constant of proportionality of cups of juice to cups of blackberries.
Eureka Math Grade 7 Module 1 Lesson 15 Problem Set Answer Key 90
Answer:
Eureka Math Grade 7 Module 1 Lesson 15 Problem Set Answer Key 91
k = \(\frac{1}{3}\) one cup of juice is produced when 3 cups of blackberries are cooked.

b. Write an equation that models the relationship between the number of cups of blackberries and the number of cups of juice.
Answer:
j = \(\frac{1}{3}\) b, where j represents the number of cups of juice, and b represents the number of cups of blackberries.

c. How many cups of juice were made from 12 cups of berries? How many cups of berries are needed to make 8 cups of juice?
Answer:
4 cups of juice are made from 12 cups of berries.
24 cups of berries are needed to make 8 cups of juice.

Eureka Math Grade 7 Module 1 Lesson 15 Exit Ticket Answer Key

Using the graph and its title:

Question 1.
Describe the relationship that the graph depicts.
Engage NY Math 7th Grade Module 1 Lesson 15 Exit Ticket Answer Key 60
Answer:
The graph shows that in 3 days the water rose to 4 inches. The water has risen at a constant rate. Therefore, the water has risen 1 \(\frac{1}{3}\) inches per day.

Question 2.
Identify two points on the line, and explain what they mean in the context of the problem.
Answer:
(6, 8) means that by the 6th day, the water rose 8 inches; (9, 12) means that by the 9th day, the water rose 12 inches.

Question 3.
What is the unit rate?
Answer:
The unit rate in inches per day is \(\frac{4}{3}\) .

Question 4.
What point represents the unit rate?
Answer:
The point that shows the unit rate is (1, 1 \(\frac{1}{3}\)).

Eureka Math Grade 7 Module 1 Lesson 10 Answer Key

Engage NY Eureka Math 7th Grade Module 1 Lesson 10 Answer Key

Eureka Math Grade 7 Module 1 Lesson 10 Example Answer Key

Example 1.
Grandma’s special chocolate chip cookie recipe, which yields 4 dozen cookies, calls for 3 cups of flour. Using this information, complete the chart:
Create a table comparing the amount of flour used to the amount of cookies.
Answer:
Engage NY Math 7th Grade Module 1 Lesson 10 Example Answer Key 1

Is the number of cookies proportional to the amount of flour used? Explain why or why not.
Answer:
Yes, because there exists a constant, \(\frac{4}{3}\) or 1\(\frac{1}{3}\), such that each measure of the cups of flour multiplied by the constant gives the corresponding measure of cookies.

What is the unit rate of cookies to flour (\(\frac{y}{x}\)), and what is the meaning in the context of the problem?
Answer:
1\(\frac{1}{3}\)
1\(\frac{1}{3}\) dozen cookies, or 16 cookies for 1 cup of flour

Model the relationship on a graph.
Engage NY Math 7th Grade Module 1 Lesson 10 Example Answer Key 2

Does the graph show the two quantities being proportional to each other? Explain.
Answer:
The points appear on a line that passes through the origin (0,0).

Write an equation that can be used to represent the relationship.
Answer:
D = 1\(\frac{1}{3}\)F, D = 1.\(\overline{3}\)F, or
D = \(\frac{4}{3}\)F
D represents the number of dozens of cookies.
F represents the number of cups of flour.

Example 2.
Below is a graph modeling the amount of sugar required to make Grandma’s special chocolate chip cookies.
Engage NY Math 7th Grade Module 1 Lesson 10 Example Answer Key 3
a. Record the coordinates from the graph. What do these ordered pairs represent?
Answer:
(0,0); 0 cups of sugar will result in 0 dozen cookies.
(2,3); 2 cups of sugar yield 3 dozen cookies.
(4,6); 4 cups of sugar yield 6 dozen cookies.
(8,12); 8 cups of sugar yield 12 dozen cookies.
(12,18); 12 cups of sugar yield 18 dozen cookies.
(16,24); 16 cups of sugar yield 24 dozen cookies.

b. Grandma has 1 remaining cup of sugar. How many dozen cookies will she be able to make? Plot the point on the graph above.
Answer:
1.5 dozen cookies

c. How many dozen cookies can Grandma make if she has no sugar? Can you graph this on the coordinate plane provided above? What do we call this point?
Answer:
(0,0); 0 cups of sugar will result in 0 dozen cookies. The point is called the origin.

Eureka Math Grade 7 Module 1 Lesson 10 Exercise Answer Key

Question 1.
The graph below shows the amount of time a person can shower with a certain amount of water.
Eureka Math Grade 7 Module 1 Lesson 10 Exercise Answer Key 20
a. Can you determine by looking at the graph whether the length of the shower is proportional to the number of gallons of water? Explain how you know.
Answer:
Yes, the quantities are proportional to each other since all points lie on a line that passes through the origin (0,0).

b. How long can a person shower with 15 gallons of water? How long can a person shower with 60 gallons of water?
Answer:
5 minutes; 20 minutes

c. What are the coordinates of point A? Describe point A in the context of the problem.
Answer:
(30,10). If there are 30 gallons of water, then a person can shower for 10 minutes.

d. Can you use the graph to identify the unit rate?
Answer:
Since the graph is a line that passes through (0,0) and (1,r), you can take a point on the graph, such as (15,5) and get \(\frac{1}{3}\).

e. Write the equation to represent the relationship between the number of gallons of water used and the length of a shower.
m = \(\frac{1}{3}\)g, where m represents the number of minutes, and g represents the number of gallons of water.

Question 2.
Your friend uses the equation C = 50P to find the total cost, C, for the number of people, P, entering a local amusement park.
a. Create a table and record the cost of entering the amusement park for several different-sized groups of people.
Answer:
Eureka Math Grade 7 Module 1 Lesson 10 Exercise Answer Key 21

b. Is the cost of admission proportional to the amount of people entering the amusement park? Explain why or why not.
Answer:
Yes. The cost of admission is proportional to the amount of people entering the amusement park because there exists a constant (50), such that each measure of the amount of people multiplied by the constant gives the corresponding measures of cost.

c. What is the unit rate, and what does it represent in the context of the situation?
Answer:
50; 1 person costs $50.

d. Sketch a graph to represent this relationship.
Answer:
Eureka Math Grade 7 Module 1 Lesson 10 Exercise Answer Key 22

e. What points must be on the graph of the line if the two quantities represented are proportional to each other? Explain why, and describe these points in the context of the problem.
Answer:
(0, 0) and (1, 50). If 0 people enter the park, then the cost would be $0. If 1 person enters the park, the cost would be $50. For every 1-unit increase along the horizontal axis, the change in the vertical distance is 50 units.

f. Would the point (5, 250) be on the graph? What does this point represent in the context of the situation?
Answer:
Yes, the point (5, 250) would be on the graph because 5(50) = 250. The meaning is that it would cost a total of $250 for 5 people to enter the amusement park.

Eureka Math Grade 7 Module 1 Lesson 10 Problem Set Answer Key

Question 1.
The graph to the right shows the relationship of the amount of time (in seconds) to the distance (in feet) run by a jaguar.
a. What does the point (5, 290) represent in the context of the situation?
Answer:
In 5 seconds, a jaguar can run 290 feet.

Eureka Math Grade 7 Module 1 Lesson 10 Problem Set Answer Key 25

b. What does the point (3, 174) represent in the context of the situation?
Answer:
A jaguar can run 174 feet in 3 seconds.

c. Is the distance run by the jaguar proportional to the time? Explain why or why not.
Answer:
Yes, the distance run by the jaguar is proportional to the time spent running because the graph shows a line that passes through the origin (0,0).

d. Write an equation to represent the distance run by the jaguar. Explain or model your reasoning.
Answer:
y = 58x
The constant of proportionality, or unit rate of \(\frac{y}{x}\), is 58 and can be substituted into the equation y = kx in place of k.

Question 2.
Championship t-shirts sell for $22 each.
a. What point(s) must be on the graph for the quantities to be proportional to each other?
Answer:
(0,0),(1,22)

b. What does the ordered pair (5,110) represent in the context of this problem?
Answer:
5 t-shirts will cost $110.

c. How many t-shirts were sold if you spent a total of $88?
Answer:
4; \(\frac{88}{22}\) = 4

Question 3.
The graph represents the total cost of renting a car. The cost of renting a car is a fixed amount each day, regardless of how many miles the car is driven.
a. What does the ordered pair (4, 250) represent?
Answer:
It would cost $250 to rent a car for 4 days.

Eureka Math Grade 7 Module 1 Lesson 10 Problem Set Answer Key 60

b. What would be the cost to rent the car for a week? Explain or model your reasoning.
Answer:
Since the unit rate is 62.5, the cost for a week would be 62.5(7)=$437.50.

Question 4.
Jackie is making a snack mix for a party. She is using cashews and peanuts. The table below shows the relationship of the number of packages of cashews she needs to the number of cans of peanuts she needs to make the mix.
Eureka Math Grade 7 Module 1 Lesson 10 Problem Set Answer Key 61
a. Write an equation to represent this relationship.
Answer:
y = 2x, where x represents the number of packages of cashews, and y represents the number of cans of peanuts.

b. Describe the ordered pair (12,24) in the context of the problem.
Answer:
In the mixture, you will need 12 packages of cashews and 24 cans of peanuts.

Question 5.
The following table shows the amount of candy and price paid.
Eureka Math Grade 7 Module 1 Lesson 10 Problem Set Answer Key 62
a. Is the cost of the candy proportional to the amount of candy?
Answer:
Yes, because there exists a constant, 2.5, such that each measure of the amount of candy multiplied by the constant gives the corresponding measure of cost.

b. Write an equation to illustrate the relationship between the amount of candy and the cost.
Answer:
y = 2.5x

c. Using the equation, predict how much it will cost for 12 pounds of candy.
Answer:
2.5(12)=$30

d. What is the maximum amount of candy you can buy with $60?
Answer:
\(\frac{60}{2.5}\) = 24 pounds

e. Graph the relationship
Eureka Math Grade 7 Module 1 Lesson 10 Problem Set Answer Key 63

Eureka Math Grade 7 Module 1 Lesson 10 Exit Ticket Answer Key

Great Rapids White Water Rafting Company rents rafts for $125 per hour. Explain why the point (0, 0) and (1, 125) are on the graph of the relationship and what these points mean in the context of the problem.
Answer:
Every graph of a proportional relationship must include the points (0,0) and (1,r). The point (0,0) is on the graph because 0 can be multiplied by the constant to determine the corresponding value of 0. The point (1,125) is on the graph because 125 is the unit rate. On the graph, for every 1 unit change on the horizontal axis, the vertical axis will change by 125 units. The point (0, 0) means 0 hours of renting a raft would cost $0, and (1, 125) means 1 hour of renting the raft would cost $125.

Eureka Math Grade 7 Module 1 Lesson 6 Answer Key

Engage NY Eureka Math 7th Grade Module 1 Lesson 6 Answer Key

Eureka Math Grade 7 Module 1 Lesson 6 Poster Layout Answer Key

Take notes and answer the following questions:

  • Were there any differences found in groups that had the same ratios?
  • Did you notice any common mistakes? How might they be fixed?
  • Were there any groups that stood out by representing their problem and findings exceptionally clearly?

Poster 1:

Poster 2:

Poster 3:

Poster 4:

Poster 5:

Poster 6:

Poster 7:

Poster 8:

Note about Lesson Summary:
Answer:
Group 1 to 8
Problem:
A local frozen yogurt shop is known for their monster sundaes. Create a table, and then graph and explain if the quantities are proportional to each other.
Table:
Eureka Math Grade 7 Module 1 Lesson 6 Gallery Walk Answer Key 1
Graph:
Eureka Math Grade 7 Module 1 Lesson 6 Poster Layout Answer Key 30
Explanation:
Although the points appear on a line, the quantities are not proportional to each other because the line does not go through the origin. Each topping does not have the same unit cost.

Group 2 and 7
Problem:
The school library receives money for every book sold at the school’s book fair. Create a table, and then graph and explain if the quantities are proportional to each other.
Table:
Eureka Math Grade 7 Module 1 Lesson 6 Poster Layout Answer Key 31
Graph:
Eureka Math Grade 7 Module 1 Lesson 6 Poster Layout Answer Key 32
Explanation:
The quantities are proportional to each other because the points appear on a line that goes through the origin. Each book sold brings in $5.00, no matter how many books are sold.

Group 3 and 6
Problem:
Your uncle just bought a hybrid car and wants to take you and your siblings camping. Create a table, and then graph and explain if the quantities are proportional to each other.
Table:
Eureka Math Grade 7 Module 1 Lesson 6 Poster Layout Answer Key 33
Graph:
Eureka Math Grade 7 Module 1 Lesson 6 Poster Layout Answer Key 34
Explanation:
The graph is not represented by a line passing through the origin, so the quantities are not proportional to each other. The number of gallons of gas varies depending on how fast or slow the car is driven.

Group 4 and 5
Problem:
For a science project, Eli decided to study colonies of mold. He observed a piece of bread that was molding. Create a table, and then graph and explain if the quantities are proportional to each other.
Table:
Eureka Math Grade 7 Module 1 Lesson 6 Poster Layout Answer Key 35
Graph:
Eureka Math Grade 7 Module 1 Lesson 6 Poster Layout Answer Key 36
Explanation:
Although the graph looks as though it goes through the origin, the quantities are not proportional to each other because the points do not appear on a line. Each day does not produce the same amount of colonies as the other days.

Eureka Math Grade 7 Module 1 Lesson 6 Problem Set Answer Key

Problem:
Sally’s aunt put money in a savings account for her on the day Sally was born. The savings account pays interest for keeping her money in the bank. The ratios below represent the number of years to the amount of money in the savings account.

  • After one year, the interest accumulated, and the total in Sally’s account was $312.
  • After three years, the total was $340. After six years, the total was $380.
  • After nine years, the total was $430. After 12 years, the total amount in Sally’s savings account was $480.

Using the same four-fold method from class, create a table and a graph, and explain whether the amount of money accumulated and the time elapsed are proportional to each other. Use your table and graph to support your reasoning.
Graph:
Eureka Math Grade 7 Module 1 Lesson 6 Problem Set Answer Key 50
Table:
Eureka Math Grade 7 Module 1 Lesson 6 Problem Set Answer Key 51
Explanation:
The graph is not a graph of a proportional relationship because, although the data appears to be a line, it is not a line that goes through the origin. The amount of interest collected is not the same every year.

Eureka Math Grade 7 Module 1 Lesson 6 Exit Ticket Answer Key

Question 1.
Which graphs in the art gallery walk represented proportional relationships, and which did not? List the group number.
Engage NY Math 7th Grade Module 1 Lesson 6 Exit Ticket Answer Key 20
Answer:
Engage NY Math 7th Grade Module 1 Lesson 6 Exit Ticket Answer Key 21

Question 2.
What are the characteristics of the graphs that represent proportional relationships?
Answer:
Graphs of groups 2 and 7 appear on a line and go through the origin.

Question 3.
For the graphs representing proportional relationships, what does (0,0) mean in the context of the situation?
Answer:
For zero books sold, the library received zero dollars in donations.

Eureka Math Grade 7 Module 1 Lesson 8 Answer Key

Engage NY Eureka Math 7th Grade Module 1 Lesson 8 Answer Key

Eureka Math Grade 7 Module 1 Lesson 8 Example Answer Key

Write an equation that will model the real-world situation

Example 1.
Do We Have Enough Gas to Make It to the Gas Station?
Answer:
Your mother has accelerated onto the interstate beginning a long road trip, and you notice that the low fuel light is on, indicating that there is a half a gallon left in the gas tank. The nearest gas station is 26 miles away. Your mother keeps a log where she records the mileage and the number of gallons purchased each time she fills up the tank. Use the information in the table below to determine whether you will make it to the gas station before the gas runs out. You know that if you can determine the amount of gas that her car consumes in a particular number of miles, then you can determine whether or not you can make it to the next gas station.
Eureka Math Grade 7 Module 1 Lesson 8 Example Answer Key 1
a. Find the constant of proportionality, and explain what it represents in this situation.
Answer:
Eureka Math Grade 7 Module 1 Lesson 8 Example Answer Key 2
The constant of proportionality, k, is 28. The car travels 28 miles for every one gallon of gas.

b. Write equation(s) that will relate the miles driven to the number of gallons of gas.
Answer:
y = 28x or m = 28g

c. Knowing that there is a half gallon left in the gas tank when the light comes on, will she make it to the nearest gas station? Explain why or why not.
Answer:
No, she will not make it because she gets 28 miles to one gallon. Since she has \(\frac{1}{2}\) gallon remaining in the gas tank, she can travel 14 miles. Since the nearest gas station is 26 miles away, she will not have enough gas.

d. Using the equation found in part (b), determine how far your mother can travel on 18 gallons of gas. Solve the problem in two ways: once using the constant of proportionality and once using an equation.
Answer:
Using arithmetic: 28(18) = 504
Using an equation: m = 28g – Use substitution to replace the g (gallons of gas) with 18.
m = 28(18) – This is the same as multiplying by the constant of proportionality.
m = 504
Your mother can travel 504 miles on 18 gallons of gas.

e. Using the constant of proportionality, and then the equation found in part (b), determine how many gallons of gas would be needed to travel 750 miles.
Using arithmetic: \(\frac{750}{28}\) = 26.8
Using algebra:
m = 28g
750 = 28g
→ Use substitution to replace the m (miles driven) with 750.
→ This equation demonstrates dividing by the constant of proportionality or using the multiplicative inverse to solve the equation.
(\(\frac{1}{28}\))750 = (\(\frac{1}{28}\))28g
26.8 = 1g
26.8 (rounded to the nearest tenth) gallons would be needed to drive 750 miles.

Example 2:
Andrea’s Portraits
Andrea is a street artist in New Orleans. She draws caricatures (cartoon-like portraits) of tourists. People have their portrait drawn and then come back later to pick it up from her. The graph below shows the relationship between the number of portraits she draws and the amount of time in hours she needs to draw the portraits.
Eureka Math Grade 7 Module 1 Lesson 8 Example Answer Key 50
a. Write several ordered pairs from the graph, and explain what each ordered pair means in the context of this graph.
Answer:
(4,6) means that in 4 hours, she can draw 6 portraits.
(6,9) means that in 6 hours, she can draw 9 portraits.
(2,3) means that in 2 hours, she can draw 3 portraits.
(1,1\(\frac{1}{2}\)) means that in 1 hour, she can draw 1\(\frac{1}{2}\) portraits.

b. Write several equations that would relate the number of portraits drawn to the time spent drawing the portraits.
Answer:
Eureka Math Grade 7 Module 1 Lesson 8 Example Answer Key 51

c. Determine the constant of proportionality, and explain what it means in this situation.
Answer:
The constant of proportionality is \(\frac{3}{2}\), which means that Andrea can draw 3 portraits in 2 hours or can complete 1 \(\frac{1}{2}\) portraits in 1 hour.

Tell students that these ordered pairs can be used to generate the constant of proportionality, and write the equation for this situation. Remember that = \(\frac{y}{x}\).

Eureka Math Grade 7 Module 1 Lesson 8 Problem Set Answer Key

Write an equation that will model the proportional relationship given in each real-world situation.

Question 1.
There are 3 cans that store 9 tennis balls. Consider the number of balls per can.
a. Find the constant of proportionality for this situation.
Answer:
Eureka Math Grade 7 Module 1 Lesson 8 Problem Set Answer Key 60
The constant of proportionality is 3.

b. Write an equation to represent the relationship.
Answer:
B = 3C

Question 2.
In 25 minutes, Li can run 10 laps around the track. Determine the number of laps she can run per minute.
a. Find the constant of proportionality in this situation.
Answer:
Eureka Math Grade 7 Module 1 Lesson 8 Problem Set Answer Key 61
The constant of proportionality is \(\frac{2}{5}\).

b. Write an equation to represent the relationship.
Answer:
L = \(\frac{2}{5}\) M

Question 3.
Jennifer is shopping with her mother. They pay $2 per pound for tomatoes at the vegetable stand.
a. Find the constant of proportionality in this situation.
Eureka Math Grade 7 Module 1 Lesson 8 Problem Set Answer Key 62
The constant of proportionality is 2.

b. Write an equation to represent the relationship.
Answer:
D = 2P

Question 4.
It costs $15 to send 3 packages through a certain shipping company. Consider the number of packages per dollar.
a. Find the constant of proportionality for this situation.
Answer:
Eureka Math Grade 7 Module 1 Lesson 8 Problem Set Answer Key 63
The constant of proportionality is \(\frac{1}{5}\).

b. Write an equation to represent the relationship.
Answer:
P = \(\frac{1}{5}\) D

Question 5.
On average, Susan downloads 60 songs per month. An online music vendor sells package prices for songs that can be downloaded onto personal digital devices. The graph below shows the package prices for the most popular promotions. Susan wants to know if she should buy her music from this company or pay a flat fee of $58.00 per month offered by another company. Which is the better buy?
Eureka Math Grade 7 Module 1 Lesson 8 Problem Set Answer Key 64
Answer:
Eureka Math Grade 7 Module 1 Lesson 8 Problem Set Answer Key 65

a. Find the constant of proportionality for this situation.
Answer:
The constant of proportionality, k, is 0.9.

b. Write an equation to represent the relationship.
Answer:
C = 0.9S

c. Use your equation to find the answer to Susan’s question above. Justify your answer with mathematical evidence and a written explanation.
Answer:
Compare the flat fee of $58 per month to $0.90 per song. If C = 0.9S and we substitute S with 60 (the number of songs), then the result is C = 0.9(60) = 54. She would spend $54 on songs if she bought 60 songs. If she maintains the same number of songs, the charge of $0.90 per song would be cheaper than the flat fee of $58 per month.

Question 6.
Allison’s middle school team has designed t-shirts containing their team name and color. Allison and her friend Nicole have volunteered to call local stores to get an estimate on the total cost of purchasing t-shirts. Print-o-Rama charges a set-up fee, as well as a fixed amount for each shirt ordered. The total cost is shown below for the given number of shirts. Value T’s and More charges $8 per shirt. Which company should they use?
Eureka Math Grade 7 Module 1 Lesson 8 Problem Set Answer Key 67
a. Does either pricing model represent a proportional relationship between the quantity of t-shirts and the total cost? Explain.
Answer:
The unit rate of \(\frac{y}{x}\) for Print-o-Rama is not constant. The graph for Value T’s and More is proportional since the ratios are equivalent (8) and the graph shows a line through the origin.

b. Write an equation relating cost and shirts for Value T’s and More.
Answer:
C = 8S for Value T’s and More

c. What is the constant of proportionality of Value T’s and More? What does it represent?
Answer:
8; the cost of one shirt is $8.

d. How much is Print-o-Rama’s set-up fee?
Answer:
The set-up fee is $25.

e. If you need to purchase 90 shirts, write a proposal to your teacher indicating which company the team should use. Be sure to support your choice. Determine the number of shirts that you need for your team.
Answer:
Since we plan on a purchase of 90 shirts, we should choose Print-o-Rama.
Print-o-Rama: C = 7S + 25; C = 7(90) + 25; C = 655
Value T’s and More: C = 8S; C = 8(90); C = 720

Eureka Math Grade 7 Module 1 Lesson 8 Exit Ticket Answer Key

John and Amber work at an ice cream shop. The hours worked and wages earned are given for each person.
Eureka Math Grade 7 Module 1 Lesson 8 Exit Ticket Answer Key 52
Answer:
Eureka Math Grade 7 Module 1 Lesson 8 Exit Ticket Answer Key 53

Question 1.
Determine if John’s wages are proportional to time. If they are, determine the unit rate of \(\frac{y}{x}\). If not, explain why they are not.
Answer:
Yes, the unit rate is 9. The collection of ratios is equivalent.

Question 2.
Determine if Amber’s wages are proportional to time. If they are, determine the unit rate of \(\frac{y}{x}\). If not, explain why they are not.
Answer:
Yes, the unit rate is 8. The collection of ratios is equivalent.

Question 3.
Write an equation for both John and Amber that models the relationship between their wage and the time they worked. Identify the constant of proportionality for each. Explain what it means in the context of the situation.
Answer:
John: w = 9h; the constant of proportionality is 9; John earns $9 for every hour he works.
Amber: w = 8h; the constant of proportionality is 8; Amber earns $8 for every hour she works.

Question 4.
How much would each worker make after working 10 hours? Who will earn more money?
After 10 hours, John will earn $90 because 10 hours is the value of the independent variable, which should be multiplied by k, the constant of proportionality. w = 9h; w = 9(10); w = 90. After 10 hours, Amber will earn $80 because her equation is w = 8h; w = 8(10); w = 80. John will earn more money than Amber in the same amount of time.

Question 5.
How long will it take each worker to earn $50?
Answer:
To determine how long it will take John to earn $50, the dependent value will be divided by 9, the constant of proportionality. Algebraically, this can be shown as a one-step equation: 50 = 9h; (\(\frac{1}{9}\))50 = (\(\frac{1}{9}\))9h;
\(\frac{50}{9}\) = 1 h; 5.56 = h (round to the nearest hundredth). It will take John nearly 6 hours to earn $50. To find how long it will take Amber to earn $50, divide by 8, the constant of proportionality. 50=8h;
(\(\frac{1}{8}\))50 = (\(\frac{1}{8}\))8h; \(\frac{50}{8}\) = 1h; 6.25 = h. It will take Amber 6.25 hours to earn $50.

Eureka Math Grade 7 Module 1 Lesson 7 Answer Key

Engage NY Eureka Math 7th Grade Module 1 Lesson 7 Answer Key

Eureka Math Grade 7 Module 1 Lesson 7 Example Answer Key

Example 1.
National Forest Deer Population in Danger?
Wildlife conservationists are concerned that the deer population might not be constant across the National Forest. The scientists found that there were 144 deer in a 16-square-mile area of the forest. In another part of the forest, conservationists counted 117 deer in a 13-square-mile area. Yet a third conservationist counted 216 deer in a 24-square-mile plot of the forest. Do conservationists need to be worried?

a. Why does it matter if the deer population is not constant in a certain area of the National Forest?
Answer:
Have students generate as many theories as possible (e.g., food supply, overpopulation, damage to land).

b. What is the population density of deer per square mile?
Answer:
See table below.
Encourage students to make a chart to organize the data from the problem, and then explicitly model finding the constant of proportionality. Students have already found unit rate in earlier lessons but have not identified it as the constant of proportionality.
→ When we find the number of deer per 1 square mile, what is this called?
→ Unit rate.

→ When we look at the relationship between square miles and number of deer in the table below, how do we know if the relationship is proportional?
→ The square miles are always multiplied by the same value, 9 in this case.
Engage NY Math 7th Grade Module 1 Lesson 7 Example Answer Key 80
→ We call this constant (or same) value the constant of proportionality.
→ So, the number of deer per square mile is 9, and the constant of proportionality is 9. Is that a coincidence, or will the unit rate of \(\frac{y}{x}\) and the constant of proportionality always be the same?

Allow for comments or observations, but leave a lingering question for now.
→ We could add the unit rate to the table so that we have 1 square mile in the first column and 9 in the second column. (Add this to the table for students to see.) Does that help to guide your decision about the relationship between the unit rate of \(\frac{y}{x}\) and the constant of proportionality? We will see if your hypothesis remains true as we move through more examples.

The unit rate of deer per 1 square mile is 9.
Constant of Proportionality:
Answer:
k = 9
Explain the meaning of the constant of proportionality in this problem:
Answer:
There are 9 deer for every 1 square mile of forest.

c. Use the unit rate of deer per square mile (or \(\frac{y}{x}\)) to determine how many deer there are for every 207 square miles.
Answer:
9(207)=1,863
There are 1,863 deer for every 207 square miles.

d. Use the unit rate to determine the number of square miles in which you would find 486 deer.
Answer:
\(\frac{486}{9}\) = 54
In 54 square miles, you would find 486 deer.
→ Based upon the discussion of the questions above, answer the question: Do conservationists need to be worried? Be sure to support your answer with mathematical reasoning about rate and unit rate.

You Need WHAT?
While working on Example 2, encourage students to make a chart to organize the data from the problem.

Example 2.
Brandon came home from school and informed his mother that he had volunteered to make cookies for his entire grade level. He needs 3 cookies for each of the 96 students in seventh grade. Unfortunately, he needs the cookies the very next day! Brandon and his mother determined that they can fit 36 cookies on two cookie sheets.
a. Is the number of cookies proportional to the number of cookie sheets used in baking? Create a table that shows data for the number of sheets needed for the total number of cookies baked.
Table:
Engage NY Math 7th Grade Module 1 Lesson 7 Example Answer Key 85
The unit rate of \(\frac{y}{x}\) is __.
Answer:
Constant of Proportionality:
Answer:
k = 18

Explain the meaning of the constant of proportionality in this problem:
Answer:
There are 18 cookies per 1 cookie sheet.

b. It takes 2 hours to bake 8 sheets of cookies. If Brandon and his mother begin baking at 4:00 p.m., when will they finish baking the cookies?
Answer:
96 students (3 cookies per student) =288 cookies
\(\frac{288 \text { cookies }}{18 \text { cookies per sheet }}\) = 16 sheets of cookies
If it takes 2 hours to bake 8 sheets, it will take 4 hours to bake 16 sheets of cookies. They will finish baking at 8:00 p.m

Example 3.
French Class cooking
Suzette and Margo want to prepare crêpes for all of the students in their French class. A recipe makes 20 crêpes with a certain amount of flour, milk, and 2 eggs. The girls already know that they have plenty of flour and milk to make 50 crêpes, but they need to determine the number of eggs they will need for the recipe because they are not sure they have enough.

a. Considering the amount of eggs necessary to make the crêpes, what is the constant of proportionality?
Answer:
Engage NY Math 7th Grade Module 1 Lesson 7 Example Answer Key 88
The constant of proportionality is \(\frac{1}{10}\).

b. What does the constant or proportionality mean in the context of this problem?
Answer:
One egg is needed to make 10 crepes.

c. How many eggs are needed to make 50 crepes?
Answer:
50(\(\frac{1}{10}\)) = 5
Five eggs are needed to make 50 crepes.

Eureka Math Grade 7 Module 1 Lesson 7 Problem Set Answer Key

For each of the following problems, define the constant of proportionality to answer the follow-up question.

Question 1.
Bananas are $0.59/pound.

a. What is the constant of proportionality, or k?
Answer:
The constant of proportionality, k, is 0.59.

b. How much will 25 pounds of bananas cost?
Answer:
25 lb.($0.59/lb.)=$14.75

Question 2.
The dry cleaning fee for 3 pairs of pants is $18.
a. What is the constant of proportionality?
Answer:
\(\frac{18}{3}\) = 6, so k is 6.

b. How much will the dry cleaner charge for 11 pairs of pants?
Answer:
6(11) = 66
The dry cleaner would charge $66.

Question 3.
For every $5 that Micah saves, his parents give him $10.
a. What is the constant of proportionality?
Answer:
\(\frac{10}{5}\) = 2, so k is 2.

b. If Micah saves $150, how much money will his parents give him?
Answer:
2($150)=$300

Question 4.
Each school year, the seventh graders who study Life Science participate in a special field trip to the city zoo. In 2010, the school paid $1,260 for 84 students to enter the zoo. In 2011, the school paid $1,050 for 70 students to enter the zoo. In 2012, the school paid $1,395 for 93 students to enter the zoo.
a. Is the price the school pays each year in entrance fees proportional to the number of students entering the zoo?
Answer:
Eureka Math Grade 7 Module 1 Lesson 7 Problem Set Answer Key 90

b. Explain why or why not.
Answer:
The price is proportional to the number of students because the ratio of the entrance fee paid per student was the same.
\(\frac{1260}{84}\) = 15

c. Identify the constant of proportionality and explain what it means in the context of this situation.
Answer:
The constant of proportionality (k) is 15. This represents the price per student.

d. What would the school pay if 120 students entered the zoo?
Answer:
120 “students” ($15″ per student” )=$1800

e. How many students would enter the zoo if the school paid $1,425?
Answer:
\(\frac{1425}{15}\) = 95 students

Eureka Math Grade 7 Module 1 Lesson 7 Exit Ticket Answer Key

Susan and John are buying cold drinks for a neighborhood picnic. Each person is expected to drink one can of soda. Susan says that if you multiply the unit price for a can of soda by the number of people attending the picnic, you will be able to determine the total cost of the soda. John says that if you divide the cost of a 12-pack of soda by the number of sodas, you will determine the total cost of the sodas. Who is right, and why?
Answer:
Susan is correct. The table below shows that if you multiply the unit price, say 0.50, by the number of people, say 12, you will determine the total cost of the soda. I created a table to model the proportional relationship. I used a unit price of 0.50 to make the comparison.
Susan

Number of People23412
Total Cost of Soda (in dollars)11.5026

I used the same values to compare to John. \(\frac{\text { total cost }}{12 \text { people }}\)= ?
The total cost is $6, and there 12 people. \(\frac{6}{12}\) = \(\frac{1}{2}\), which is $0.50 or the unit price, not the total cost.