Are you looking for the best material to score top in the exams? Then, you are in the right place. HMH Go Math Grade 6 Answer Key Chapter 2 Fractions and Decimals is the best material for the 6th standard students. Here you can find the explanations for each and every question in different methods. Refer to Go Math Grade 6 Chapter 2 Fractions and Decimals Solution Key to learn the concepts of the chapter. So, Download HMH Go Math Grade 6 Answer Key Chapter 2 Fractions and Decimals for free.
Download Go Math Grade 6 Chapter 2 Fractions and Decimals Answer Key PDF
The Go Math Grade 6 Chapter 2 Fractions and Decimals Solution Key consists of various topics like compare and order fractions and decimals, multiply fractions, Divide Fractions, Model Mixed Number Division, etc. We have provided detailed explanations in simple methods here. All the solutions are prepared according to the topics in the Fractions and Decimals Chapter. So, access the links and start your preparation for the exams.
Lesson 1: Fractions and Decimals
Lesson 2: Compare and Order Fractions and Decimals
Lesson 3: Multiply Fractions
Lesson 4: Simplify Factors
Mid-Chapter Checkpoint
Lesson 5: Investigate • Model Fraction Division
Lesson 6: Estimate Quotients
Lesson 7: Divide Fractions
Lesson 8: Investigate • Model Mixed Number Division
Lesson 9: Divide Mixed Numbers
Lesson 10: Problem Solving • Fraction Operations
Chapter 2 Review/Test
Share and Show – Page No. 71
Write as a fraction or as a mixed number in simplest form.
Question 1.
95.5
_____ \(\frac{□}{□}\)
Answer:
\(\frac{1}{2}\)
Explanation:
95.5
95.5 is 95 ones and 5 tenths.
5 tenths = \(\frac{5}{10}\)
Simplify using the GCF.
The GCF of 5 and 10 is 10.
Divide the numerator and the denominator by 10
\(\frac{5 ÷ 10}{10 ÷ 10}\) = \(\frac{1}{2}\)
Question 2.
0.6
\(\frac{□}{□}\)
Answer:
\(\frac{3}{5}\)
Explanation:
0.6
6 tenths = \(\frac{6}{10}\)
Simplify using the GCF.
The GCF of 6 and 10 is 2.
Divide the numerator and the denominator by 10
\(\frac{6 ÷ 2}{10 ÷ 2}\) = \(\frac{3}{5}\)
Question 3.
5.75
_____ \(\frac{□}{□}\)
Answer:
5\(\frac{3}{4}\)
Explanation:
5.75 is 5 ones and 75 hundredths.
75 hundredths = \(\frac{75}{100}\)
Simplify using the GCF.
The GCF of 75 and 100 is 25.
Divide the numerator and the denominator by 25
5\(\frac{75 ÷ 25}{100 ÷ 25}\) = 5\(\frac{3}{4}\)
Write as a decimal.
Question 4.
\(\frac{7}{8}\)
_____
Answer:
0.875
Explanation:
Use division to rename the fraction part as a decimal.
7/8 = 0.875
The quotient has 3 decimal places.
Add the whole number to the decimal.
0 + 0.875 = 0.875.
So, \(\frac{7}{8}\) = 0.875
Question 5.
\(\frac{13}{20}\)
_____
Answer:
0.65
Explanation:
Use division to rename the fraction part as a decimal.
\(\frac{13}{20}\) = 0.65
The quotient has 2 decimal places.
Add the whole number to the decimal.
0 + 0.65 = 0.65.
So, \(\frac{13}{20}\) = 0.65
Question 6.
\(\frac{3}{25}\)
_____
Answer:
0.12
Explanation:
Use division to rename the fraction part as a decimal.
\(\frac{3}{25}\) = 0.12
The quotient has 2 decimal places.
Add the whole number to the decimal.
0 + 0.12 = 0.12.
So, \(\frac{3}{25}\)= 0.12
On Your Own
Write as a fraction or as a mixed number in simplest form.
Question 7.
0.27
\(\frac{□}{□}\)
Answer:
\(\frac{27}{100}\)
Explanation:
0.27 is 0 ones and 27 hundredths.
27 hundredths = \(\frac{27}{100}\)
Simplify using the GCF.
The GCF of 27 and 100 is 1.
Divide the numerator and the denominator by 1
\(\frac{27 ÷ 1}{100 ÷ 1}\) = \(\frac{27}{100}\)
Question 8.
0.055
\(\frac{□}{□}\)
Answer:
\(\frac{11}{200}\)
Explanation:
0.055 is 0 ones and 55 thousandths.
55 thousandths = \(\frac{55}{1000}\)
Simplify using the GCF.
The GCF of 55 and 1000 is 5.
Divide the numerator and the denominator by 5
\(\frac{55 ÷ 5}{1000 ÷ 5}\) = \(\frac{11}{200}\)
Question 9.
2.45
_____ \(\frac{□}{□}\)
Answer:
\(\frac{9}{20}\)
Explanation:
2.45 is 2 ones and 45 hundredths.
45 hundredths = \(\frac{45}{100}\)
Simplify using the GCF.
The GCF of 45 and 100 is 5.
Divide the numerator and the denominator by 1
\(\frac{45 ÷ 5}{100 ÷ 5}\) = \(\frac{9}{20}\)
Write as a decimal.
Question 10.
\(\frac{3}{8}\)
_____
Answer:
0.375
Explanation:
Use division to rename the fraction part as a decimal.
\(\frac{3}{8}\) = 0.375
The quotient has 3 decimal places.
Add the whole number to the decimal.
0 + 0.375 = 0.375.
So, \(\frac{3}{8}\) = 0.375
Question 11.
3 \(\frac{1}{5}\)
_____
Answer:
3.2
Explanation:
Use division to rename the fraction part as a decimal.
\(\frac{1}{5}\) = 0.2
The quotient has 1 decimal place.
Add the whole number to the decimal.
3 + 0.2 = 3.2.
So, 3 \(\frac{1}{5}\) = 3.2
Question 12.
2 \(\frac{11}{20}\)
_____
Answer:
2.55
Explanation:
Use division to rename the fraction part as a decimal.
\(\frac{11}{20}\) = 0.55
The quotient has 2 decimal places.
Add the whole number to the decimal.
2 + 0.55 = 2.55.
So, 2 \(\frac{11}{20}\) = 2.55
Identify a decimal and a fraction in simplest form for the point.

Question 13.
Point A
Type below:
__________
Answer:
0.2
Question 14.
Point B
Type below:
__________
Answer:
0.9
Explanation:
Point B is between 0.8 and 1.0. Every point is separated by 0.1. So, Point B is at 0.9
Question 15.
Point C
Type below:
__________
Answer:
0.5
Explanation:
Point C is between 0.4 and 0.6. Every point is separated by 0.1. So, Point C is at 0.5
Question 16.
Point D
Type below:
__________
Answer:
0.1
Explanation:
Point D is between 0 and 0.2. Every point is separated by 0.1. So, Point D is at 0.1
Problem Solving + Applications – Page No. 72
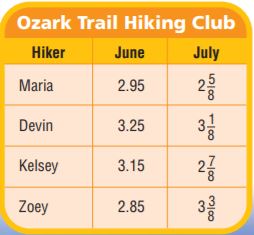
Use the table for 17 and 18.
Question 17.
Members of the Ozark Trail Hiking Club hiked a steep section of the trail in June and July. The table shows the distances club members hiked in miles. Write Maria’s July distance as a decimal.
_____ miles
Answer:
2.625 miles
Explanation:
Maria’s July distance = 2 \(\frac{5}{8}\)
Use division to rename the fraction part as a decimal.
\(\frac{5}{8}\) = 0.625
The quotient has 3 decimal places.
Add the whole number to the decimal.
2 + 0.625 = 2.625.
2 \(\frac{5}{8}\) = 2.625
Question 18.
How much farther did Zoey hike in June and July than Maria hiked in June and July? Explain how you found your answer.
_____ miles
Answer:
0.7 miles
Explanation:
Maria: June = 2.95, July = 2 \(\frac{5}{8}\) = 2.58
Zoey: June = 2.85, July = 3 \(\frac{3}{8}\) = 3.38
[2.85 + 3.38] – [2.95 + 2.58] = 0.7 miles
Question 19.
What’s the Error? Tabitha’s hiking distance in July was 2 \(\frac{1}{5}\) miles. She wrote the distance as 2.02 miles. What error did she make?
Type below:
__________
Answer:
Tabitha’s hiking distance in July was 2 \(\frac{1}{5}\) miles.
2 \(\frac{1}{5}\)
Use division to rename the fraction part as a decimal.
\(\frac{1}{5}\) = 0.2
The quotient has 1 decimal place.
Add the whole number to the decimal.
2 + 0.2 = 2.2.
2 \(\frac{1}{5}\) = 2.2
She wrote the distance as 2.02 miles in mistake.
Question 20.
Use Patterns Write \(\frac{3}{8}, \frac{4}{8}, \text { and } \frac{5}{8}\) as decimals. What pattern do you see? Use the pattern to predict the decimal form of \(\frac{6}{8}\) and \(\frac{7}{8}\).
Type below:
__________
Answer:
\(\frac{3}{8}, \frac{4}{8}, \text { and } \frac{5}{8}\) as decimals.
0.375, 0.5, 0.625
Each decimal is separated by 0.125.
So, 6/8 = 0.625 + 0.125 = 0.75
7/8 = 0.75 + 0.125 = 0.875
Question 21.
Identify a decimal and a fraction in simplest form for the point.

Type below:
__________
Answer:
Point A: 0.5
Point B: 0.7
Point C: 0.3
Point D: 0.8
Explanation:
Every point is differentiated by 0.1 distance.
The A is between 0.4 and 0.6 which is 0.5
The B is between 0.6 and 0.8 which is 0.7
The C is between 0.1 and 0.6 which is 0.53
Fractions and Decimals – Page No. 73
Write as a fraction or as a mixed number in simplest form.
Question 1.
0.52
\(\frac{□}{□}\)
Answer:
\(\frac{13}{25}\)
Explanation:
0.52
0.52 is 52 hundredths.
52 hundredths = \(\frac{52}{100}\)
Simplify using the GCF.
The GCF of 52 and 100 is 4.
Divide the numerator and the denominator by 4
\(\frac{52 ÷ 4}{100 ÷ 4}\) = \(\frac{13}{25}\)
Question 2.
0.02
\(\frac{□}{□}\)
Answer:
\(\frac{1}{50}\)
Explanation:
0.02
0.02 is 2 hundredths.
2 hundredths = \(\frac{2}{100}\)
Simplify using the GCF.
The GCF of 2 and 100 is 2.
Divide the numerator and the denominator by 2
\(\frac{2 ÷ 2}{100 ÷ 2}\) = \(\frac{1}{50}\)
Question 3.
4.8
______ \(\frac{□}{□}\)
Answer:
\(\frac{4}{5}\)
Explanation:
4.8
4.8 is 4 ones and 8 tenths.
8 tenths = \(\frac{8}{10}\)
Simplify using the GCF.
The GCF of 8 and 10 is 2.
Divide the numerator and the denominator by 2
\(\frac{8 ÷ 2}{10 ÷ 2}\) = \(\frac{4}{5}\)
Question 4.
6.025
______ \(\frac{□}{□}\)
Answer:
\(\frac{1}{40}\)
Explanation:
6.025 is 6 ones and 25 thousandths.
25 thousandths = \(\frac{25}{1000}\)
Simplify using the GCF.
The GCF of 25 and 1000 is 25.
Divide the numerator and the denominator by 25
\(\frac{25 ÷ 25}{1000 ÷ 25}\) = \(\frac{1}{40}\)
Write as a decimal.
Question 5.
\(\frac{17}{25}\)
______
Answer:
0.68
Explanation:
Use division to rename the fraction part as a decimal.
17/25 = 0.68
The quotient has 2 decimal places.
Add the whole number to the decimal.
0 + 0.68 = 0.68.
So, \(\frac{17}{25}\) = 0.68
Question 6.
\(\frac{11}{20}\)
______
Answer:
0.55
Explanation:
Use division to rename the fraction part as a decimal.
11/20 = 0.55
The quotient has 2 decimal places.
Add the whole number to the decimal.
0 + 0.55 = 0.55.
So, \(\frac{11}{20}\) = 0.55
Question 7.
4 \(\frac{13}{20}\)
______
Answer:
4.65
Explanation:
Use division to rename the fraction part as a decimal.
\(\frac{13}{20}\) = 0.65
The quotient has 2 decimal places.
Add the whole number to the decimal.
4 + 0.65 = 4.65.
So, 4 \(\frac{13}{20}\) = 4.65
Question 8.
7 \(\frac{3}{8}\)
______
Answer:
7.375
Explanation:
Use division to rename the fraction part as a decimal.
\(\frac{3}{8}\) = 0.375
The quotient has 3 decimal places.
Add the whole number to the decimal.
7 + 0.375 = 7.375.
So, 7 \(\frac{3}{8}\) = 7.375
Identify a decimal and a fraction or mixed number in simplest form for each point.

Question 9.
Point A
Type below:
__________
Answer:
0.4
Explanation:
Point A is between 0 and 0.5. Every point is separated by 0.1. So, Point A is at 0.4
Question 10.
Point D
Type below:
__________
Answer:
1.9
Explanation:
Point D is between 1.5 and 2. Every point is separated by 0.1. So, Point D is at 1.9
Question 11.
Point C
Type below:
__________
Answer:
1.2
Explanation:
Point C is between 1 and 1.5. Every point is separated by 0.1. So, Point C is at 1.2
Question 12.
Point B
Type below:
__________
Answer:
0.6
Explanation:
Point C is between 0.5 and 1. Every point is separated by 0.1. So, Point C is at 0.6
Problem Solving
Question 13.
Grace sold \(\frac{5}{8}\) of her stamp collection. What is this amount as a decimal?
______
Answer:
0.625
Explanation:
Grace sold \(\frac{5}{8}\) of her stamp collection.
Use division to rename the fraction part as a decimal.
\(\frac{5}{8}\) = 0.625
The quotient has 3 decimal places.
Add the whole number to the decimal.
0 + 0.625 = 0.625.
So, \(\frac{5}{8}\) = 0.625
Question 14.
What if you scored an 0.80 on a test? What fraction of the test, in simplest form, did you answer correctly?
\(\frac{□}{□}\)
Answer:
\(\frac{4}{5}\)
Explanation:
0.80 is 0 ones and 8 tenths.
8 tenths = \(\frac{8}{10}\)
Simplify using the GCF.
The GCF of 8 and 10 is 2.
Divide the numerator and the denominator by 2
\(\frac{8 ÷ 2}{10 ÷ 2}\) = \(\frac{4}{5}\)
Question 15.
What fraction in simplest form is equivalent to 0.45? What decimal is equivalent to \(\frac{17}{20}\)? Explain how you found your answers.
Type below:
__________
Answer:
0.45 is 0 ones and 45 hundredths.
45 hundredths = \(\frac{45}{100}\)
Simplify using the GCF.
The GCF of 45 and 100 is 5.
Divide the numerator and the denominator by 5
\(\frac{45 ÷ 5}{100 ÷ 5}\) = \(\frac{9}{20}\)
\(\frac{17}{20}\)
Use division to rename the fraction part as a decimal.
\(\frac{17}{20}\) = 0.85
The quotient has 2 decimal places.
Add the whole number to the decimal.
0 + 0.85 = 0.85.
So, \(\frac{17}{20}\) = 0.85
Lesson Check – Page No. 74
Question 1.
After a storm, Michael measured 6 \(\frac{7}{8}\) inches of snow. What is this amount as a decimal?
______ inches
Answer:
6.875 inches
Explanation:
Michael measured 6 \(\frac{7}{8}\) inches of snow.
Use division to rename the fraction part as a decimal.
\(\frac{7}{8}\) = 0.875
The quotient has 3 decimal places.
Add the whole number to the decimal.
6 + 0.875 = 6.875.
So, 6 \(\frac{7}{8}\) = 6.875.
Question 2.
A recipe calls for 3.75 cups of flour. What is this amount as a mixed number in simplest form?
______ \(\frac{□}{□}\) cups
Answer:
3 \(\frac{3}{4}\) cups
Explanation:
A recipe calls for 3.75 cups of flour.
3 + 0.75
0.75 is 0 ones and 75 hundredths.
75 hundredths = \(\frac{75}{100}\)
Simplify using the GCF.
The GCF of 75 and 100 is 25.
Divide the numerator and the denominator by 25
\(\frac{75 ÷ 25}{100 ÷ 25}\) = \(\frac{3}{4}\)
3 \(\frac{3}{4}\)
Spiral Review
Question 3.
Gina bought 2.3 pounds of red apples and 2.42 pounds of green apples. They were on sale for $0.75 a pound. How much did the apples cost altogether?
$ ______
Answer:
$3.54
Explanation:
Gina bought 2.3 pounds of red apples and 2.42 pounds of green apples. They were on sale for $0.75 a pound.
$0.75 x 2.3 = 1.725
$0.75 x 2.42 = 1.815
1.725 + 1.815 = 3.54
So the apples cost $3.54
Question 4.
Ken has 4.66 pounds of walnuts, 2.1 pounds of cashews, and 8 pounds of peanuts. He mixes them together and divides them equally among 18 bags. How many pounds of nuts are in each bag?
______ pounds
Answer:
0.82 pounds
Explanation:
Ken has 4.66 pounds of walnuts, 2.1 pounds of cashews, and 8 pounds of peanuts.
4.66 + 2.1 + 8 = 14.76
He mixes them together and divides them equally among 18 bags.
14.76/18 = 0.82
Question 5.
Mia needs to separate 270 blue pens and 180 red pens into packs. Each pack will have the same number of blue pens and the same number of red pens. What is the greatest number of packs she can make? How many red pens and how many blue pens will be in each pack?
Type below:
__________
Answer:
There are 2 red pens and 3 blue pens in each pack.
Explanation:
Mia needs to separate 270 blue pens and 180 red pens into packs.
The GCF of 270 and 180 is 90
The greatest number of packs she can make is 90.
Divide the total number of red pens by the total number of packs.
180/90 = 2
Divide the total number of blue pens by the total number of packs.
270/90 = 3
There are 2 red pens and 3 blue pens in each pack.
Question 6.
Evan buys 19 tubes of watercolor paint for $50.35. What is the cost of each tube of paint?
$ ______
Answer:
$2.65
Explanation:
Evan buys 19 tubes of watercolor paint for $50.35.
$50.35/19 = $2.65
Share and Show – Page No. 77
Order from least to greatest.
Question 1.
\(3 \frac{3}{6}, 3 \frac{5}{8}, 2 \frac{9}{10}\)
Type below:
__________
Answer:
2 \(\frac{9}{10}\) < 3 \(\frac{3}{6}\) < 3 \(\frac{5}{8}\)
Explanation:
\(3 \frac{3}{6}, 3 \frac{5}{8}, 2 \frac{9}{10}\)
Compare the whole numbers first.
2 < 3
If the whole numbers are the same, compare the fractions.
3 \(\frac{3}{6}\), 3 \(\frac{5}{8}\)
6 and 8 are multiples of 48.
So, 48 is a common denominator.
3 \(\frac{3 x 8}{6 x 8}\) = 3 \(\frac{24}{48}\), 3 \(\frac{5 x 6}{8 x 6}\) = 3 \(\frac{30}{48}\)
3 \(\frac{24}{48}\) < 3 \(\frac{30}{48}\)
So, 3 \(\frac{3}{6}\) < 3 \(\frac{5}{8}\)
Order the fractions from least to greatest.
2 \(\frac{9}{10}\) < 3 \(\frac{3}{6}\) < 3 \(\frac{5}{8}\)
Write <, >, or =.
Question 2.
0.8 _____ \(\frac{4}{12}\)
Answer:
0.8 < latex]\frac{4}{12}[/latex]
Explanation:
Write the decimal form of \(\frac{4}{12}\) = 0.3333
0.8 > 0.333
So, 0.8 < latex]\frac{4}{12}[/latex]
Question 3.
0.22 _____ \(\frac{1}{4}\)
Answer:
0.22 < \(\frac{1}{4}\)
Explanation:
Write the decimal form of \(\frac{1}{4}\) = 0.25
0.22 < 0.25
So, 0.22 < \(\frac{1}{4}\)
Question 4.
\(\frac{1}{20}\) _____ 0.06
Answer:
\(\frac{1}{20}\) < 0.06
Explanation:
Write the decimal form of \(\frac{1}{20}\) = 0.05
0.05 < 0.06
So, \(\frac{1}{20}\) < 0.06
Use a number line to order from least to greatest.
Question 5.
\(1 \frac{4}{5}, 1.25, 1 \frac{1}{10}\)
Type below:
__________
Answer:
1\(\frac{1}{10}\), 1.25, 1\(\frac{4}{5}\)
Explanation:
Write the decimal form of 1\(\frac{4}{5}\) = 1.8
Write the decimal form of 1\(\frac{1}{10}\) = 1.1
1.8, 1.25, 1.1
Locate each decimal on a number line.
So, from least to greatest, the order is 1.1, 1.25, 1.8
1\(\frac{1}{10}\), 1.25, 1\(\frac{4}{5}\)
On Your Own
Order from least to greatest.
Question 6.
0.6, \(\frac{4}{5}\), 0.75
Type below:
__________
Answer:
0.6, 0.75, \(\frac{4}{5}\)
Explanation:
Write the decimal form of \(\frac{4}{5}\) = 0.8
0.6, 0.8, 0.75
Compare decimals.
All ones are equal.
Compare tenths: 6 < 7 < 8
So, from least to greatest, the order is 0.6, 0.75, 0.8
So, 0.6, 0.75, \(\frac{4}{5}\)
Question 7.
\(\frac{1}{2}\), \(\frac{2}{5}\), \(\frac{7}{15}\)
Type below:
__________
Answer:
\(\frac{2}{5}\), \(\frac{7}{15}\), \(\frac{1}{2}\)
Explanation:
Write the decimal form of \(\frac{1}{2}\) = 0.5
Write the decimal form of \(\frac{2}{5}\) = 0.4
Write the decimal form of \(\frac{7}{15}\) = 0.466
0.5, 0.4, 0.466
Compare decimals.
All ones are equal.
Compare tenths: 4 < 5
Compare hundredths of 0.4 and 0.466; 0 < 6
So, from least to greatest, the order is 0.4 < 0.466 < 0.5
So, \(\frac{2}{5}\), \(\frac{7}{15}\), \(\frac{1}{2}\)
Question 8.
5 \(\frac{1}{2}\), 5.05, 5 \(\frac{5}{9}\)
Type below:
__________
Answer:
5.05, 5 \(\frac{1}{2}\), 5 \(\frac{5}{9}\)
Explanation:
Write the decimal form of 5 \(\frac{1}{2}\) = 5.5
Write the decimal form of 5 \(\frac{5}{9}\) = 5.555
5.5, 5.05, 5.5555
Compare decimals.
All ones are equal.
Compare tenths: 0 < 5
Compare hundredths of 5.5 and 5.55; 0 < 5
So, from least to greatest, the order is 5.05 < 5.5 < 5.55
So, 5.05, 5 \(\frac{1}{2}\), 5 \(\frac{5}{9}\)
Question 9.
\(\frac{5}{7}\), \(\frac{5}{6}\), \(\frac{5}{12}\)
Type below:
__________
Answer:
\(\frac{5}{12}\), \(\frac{5}{7}\), \(\frac{5}{6}\)
Explanation:
\(\frac{5}{7}\), \(\frac{5}{6}\), \(\frac{5}{12}\)
To compare fractions with the same numerators, compare the denominators.
So, from least to greatest, the order is \(\frac{5}{12}\), \(\frac{5}{7}\), \(\frac{5}{6}\)
Question 10.
\(\frac{7}{15}\) _____ \(\frac{7}{10}\)
Answer:
\(\frac{7}{15}\) < \(\frac{7}{10}\)
Explanation:
\(\frac{7}{15}\) and \(\frac{7}{10}\)
To compare fractions with the same numerators, compare the denominators.
So, \(\frac{7}{15}\) < \(\frac{7}{10}\)
Question 11.
\(\frac{1}{8}\) _____ 0.125
Answer:
\(\frac{1}{8}\) = 0.125
Explanation:
Write the decimal form of \(\frac{1}{8}\) = 0.125
0.125 = 0.125
Question 12.
7 \(\frac{1}{3}\) _____ 6 \(\frac{2}{3}\)
Answer:
7 \(\frac{1}{3}\) > 6 \(\frac{2}{3}\)
Explanation:
Compare the whole numbers first.
7 > 6.
So, 7 \(\frac{1}{3}\) > 6 \(\frac{2}{3}\)
Question 13.
1 \(\frac{2}{5}\) _____ 1 \(\frac{7}{15}\)
Answer:
1 \(\frac{2}{5}\) < 1 \(\frac{7}{15}\)
Explanation:
1 \(\frac{2}{5}\) _____ 1 \(\frac{7}{15}\)
If the whole numbers are the same, compare the fractions.
Compare \(\frac{2}{5}\) and \(\frac{7}{15}\)
5 and 15 are multiples of 15.
So, \(\frac{2 x 3}{5 x 3}\) = \(\frac{6}{15}\)
\(\frac{6}{15}\) < \(\frac{7}{15}\)
Use common denominators to write equivalent fractions.
1 \(\frac{2}{5}\) < 1 \(\frac{7}{15}\)
Question 14.
Darrell spent 3 \(\frac{2}{5}\) hours on a project for school. Jan spent 3 \(\frac{1}{4}\) hours and Maeve spent 3.7 hours on the project. Who spent the least amount of time? Show how you found your answer. Then describe another possible method.
Type below:
__________
Answer:
Jan spent the least amount of time.
Explanation:
Darrell spent 3 \(\frac{2}{5}\) hours on a project for school. Jan spent 3 \(\frac{1}{4}\) hours and Maeve spent 3.7 hours on the project.
Write the decimal form of 3 \(\frac{2}{5}\) = 3.4
Write the decimal form of 3 \(\frac{1}{4}\) = 3.25
3.4, 3.25, 3.7
3.25 is the least one.
So, Jan spent the least amount of time.
Problem Solving + Applications – Page No. 78
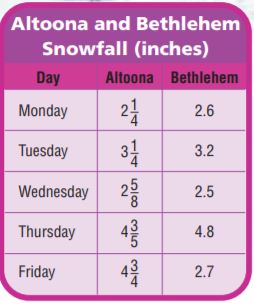
Use the table for 15–18.
Question 15.
In one week, Altoona, PA, and Bethlehem, PA, received snowfall every day, Monday through Friday. On which days did Altoona receive over 0.1 inch more snow than Bethlehem?
Type below:
__________
Answer:
Altoona received over 1 inch more snow than Bethlehem on Friday
Explanation:
Altoona (converted to decimal form): 2.25, 3.25, 2.625, 4.6, 4.75
Bethlehem: 2.6, 3.2, 2.5, 4.8, 2.7
Altoona received over 1 inch more snow than Bethlehem on Friday
Question 16.
What if Altoona received an additional 0.3 inch of snow on Thursday? How would the total amount of snow in Altoona compare to the amount received in Bethlehem that day?
Type below:
__________
Answer:
Altoona received 0.1 inches more snow than Bethlehem on Thursday
Explanation:
Altoona received an additional 0.3 inch of snow on Thursday = 4.6 + 0.3 = 4.9
Bethlehem received on Thursday = 4.8
Altoona received 0.1 inches more snow than Bethlehem on Thursday
Question 17.
Explain two ways you could compare the snowfall amounts in Altoona and Bethlehem on Monday.
Type below:
__________
Answer:
Explanation:
Altoona received on Monday = 2.25
Bethlehem received on Monday = 2.6
Bethlehem received 0.35 inches more snow than Altoona on Monday.
As the whole numbers are equal compare 1/4 and 0.6.
0.25 < 0.6
So, Altoona received less snow compared to Bethlehem on Monday.
Question 18.
Explain how you could compare the snowfall amounts in Altoona on Thursday and Friday.
Type below:
__________
Answer:
Altoona received on Thursday = 4.6
Altoona received on Friday = 4.75
4.6 < 4.75
Altoona received less snow on Thursday compared to Friday.
Question 19.
Write the values in order from least to greatest.

Type below:
__________
Answer:
1/3, 0.39, 2/5, 0.45
Explanation:
1/3 = 0.333
0.45
0.39
2/5 = 0.4
Compare tenths: 3 < 4
Compare hundredths:
0.33 < 0.39
0.4 < 0.45
So, 1/3, 0.39, 2/5, 0.45
Compare and Order Fractions and Decimals – Page No. 79
Write <, >, =.
Question 1.
0.64 _____ \(\frac{7}{10}\)
Answer:
0.64 < \(\frac{7}{10}\)
Explanation:
Write the decimal form of \(\frac{7}{10}\) = 0.7
Compare tenths: 6 < 7
So, 0.64 < 0.7
0.64 < \(\frac{7}{10}\)
Question 2.
0.48 _____ \(\frac{6}{15}\)
Answer:
0.48 > \(\frac{6}{15}\)
Explanation:
Write the decimal form of \(\frac{6}{15}\) = 0.4
Compare hundredths:
0.48 > 0.4
0.48 > \(\frac{6}{15}\)
Question 3.
0.75 _____ \(\frac{7}{8}\)
Answer:
0.75 < \(\frac{7}{8}\)
Explanation:
Write the decimal form of \(\frac{7}{8}\) = 0.875
Compare tenths:
7 < 8
0.75 < \(\frac{7}{8}\)
Question 4.
7 \(\frac{1}{8}\) _____ 7.025
Answer:
7 \(\frac{1}{8}\) > 7.025
Explanation:
Write the decimal form of 7 \(\frac{1}{8}\) = 7.125
Compare tenths:
1 > 0
7 \(\frac{1}{8}\) > 7.025
Order from least to greatest.
Question 5.
\(\frac{7}{15}\), 0.75, \(\frac{5}{6}\)
Type below:
__________
Answer:
\(\frac{7}{15}\), 0.75, \(\frac{5}{6}\)
Explanation:
Write the decimal form of \(\frac{7}{15}\) = 0.466
0.75
Write the decimal form of \(\frac{5}{6}\) = 0.833
Order from least to greatest: \(\frac{7}{15}\), 0.75, \(\frac{5}{6}\)
Question 6.
0.5, 0.41, \(\frac{3}{5}\)
Type below:
__________
Answer:
0.41, 0.5, \(\frac{3}{5}\)
Explanation:
Write the decimal form of \(\frac{3}{5}\) = 0.6
Compare tenths:
0.41, 0.5, 0.6
Order from least to greatest: 0.41, 0.5, \(\frac{3}{5}\)
Question 7.
3.25, 3 \(\frac{2}{5}\), 3 \(\frac{3}{8}\)
Type below:
__________
Answer:
3.25, 3 \(\frac{2}{5}\), 3 \(\frac{3}{8}\)
Explanation:
Write the decimal form of 3 \(\frac{2}{5}\) = 3.4
Write the decimal form of 3 \(\frac{3}{8}\) = 3.375
Compare tenths:
Order from least to greatest: 3.25, 3 \(\frac{2}{5}\), 3 \(\frac{3}{8}\)
Question 8.
0.9, \(\frac{8}{9}\), 0.86
Type below:
__________
Answer:
0.86, \(\frac{8}{9}\), 0.9
Explanation:
Write the decimal form of \(\frac{8}{9}\) = 0.88
Compare tenths:
0.86, 0.88, 0.9
Order from least to greatest: 0.86, \(\frac{8}{9}\), 0.9
Order from greatest to least.
Question 9.
0.7, \(\frac{7}{9}\), \(\frac{7}{8}\)
Type below:
__________
Answer:
\(\frac{7}{8}\), \(\frac{7}{9}\), 0.7
Explanation:
0.7 = 7/10
To compare fractions with the same numerators, compare the denominators.
7/10, 7/9, 7/8
Order from greatest to least: 7/8, 7/9, 7/10
Question 10.
0.2, 0.19, \(\frac{3}{5}\)
Type below:
__________
Answer:
\(\frac{3}{5}\), 0.2, 0.19
Explanation:
Write the decimal form of \(\frac{3}{5}\) = 0.6
Compare tenths:
0.6, 0.2, 0.19
Order from greatest to least: \(\frac{3}{5}\), 0.2, 0.19
Question 11.
6\(\frac{1}{20}\), 6.1, 6.07
Type below:
__________
Answer:
Explanation:
Write the decimal form of 6\(\frac{1}{20}\) = 121/20 = 6.05
Compare tenths:
6.1, 6.07, 6.05
Order from greatest to least: 6.1, 6.07, 6\(\frac{1}{20}\)
Question 12.
2 \(\frac{1}{2}\), 2.4, 2.35, 2 \(\frac{1}{8}\)
Type below:
__________
Answer:
2 \(\frac{1}{2}\), 2.4, 2.35, 2 \(\frac{1}{8}\)
Explanation:
Write the decimal form of 2 \(\frac{1}{2}\) = 2.5
Write the decimal form of 2 \(\frac{1}{8}\) = 2.125
Compare tenths: 2.5, 2.4, 2.35, 2.125
Order from greatest to least: 2 \(\frac{1}{2}\), 2.4, 2.35, 2 \(\frac{1}{8}\)
Question 13.
One day it snowed 3 \(\frac{3}{8}\) inches in Altoona and 3.45 inches in Bethlehem. Which city received less snow that day?
__________
Answer:
Altoona
Explanation:
One day it snowed 3 \(\frac{3}{8}\) inches in Altoona and 3.45 inches in Bethlehem.
Write the decimal form of 3 \(\frac{3}{8}\) = 27/8 = 3.375
3.375 < 3.45.
Altoona received less snow that day
Question 14.
Malia and John each bought 2 pounds of sunflower seeds. Each ate some seeds. Malia has 1 \(\frac{1}{3}\) pounds left, and John has 1 \(\frac{2}{5}\) pounds left. Who ate more sunflower seeds?
__________
Answer:
Malia
Explanation:
Malia and John each bought 2 pounds of sunflower seeds. Each ate some seeds. Malia has 1 \(\frac{1}{3}\) pounds left, and John has 1 \(\frac{2}{5}\) pounds left.
2 – 1 \(\frac{1}{3}\) = 0.667
2 – 1 \(\frac{2}{5}\) = 0.6
0.667 > 0.6
So, Malia ate more sunflower seeds
Question 15.
Explain how you would compare the numbers 0.4 and \(\frac{3}{8}\).
Type below:
__________
Answer:
Write the decimal form of \(\frac{3}{8}\) = 0.375
Compare tenths:
0.4 > 0.375
Lesson Check – Page No. 80
Question 1.
Andrea has 3 \(\frac{7}{8}\) yards of purple ribbon, 3.7 yards of pink ribbon, and 3 \(\frac{4}{5}\) yards of blue ribbon. List the numbers in order from least to greatest.
Type below:
__________
Answer:
Andrea has 3 \(\frac{7}{8}\) yards of purple ribbon, 3.7 yards of pink ribbon, and 3 \(\frac{4}{5}\) yards of blue ribbon.
Write the decimal form of 3 \(\frac{7}{8}\) = 3.875
3.7
Write the decimal form of 3 \(\frac{4}{5}\) = 3.8
Least to greatest : 3.7, 3 \(\frac{4}{5}\), 3 \(\frac{7}{8}\)
Question 2.
Nassim completed \(\frac{18}{25}\) of the math homework. Kara completed 0.7 of it. Debbie completed \(\frac{5}{8}\) of it. List the numbers in order from greatest to least.
Type below:
__________
Answer:
$1.39, $0.70, $0.63
Explanation:
Nassim completed \(\frac{18}{25}\) of the math homework. Kara completed 0.7 of it. Debbie completed \(\frac{5}{8}\) of it.
Write the decimal form of 18/25 = 1.39
0.7
Write the decimal form of 5/8 = 0.63
They are now in order from greatest to least.
Think of the amounts as money:
$1.39, $0.70, $0.63
Spiral Review
Question 3.
Tyler bought 3 \(\frac{2}{5}\) pounds of oranges. Graph 3 \(\frac{2}{5}\) on a number line and write this amount using a decimal.
Type below:
__________
Answer:

Tyler bought 3 \(\frac{2}{5}\) pounds of oranges.
Decimal Form: 17/5 = 3.4
Question 4.
At the factory, a baseball card is placed in every 9th package of cereal. A football card is placed in every 25th package of the cereal. What is the first package that gets both a baseball card and a football card?
Type below:
__________
Answer:
225th package
Explanation:
Look for the first number where both 25 and 9 are a factor of.
25 x 1 = 25 which isn’t a factor of 9, so it won’t be 25.
25 x 2 = 50, which isn’t a factor of 9.
75 is not a factor of 9. (you know because you don’t get a whole number when you divide 75 into 9.)
100 is not a factor of 9, nor is 125, 150, 175, or 200.
However, 225 is a factor of both 25 and 9. This makes sense because 25 x 9 is 225.
This means that the first package with both will be the 225th package.
Question 5.
$15.30 is divided among 15 students. How much does each student receive?
$ _____
Answer:
$1.02
Explanation:
$15.30 is divided among 15 students.
$15.30/15 = $1.02
each student receive $1.02
Question 6.
Carrie buys 4.16 pounds of apples for $5.20. How much does 1 pound cost?
$ _____
Answer:
$1.25
Explanation:
Carrie buys 4.16 pounds of apples for $5.20.
$5.20/4.16 = $1.25
1 pound cost = $1.25
Share and Show – Page No. 83
Find the product. Write it in simplest form.
Question 1.
6 × \(\frac{3}{8}\)
\(\frac{□}{□}\)
Answer:
\(\frac{9}{4}\)
Explanation:
\(\frac{6 × 3}{1 × 8}\)
\(\frac{18}{8}\)
Simplify using the GCF.
The GCF of 18 and 8 is 2.
Divide the numerator and the denominator by 2.
\(\frac{18 ÷ 2}{8 ÷ 2}\) = \(\frac{9}{4}\)
Question 2.
\(\frac{3}{8}\) × \(\frac{8}{9}\)
\(\frac{□}{□}\)
Answer:
\(\frac{1}{3}\)
Explanation:
Multiply the numerators and Multiply the denominators.
\(\frac{3 × 8}{8 × 9}\) = \(\frac{24}{72}\)
Simplify using the GCF.
The GCF of 24 and 72 is 24.
Divide the numerator and the denominator by 24.
\(\frac{24 ÷ 24}{72 ÷ 24}\) = \(\frac{1}{3}\)
Question 3.
Sam and his friends ate 3 \(\frac{3}{4}\) bags of fruit snacks. If each bag contained 2 \(\frac{1}{2}\) ounces, how many ounces of fruit snacks did Sam and his friends eat?
\(\frac{□}{□}\)
Answer:
\(\frac{75}{8}\) ounces
Explanation:
Sam and his friends ate 3 \(\frac{3}{4}\) bags of fruit snacks. If each bag contained 2 \(\frac{1}{2}\) ounces
3 \(\frac{3}{4}\) x 2 \(\frac{1}{2}\)
\(\frac{15}{4}\) x \(\frac{5}{2}\)
\(\frac{15 x 5}{4 x 2}\) = \(\frac{75}{8}\)
Attend to Precision Algebra Evaluate using the order of operations.
Write the answer in simplest form.
Question 4.
\(\left(\frac{3}{4}-\frac{1}{2}\right) \times \frac{3}{5}\)
\(\frac{□}{□}\)
Answer:
\(\frac{3}{20}\)
Explanation:
\(\left(\frac{3}{4}-\frac{1}{2}\right) \times \frac{3}{5}\)
Perform operations in parentheses.
\(\frac{3}{4}\) – \(\frac{1}{2}\) = \(\frac{1}{4}\)
\(\frac{1}{4}\) x \(\frac{3}{5}\) = \(\frac{1 x 3}{4 x 5}\) = \(\frac{3}{20}\)
Question 5.
\(\frac{1}{3}+\frac{4}{9} \times 12\)
\(\frac{□}{□}\)
Answer:
\(\frac{28}{3}\)
Explanation:
\(\frac{1}{3}\) + \(\frac{4}{9}\) = \(\frac{7}{9}\)
\(\frac{7 x 12}{9 x 1}\) = \(\frac{84}{9}\)
Simplify using the GCF.
The GCF of 84 and 9 is 3.
Divide the numerator and the denominator by 3.
\(\frac{84 ÷ 3}{9 ÷ 3}\) = \(\frac{28}{3}\)
Question 6.
\(\frac{5}{8} \times \frac{7}{10}-\frac{1}{4}\)
\(\frac{□}{□}\)
Answer:
\(\frac{11}{16}\)
Explanation:
\(\frac{5 x 7}{8 x 10}\) = \(\frac{35}{80}\)
\(\frac{35}{80}\) – \(\frac{1}{4}\) = \(\frac{11}{16}\)
Question 7.
3 × (\(\frac{5}{18}\) + \(\frac{1}{6}\)) + \(\frac{2}{5}\)
\(\frac{□}{□}\)
Answer:
\(\frac{38}{15}\)
Explanation:
3 x \(\frac{4}{9}\) + \(\frac{2}{5}\)
3 x \(\frac{38}{45}\) = \(\frac{38}{15}\)
On Your Own
Practice: Copy and Solve Find the product. Write it in simplest form.
Question 8.
\(1 \frac{2}{3} \times 2 \frac{5}{8}\)
\(\frac{□}{□}\)
Answer:
\(\frac{35}{8}\)
Explanation:
1 \(\frac{2}{3}\) = \(\frac{5}{3}\)
2 \(\frac{5}{8}\) = \(\frac{21}{8}\)
\(\frac{5 × 21}{3 × 8}\) = \(\frac{105}{24}\)
Simplify using the GCF
The GCF of 105 and 24 is 3.
Divide the numerator and the denominator by 3.
\(\frac{105 ÷ 3}{24 ÷ 3}\) = \(\frac{35}{8}\)
Question 9.
\(\frac{4}{9} \times \frac{4}{5}\)
\(\frac{□}{□}\)
Answer:
\(\frac{16}{45}\)
Explanation:
\(\frac{4 × 4}{9 × 5}\) = \(\frac{16}{45}\)
Question 10.
\(\frac{1}{6} \times \frac{2}{3}\)
\(\frac{□}{□}\)
Answer:
\(\frac{1}{9}\)
Explanation:
\(\frac{1 × 2}{6 × 3}\) = \(\frac{2}{18}\)
Simplify using the GCF
The GCF of 2 and 18 is 2.
Divide the numerator and the denominator by 2.
\(\frac{2 ÷ 2}{18 ÷ 2}\) = \(\frac{1}{9}\)
Question 11.
\(4 \frac{1}{7} \times 3 \frac{1}{9}\)
\(\frac{□}{□}\)
Answer:
\(\frac{116}{7}\)
Explanation:
4\(\frac{1}{7}\) = \(\frac{29}{7}\)
3\(\frac{1}{9}\) = \(\frac{28}{9}\)
\(\frac{29 × 28}{7 × 9}\) = \(\frac{812}{63}\)
Simplify using the GCF
The GCF of 812 and 63 is 7.
Divide the numerator and the denominator by 7.
\(\frac{812 ÷ 7}{63 ÷ 7}\) = \(\frac{116}{7}\)
Question 12.
\(\frac{5}{6}\) of the 90 pets in the pet show are cats. \(\frac{4}{5}\) of the cats are calico cats. What fraction of the pets are calico cats? How many of the pets are calico cats?
Type below:
__________
Answer:
60 calico cats
Explanation:
5/6 x 90 = 450/6 = 150/2
150/2 x 4/5 = 60
Question 13.
Five cats each ate \(\frac{1}{4}\) cup of cat food. Four other cats each ate \(\frac{1}{3}\) cup of cat food. How much food did the nine cats eat?
Type below:
__________
Answer:
\(\frac{31}{12}\)
Explanation:
5 x 1/4 = 5/4
4 x 1/3 = 4/3
5/4 + 4/3 = 31/12
Attend to Precision Algebra Evaluate using the order of operations.
Write the answer in simplest form.
Question 14.
\(\frac{1}{4} \times\left(\frac{3}{9}+5\right)\)
\(\frac{□}{□}\)
Answer:
\(\frac{4}{3}\)
Explanation:
3/9 + 5 = 16/3
1/4 x 16/3
1 x 16 = 16
4 x 3 = 12
16/12
Simplify using the GCF
The GCF of 16 and 12 is 4.
Divide the numerator and the denominator by 4.
\(\frac{16 ÷ 4}{12÷ 4}\) = \(\frac{4}{3}\)
Question 15.
\(\frac{9}{10}-\frac{3}{5} \times \frac{1}{2}\)
\(\frac{□}{□}\)
Answer:
\(\frac{3}{5}\)
Explanation:
3/5 x 1/2 = 3/10
9/10 – 3/10 = 6/10
Simplify using the GCF
The GCF of 6 and 10 is 2.
Divide the numerator and the denominator by 2.
\(\frac{6 ÷ 2}{10 ÷ 2}\) = \(\frac{3}{5}\)
Question 16.
\(\frac{4}{5}+\left(\frac{1}{2}-\frac{3}{7}\right) \times 2\)
\(\frac{□}{□}\)
Answer:
\(\frac{33}{35}\)
Explanation:
1/2 – 3/7 = 1/14
1/14 x 2 = 1/7
4/5 + 1/7 = 33/35
Question 17.
\(15 \times \frac{3}{10}+\frac{7}{8}\)
\(\frac{□}{□}\)
Answer:
\(\frac{141}{8}\)
Explanation:
3/10 + 7/8 = 47/40
15 x 47/40 = 141/8
\(\frac{141}{8}\)
Page No. 84
Question 18.
Write and solve a word problem for the expression \(\frac{1}{4} \times \frac{2}{3}\). Show your work.
Type below:
__________
Answer:
\(\frac{1}{6}\)
Explanation:
\(\frac{1}{4} \times \frac{2}{3}\) = \(\frac{1 X 2}{4 X 3}\) = \(\frac{2}{12}\)
Simplify using the GCF
The GCF of 2 and 12 is 2.
Divide the numerator and the denominator by 2.
\(\frac{2 ÷ 2}{12 ÷ 2}\) = \(\frac{1}{6}\)
Question 19.
Michelle has a recipe that asks for 2 \(\frac{1}{2}\) cups of vegetable oil. She wants to use \(\frac{2}{3}\) that amount of oil and use applesauce to replace the rest. How much applesauce will she use?
Type below:
__________
Answer:
\(\frac{10}{6}\)
Explanation:
2 1/2 * 2/3 = 5/2 * 2/3 = 10/6 She will use 10/6 or 1 2/3 cups of vegetable oil
Question 20.
Cara’s muffin recipe asks for 1 \(\frac{1}{2}\) cups of flour for the muffins and \(\frac{1}{4}\) cup of flour for the topping. If she makes \(\frac{1}{2}\) of the original recipe, how much flour will she use for the muffins and topping?
Type below:
__________
Answer:
Cara will use 1\(\frac{1}{8}\) cups of flour.
Explanation:
For first we will find how many cups of flours need to makes the original recipe. Cara uses 1 1/2 cups of flour for the muffins and 1/4 cup off flour for the topping.
So, 1 1/2 + 1/4 cups of flour to make the original recipe.
1 1/2 = 3/2
3/2 + 1/4 = 7/4
To make the original recipe Cara needs 7/4 cups of flour.
If she makes \(\frac{1}{2}\) of the original recipe, then
7/4 x 1/2 = 7/8 = 1 1/8
Cara will use 1 1/8 cups of flour.
Multiply Fractions – Page No. 85
Find the product. Write it in simplest form.
Question 1.
\(\frac{4}{5} \times \frac{7}{8}\)
\(\frac{□}{□}\)
Answer:
\(\frac{7}{10}\)
Explanation:
Multiply the numerators and Multiply the denominators.
\(\frac{4 × 7}{5 × 8}\) = \(\frac{28}{40}\)
Simplify using the GCF.
The GCF of 28 and 40 is 4.
Divide the numerator and the denominator by 4.
\(\frac{28 ÷ 4}{40 ÷ 4}\) = \(\frac{7}{10}\)
Question 2.
\(\frac{1}{8} \times 20\)
\(\frac{□}{□}\)
Answer:
\(\frac{5}{2}\)
Explanation:
\(\frac{1 × 20}{1 × 8}\)
\(\frac{20}{8}\)
Simplify using the GCF.
The GCF of 20 and 8 is 4.
Divide the numerator and the denominator by 4.
\(\frac{20 ÷ 4}{8 ÷ 4}\) = \(\frac{5}{2}\)
Question 3.
\(\frac{4}{5} \times \frac{3}{8}\)
\(\frac{□}{□}\)
Answer:
\(\frac{3}{10}\)
Explanation:
Multiply the numerators and Multiply the denominators.
\(\frac{4 × 3}{5 × 8}\) = \(\frac{12}{40}\)
Simplify using the GCF.
The GCF of 12 and 40 is 4.
Divide the numerator and the denominator by 4.
\(\frac{12 ÷ 4}{40 ÷ 4}\) = \(\frac{3}{10}\)
Question 4.
\(1 \frac{1}{8} \times \frac{1}{9}\)
\(\frac{□}{□}\)
Answer:
\(\frac{1}{8}\)
Explanation:
1\(\frac{1}{8}\) = \(\frac{9}{8}\)
Multiply the numerators and Multiply the denominators.
\(\frac{9 × 1}{8 × 9}\) = \(\frac{9}{72}\)
Simplify using the GCF.
The GCF of 9 and 72 is 9.
Divide the numerator and the denominator by 9.
\(\frac{9 ÷ 9}{72 ÷ 9}\) = \(\frac{1}{8}\)
Question 5.
\(\frac{3}{4} \times \frac{1}{3} \times \frac{2}{5}\)
\(\frac{□}{□}\)
Answer:
\(\frac{1}{10}\)
Explanation:
Multiply the numerators and Multiply the denominators.
\(\frac{3 × 1 × 2}{4 × 3 × 5}\) = \(\frac{6}{60}\)
Simplify using the GCF.
The GCF of 6 and 60 is 6.
Divide the numerator and the denominator by 6.
\(\frac{6 ÷ 6}{60 ÷ 6}\) = \(\frac{1}{10}\)
Question 6.
Karen raked \(\frac{3}{5}\) of the yard. Minni raked \(\frac{1}{3}\) of the amount Karen raked. How much of the yard did Minni rake?
\(\frac{□}{□}\)
Answer:
\(\frac{1}{3}\)
Explanation:
Minni raked 1/5 of the yard.
So, minni raked 3/5 of 1/3 means 3/5 x 1/3
Multiply the numerators and Multiply the denominators.
\(\frac{3 × 1}{5 × 3}\) = \(\frac{3}{15}\)
Simplify using the GCF.
The GCF of 3 and 15 is 3.
Divide the numerator and the denominator by 3.
\(\frac{3 ÷ 3}{15 ÷ 3}\) = \(\frac{1}{3}\)
Question 7.
\(\frac{3}{8}\) of the pets in the pet show are dogs. \(\frac{2}{3}\) of the dogs have long hair. What fraction of the pets are dogs with long hair?
\(\frac{□}{□}\)
Answer:
\(\frac{1}{4}\) are dogs with long hair
Explanation:
\(\frac{3}{8}\) of the pets in the pet show are dogs. \(\frac{2}{3}\) of the dogs have long hair.
\(\frac{3}{8}\) of \(\frac{2}{3}\) = \(\frac{3 × 2}{8 × 3}\) = \(\frac{6}{24}\)
The GCF of 6 and 24 is 6.
Divide the numerator and the denominator by 6.
\(\frac{6 ÷ 6}{24 ÷ 6}\) = \(\frac{1}{4}\)
\(\frac{1}{4}\) are dogs with long hair
Evaluate using the order of operations.
Question 8.
\(\left(\frac{1}{2}+\frac{3}{8}\right) \times 8\)
______
Answer:
7
Explanation:
1/2 + 3/8 = 7/8
7/8 × 8 = 7
Question 9.
\(\frac{3}{4} \times\left(1-\frac{1}{9}\right)\)
\(\frac{□}{□}\)
Answer:
\(\frac{2}{3}\)
Explanation:
1 – 1/9 = 8/9
3/4 × 8/9 = 24/36
The GCF of 24 and 36 is 12.
Divide the numerator and the denominator by 12.
\(\frac{24 ÷ 12}{36 ÷ 12}\) = \(\frac{2}{3}\)
Question 10.
\(4 \times \frac{1}{8} \times \frac{3}{10}\)
\(\frac{□}{□}\)
Answer:
\(\frac{3}{20}\)
Explanation:
Multiply the numerators and Multiply the denominators.
\(\frac{4 × 1 × 3}{1 × 8 × 10}\) = \(\frac{12}{80}\)
Simplify using the GCF.
The GCF of 12 and 80 is 4.
Divide the numerator and the denominator by 4.
\(\frac{12 ÷ 4}{80 ÷ 4}\) = \(\frac{3}{20}\)
Question 11.
\(6 \times\left(\frac{4}{5}+\frac{2}{10}\right) \times \frac{2}{3}\)
______
Answer:
4
Explanation:
4/5 + 2/10 = 1
6 × 1 × 2/3 = 12/3
The GCF of 12 and 3 is 4.
Divide the numerator and the denominator by 3.
\(\frac{12 ÷ 3}{3 ÷ 3}\) = \(\frac{4}{1}\) = 4
Problem Solving
Question 12.
Jason ran \(\frac{5}{7}\) of the distance around the school track. Sara ran \(\frac{4}{5}\) of Jason’s distance. What fraction of the total distance around the track did Sara run?
\(\frac{□}{□}\)
Answer:
\(\frac{4}{7}\)
Explanation:
Jason ran \(\frac{5}{7}\) of the distance around the school track. Sara ran \(\frac{4}{5}\) of Jason’s distance.
\(\frac{5}{7}\) × \(\frac{4}{5}\) = 20/35
The GCF of 20 and 35 is 5.
Divide the numerator and the denominator by 5.
\(\frac{20 ÷ 5}{35 ÷ 5}\) = \(\frac{4}{7}\)
Question 13.
A group of students attend a math club. Half of the students are boys and \(\frac{4}{9}\) of the boys have brown eyes. What fraction of the group are boys with brown eyes?
\(\frac{□}{□}\)
Answer:
\(\frac{2}{9}\) group are boys with brown eyes
Explanation:
A group of students attend a math club. Half of the students are boys and \(\frac{4}{9}\) of the boys have brown eyes.
\(\frac{4}{9}\) × \(\frac{1}{2}\) = 4/18 = 2/9
2/9 group are boys with brown eyes
Question 14.
Write and solve a word problem that involves multiplying by a fraction.
Type below:
__________
Answer:
A group of students attends a math club. Half of the students are boys and \(\frac{6}{9}\) of the boys have brown eyes. What fraction of the group are boys with brown eyes?
\(\frac{□}{□}\)
Answer:
A group of students attends a math club. Half of the students are boys and \(\frac{6}{9}\) of the boys have brown eyes.
\(\frac{6}{9}\) × \(\frac{1}{2}\) = 6/18 = 1/3
1/3 group are boys with brown eyes.
Lesson Check – Page No. 86
Question 1.
Veronica’s mom left \(\frac{3}{4}\) of a cake on the table. Her brothers ate \(\frac{1}{2}\) of it. What fraction of the cake did they eat?
\(\frac{□}{□}\)
Answer:
\(\frac{2}{4}\)
Explanation:
Veronica’s mom left \(\frac{3}{4}\) of a cake on the table. Her brothers ate \(\frac{1}{2}\) of it.
Since the fraction of the eaten cake is 1/2, you can multiply the numerator and denominator by and get an equivalent fraction, which is 2/4.
Question 2.
One lap around the school track is \(\frac{5}{8}\) mile. Carin ran 3 \(\frac{1}{2}\) laps. How far did she run?
_____ \(\frac{□}{□}\)
Answer:
2\(\frac{3}{16}\)
Explanation:
One lap around the school track is \(\frac{5}{8}\) mile. Carin ran 3 \(\frac{1}{2}\) laps.
3 \(\frac{1}{2}\) = \(\frac{7}{2}\)
Therefore, the total distance covered = 7/2 × 5/8 = 35/16 = 2 3/16
Spiral Review
Question 3.
Tom bought 2 \(\frac{5}{16}\) pounds of peanuts and 2.45 pounds of cashews. Which did he buy more of? Explain.
Type below:
__________
Answer:
Explanation:
Tom bought 2 \(\frac{5}{16}\) pounds of peanuts and 2.45 pounds of cashews.
2 \(\frac{5}{16}\) = 2.3125
2.3125 < 2.45
He buys more cashews.
Question 4.
Eve has 24 stamps each valued at $24.75. What is the total value of her stamps?
$ _____
Answer:
$594
Explanation:
Eve has 24 stamps each valued at $24.75.
24 x $24.75 = $594
Question 5.
Naomi went on a 6.5-mile hike. In the morning, she hiked 1.75 miles, rested, and then hiked 2.4 more miles. She completed the hike in the afternoon. How much farther did she hike in the morning than in the afternoon?
_____ miles
Answer:
Naomi went on a 6.5-mile hike. In the morning, she hiked 1.75 miles, rested, and then hiked 2.4 more miles. She completed the hike in the afternoon.
To find how many miles she walked in the afternoon you just subtract the morning miles 4.15 from the total miles 6.5.
6.5 – 4.15 = 2.35
To find how many more miles she walked in the morning you just subtract the morning from the afternoon 4.15 – 2.35=1.8 miles.
She hiked 1.8 more miles in the morning
Question 6.
A bookstore owner has 48 science fiction books and 30 mysteries he wants to sell quickly. He will make discount packages with one type of book in each. He wants the most books possible in each package, but all packages must contain the same number of books. How many packages can he make? How many packages of each type of book does he have?
Type below:
__________
Answer:
18 packages
Explanation:
The bookstore owner can make 18 possible packages
48 – 30 = 18 packages
Share and Show – Page No. 89
Find the product. Simplify before multiplying.
Question 1.
\(\frac{5}{6} \times \frac{3}{10}\)
\(\frac{□}{□}\)
Answer:
\(\frac{1}{4}\)
Explanation:
\(\frac{5}{6} \times \frac{3}{10}\)
Multiply the numerators and Multiply the denominators.
\(\frac{5 × 3}{6 × 10}\) = \(\frac{15}{60}\)
Simplify using the GCF.
The GCF of 15 and 60 is 15.
Divide the numerator and the denominator by 15.
\(\frac{15 ÷ 15}{60 ÷ 15}\) = \(\frac{1}{4}\)
Question 2.
\(\frac{3}{4} \times \frac{5}{9}\)
\(\frac{□}{□}\)
Answer:
\(\frac{5}{12}\)
Explanation:
\(\frac{3}{4} \times \frac{5}{9}\)
Multiply the numerators and Multiply the denominators.
\(\frac{3 × 5}{4 × 9}\) = \(\frac{15}{36}\)
Simplify using the GCF.
The GCF of 15 and 36 is 3.
Divide the numerator and the denominator by 3.
\(\frac{15 ÷ 3}{36 ÷ 3}\) = \(\frac{5}{12}\)
Question 3.
\(\frac{2}{3} \times \frac{9}{10}\)
\(\frac{□}{□}\)
Answer:
\(\frac{3}{5}\)
Explanation:
\(\frac{2}{3} \times \frac{9}{10}\)
Multiply the numerators and Multiply the denominators.
\(\frac{2 × 9}{3 × 10}\) = \(\frac{18}{30}\)
Simplify using the GCF.
The GCF of 18 and 30 is 6.
Divide the numerator and the denominator by 6.
\(\frac{18 ÷ 6}{30 ÷ 6}\) = \(\frac{3}{5}\)
Question 4.
After a picnic, \(\frac{5}{12}\) of the cornbread is left over. Val eats \(\frac{3}{5}\) of the leftover cornbread. What fraction of the cornbread does Val eat?
\(\frac{□}{□}\)
Answer:
\(\frac{1}{4}\)
Explanation:
After a picnic, \(\frac{5}{12}\) of the cornbread is left over. Val eats \(\frac{3}{5}\) of the leftover cornbread.
\(\frac{5}{12} \times \frac{3}{5}\)
Multiply the numerators and Multiply the denominators.
\(\frac{5 × 3}{12 × 5}\) = \(\frac{15}{60}\)
Simplify using the GCF.
The GCF of 15 and 60 is 15.
Divide the numerator and the denominator by 15.
\(\frac{15 ÷ 15}{60 ÷ 15}\) = \(\frac{1}{4}\)
Question 5.
The reptile house at the zoo has an iguana that is \(\frac{5}{6}\) yd long. It has a Gila monster that is \(\frac{4}{5}\) of the length of the iguana. How long is the Gila monster?
\(\frac{□}{□}\)
Answer:
\(\frac{2}{3}\)
Explanation:
The reptile house at the zoo has an iguana that is \(\frac{5}{6}\) yd long. It has a Gila monster that is \(\frac{4}{5}\) of the length of the iguana.
\(\frac{5}{6} \times \frac{4}{5}\)
Multiply the numerators and Multiply the denominators.
\(\frac{5 × 4}{6× 5}\) = \(\frac{20}{30}\)
Simplify using the GCF.
The GCF of 20 and 30 is 10.
Divide the numerator and the denominator by 10.
\(\frac{20 ÷ 10}{30 ÷ 10}\) = \(\frac{2}{3}\)
On Your Own
Find the product. Simplify before multiplying.
Question 6.
\(\frac{3}{4} \times \frac{1}{6}\)
\(\frac{□}{□}\)
Answer:
Explanation:
\(\frac{3}{4} \times \frac{1}{6}\)
Multiply the numerators and Multiply the denominators.
\(\frac{3 × 1}{4 × 6}\) = \(\frac{3}{24}\)
Simplify using the GCF.
The GCF of 3 and 24 is 3.
Divide the numerator and the denominator by 3.
\(\frac{3 ÷ 3}{24 ÷ 3}\) = \(\frac{1}{8}\)
Question 7.
\(\frac{7}{10} \times \frac{2}{3}\)
\(\frac{□}{□}\)
Answer:
\(\frac{7}{15}\)
Explanation:
\(\frac{7}{10} \times \frac{2}{3}\)
Multiply the numerators and Multiply the denominators.
\(\frac{7 × 2}{10 × 3}\) = \(\frac{14}{30}\)
Simplify using the GCF.
The GCF of 14 and 30 is 2.
Divide the numerator and the denominator by 2.
\(\frac{14 ÷ 2}{30 ÷ 2}\) = \(\frac{7}{15}\)
Question 8.
\(\frac{5}{8} \times \frac{2}{5}\)
\(\frac{□}{□}\)
Answer:
\(\frac{1}{4}\)
Explanation:
\(\frac{5}{8} \times \frac{2}{5}\)
Multiply the numerators and Multiply the denominators.
\(\frac{5 × 2}{8 × 5}\) = \(\frac{10}{40}\)
Simplify using the GCF.
The GCF of 10 and 40 is 10.
Divide the numerator and the denominator by 10.
\(\frac{10 ÷ 10}{40 ÷ 10}\) = \(\frac{1}{4}\)
Question 9.
\(\frac{9}{10} \times \frac{5}{6}\)
\(\frac{□}{□}\)
Answer:
\(\frac{3}{4}\)
Explanation:
\(\frac{9}{10} \times \frac{5}{6}\)
Multiply the numerators and Multiply the denominators.
\(\frac{9 × 5}{10 × 6}\) = \(\frac{45}{60}\)
Simplify using the GCF.
The GCF of 45 and 60 is 15.
Divide the numerator and the denominator by 15.
\(\frac{45 ÷ 15}{60 ÷ 15}\) = \(\frac{3}{4}\)
Question 10.
\(\frac{11}{12} \times \frac{3}{7}\)
\(\frac{□}{□}\)
Answer:
\(\frac{11}{28}\)
Explanation:
\(\frac{11}{12} \times \frac{3}{7}\)
Multiply the numerators and Multiply the denominators.
\(\frac{11 × 3}{12 × 7}\) = \(\frac{33}{84}\)
Simplify using the GCF.
The GCF of 33 and 84 is 3.
Divide the numerator and the denominator by 3.
\(\frac{33 ÷ 3}{84 ÷ 3}\) = \(\frac{11}{28}\)
Question 11.
Shelley’s basketball team won \(\frac{3}{4}\) of their games last season. In \(\frac{1}{6}\) of the games they won, they outscored their opponents by more than 10 points. What fraction of their games did Shelley’s team win by more than 10 points?
\(\frac{□}{□}\)
Answer:
\(\frac{1}{8}\)
Explanation:
Let the total number of games be x.
Number of games Shelley’s team won = 3/4x
Number of games they outscored their opponents by more than 10 points = 1/6 X 3/4x = 1/8x
Hence, 1/8 of the total games, Shelley’s team won by 10 points.
Question 12.
Mr. Ortiz has \(\frac{3}{4}\) pound of oatmeal. He uses \(\frac{2}{3}\) of the oatmeal to bake muffins. How much oatmeal does Mr. Ortiz have left?
\(\frac{□}{□}\)
Answer:
\(\frac{1}{2}\)
Explanation:
Mr. Ortiz has \(\frac{3}{4}\) pound of oatmeal. He uses \(\frac{2}{3}\) of the oatmeal to bake muffins.
\(\frac{3}{4} \times \frac{2}{3}\)
Multiply the numerators and Multiply the denominators.
\(\frac{3 × 2}{4 × 3}\) = \(\frac{6}{12}\)
Simplify using the GCF.
The GCF of 6 and 12 is 6.
Divide the numerator and the denominator by 6.
\(\frac{6 ÷ 6}{12 ÷ 6}\) = \(\frac{1}{2}\)
Question 13.
Compare Strategies To find \(\frac{16}{27}\) × \(\frac{3}{4}\), you can multiply the fractions and then simplify the product or you can simplify the fractions and then multiply. Which method do you prefer? Explain.
Type below:
__________
Answer:
\(\frac{16}{27}\) × \(\frac{3}{4}\)
\(\frac{16 × 3}{27 × 4}\) = \(\frac{16 × 3}{4 × 27}\)
\(\frac{48}{96}\)
Simplify using the GCF.
The GCF of 48 and 96 is 48.
Divide the numerator and the denominator by 48.
\(\frac{48 ÷ 48}{96 ÷ 48}\) = \(\frac{1}{2}\)
Problem Solving + Applications – Page No. 90
Question 14.
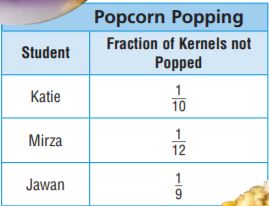
Three students each popped \(\frac{3}{4}\) cup of popcorn kernels. The table shows the fraction of each student’s kernels that did not pop. Which student had \(\frac{1}{16}\) cup unpopped kernels?
__________
Answer:
Mirza
Explanation:
Three students each popped \(\frac{3}{4}\) cup of popcorn kernels. The table shows the fraction of each student’s kernels that did not pop.
Katie = 3/4 x 1/10 = 3/40
Mirza = 3/4 x 1/12 = 1/16
Question 15.
The jogging track at Francine’s school is \(\frac{3}{4}\) mile long. Yesterday Francine completed two laps on the track. If she ran \(\frac{1}{3}\) of the distance and walked the remainder of the way, how far did she walk?
____ mile
Answer:
1 mile
Explanation:
Length of jogging track at Francine’s school = 3/4 mile
Let the distance covered by running be = x
Let the distance covered by walking be = y
Total number of laps completed by Francine = 2
Total distance covered by Francine = number of laps X distance covered in one lap
2 x 3/4 = 3/25 mile
Now,
distance covered by running = 1/3 of the total distance
x = 1/3 x 3/2
distance covered by walking y = total distance – distance covered by running
3/2 – x = 3/2 – 1/2 = 1 mile
Hence, Francine walked for 1 mile.
Question 16.
At a snack store, \(\frac{7}{12}\) of the customers bought pretzels and \(\frac{3}{10}\) of those customers bought low-salt pretzels. Bill states that \(\frac{7}{30}\) of the customers bought low-salt pretzels. Does Bill’s statement make sense? Explain.
Type below:
__________
Answer:
Bill’s statement does not make sense because it is incorrect:
7/12 customers bought pretzels.
3/10 Of those customers bought low salt pretzels (x)
3/10 of 7/12 = x
21/120 = x
Simplify: 7/40
To be correct, Bill would have to say that 7/40 of the customers bought low salt pretzels, but instead, he had said 7/30.
Question 17.
The table shows Tonya’s homework assignment. Tonya’s teacher instructed the class to simplify each expression by dividing the numerator and denominator by the GCF. Complete the table by simplifying each expression and then finding the value.
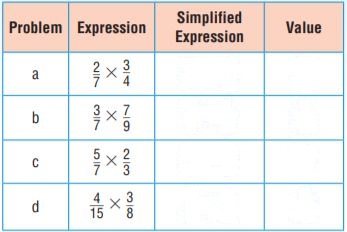
Type below:
__________
Answer:
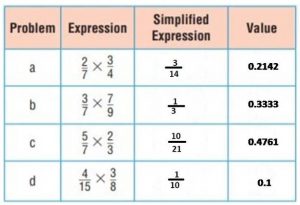
Simplify Factors – Page No. 91
Find the product. Simplify before multiplying.
Question 1.
\(\frac{8}{9} \times \frac{5}{12}\)
\(\frac{□}{□}\)
Answer:
\(\frac{10}{27}\)
Explanation:
\(\frac{8}{9} \times \frac{5}{12}\)
Multiply the numerators and Multiply the denominators.
\(\frac{8 × 5}{9 × 12}\) = \(\frac{40}{108}\)
Simplify using the GCF.
The GCF of 40 and 108 is 4.
Divide the numerator and the denominator by 4.
\(\frac{40 ÷ 4}{108 ÷ 4}\) = \(\frac{10}{27}\)
Question 2.
\(\frac{3}{4} \times \frac{16}{21}\)
\(\frac{□}{□}\)
Answer:
\(\frac{4}{7}\)
Explanation:
\(\frac{3}{4} \times \frac{16}{21}\)
Multiply the numerators and Multiply the denominators.
\(\frac{3 × 16}{4 × 21}\) = \(\frac{48}{84}\)
Simplify using the GCF.
The GCF of 48 and 84 is 12.
Divide the numerator and the denominator by 12.
\(\frac{48 ÷ 12}{84 ÷ 12}\) = \(\frac{4}{7}\)
Question 3.
\(\frac{15}{20} \times \frac{2}{5}\)
\(\frac{□}{□}\)
Answer:
\(\frac{3}{10}\)
Explanation:
\(\frac{15}{20} \times \frac{2}{5}\)
Multiply the numerators and Multiply the denominators.
\(\frac{15 × 2}{20 × 5}\) = \(\frac{30}{100}\)
Simplify using the GCF.
The GCF of 30 and 100 is 10.
Divide the numerator and the denominator by 10.
\(\frac{30 ÷ 10}{100 ÷ 10}\) = \(\frac{3}{10}\)
Question 4.
\(\frac{9}{18} \times \frac{2}{3}\)
\(\frac{□}{□}\)
Answer:
\(\frac{1}{3}\)
Explanation:
\(\frac{9}{18} \times \frac{2}{3}\)
Multiply the numerators and Multiply the denominators.
\(\frac{9 × 2}{18 × 3}\) = \(\frac{18}{54}\)
Simplify using the GCF.
The GCF of 18 and 54 is 18.
Divide the numerator and the denominator by 18.
\(\frac{18 ÷ 18}{54 ÷ 18}\) = \(\frac{1}{3}\)
Question 5.
\(\frac{3}{4} \times \frac{7}{30}\)
\(\frac{□}{□}\)
Answer:
\(\frac{7}{40}\)
Explanation:
\(\frac{3}{4} \times \frac{7}{30}\)
Multiply the numerators and Multiply the denominators.
\(\frac{3 × 7}{4 × 30}\) = \(\frac{21}{120}\)
Simplify using the GCF.
The GCF of 21 and 120 is 3.
Divide the numerator and the denominator by 3.
\(\frac{21 ÷ 3}{120 ÷ 3}\) = \(\frac{7}{40}\)
Question 6.
\(\frac{8}{15} \times \frac{15}{32}\)
\(\frac{□}{□}\)
Answer:
\(\frac{1}{4}\)
Explanation:
\(\frac{8}{15} \times \frac{15}{32}\)
Multiply the numerators and Multiply the denominators.
\(\frac{8 × 15}{15 × 32}\) = \(\frac{120}{480}\)
Simplify using the GCF.
The GCF of 120 and 480 is 120.
Divide the numerator and the denominator by 120.
\(\frac{120 ÷ 120}{480 ÷ 120}\) = \(\frac{1}{4}\)
Question 7.
\(\frac{12}{21} \times \frac{7}{9}\)
\(\frac{□}{□}\)
Answer:
\(\frac{4}{9}\)
Explanation:
\(\frac{12}{21} \times \frac{7}{9}\)
Multiply the numerators and Multiply the denominators.
\(\frac{12 × 7}{21 × 9}\) = \(\frac{84}{189}\)
Simplify using the GCF.
The GCF of 84 and 189 is 21.
Divide the numerator and the denominator by 21.
\(\frac{84 ÷ 21}{189 ÷ 21}\) = \(\frac{4}{9}\)
Question 8.
\(\frac{18}{22} \times \frac{8}{9}\)
\(\frac{□}{□}\)
Answer:
\(\frac{8}{11}\)
Explanation:
\(\frac{18}{22} \times \frac{8}{9}\)
Multiply the numerators and Multiply the denominators.
\(\frac{18 × 8}{22 × 9}\) = \(\frac{144}{198}\)
Simplify using the GCF.
The GCF of 144 and 198 is 18.
Divide the numerator and the denominator by 18.
\(\frac{144 ÷ 18}{198 ÷ 18}\) = \(\frac{8}{11}\)
Problem Solving
Question 9.
Amber has a \(\frac{4}{5}\)-pound bag of colored sand. She uses \(\frac{1}{2}\) of the bag for an art project. How much sand does she use for the project?
\(\frac{□}{□}\) pounds
Answer:
\(\frac{2}{5}\) pounds
Explanation:
Amber has a \(\frac{4}{5}\)-pound bag of colored sand. She uses \(\frac{1}{2}\) of the bag for an art project.
4/5 X 1/2 = 2/5
Question 10.
Tyler has \(\frac{3}{4}\) month to write a book report. He finished the report in \(\frac{2}{3}\) that time. How much time did it take Tyler to write the report?
\(\frac{□}{□}\) month
Answer:
\(\frac{1}{2}\) month
Explanation:
Tyler has \(\frac{3}{4}\) month to write a book report. He finished the report in \(\frac{2}{3}\) that time.
3/4 X 2/3 = 1/2
Question 11.
Show two ways to multiply \(\frac{2}{15} \times \frac{3}{20}\). Then tell which way is easier and justify your choice.
Type below:
__________
Answer:
\(\frac{2}{15} \times \frac{3}{20}\)
2/15 X 3/20 = 2/20 X 3/15 = 1/10 X 1/5 = 1/50
Lesson Check – Page No. 92
Find each product. Simplify before multiplying.
Question 1.
At Susie’s school, \(\frac{5}{8}\) of all students play sports. Of the students who play sports, \(\frac{2}{5}\) play soccer. What fraction of the students in Susie’s school play soccer?
\(\frac{□}{□}\)
Answer:
\(\frac{1}{4}\)
Explanation:
At Susie’s school, \(\frac{5}{8}\) of all students play sports. Of the students who play sports, \(\frac{2}{5}\) play soccer.
Multiply 5/8 X 2/5, and the answer is 0.25, which converts to 25/100 or 1/4
Question 2.
A box of popcorn weighs \(\frac{15}{16}\) pounds. The box contains \(\frac{1}{3}\) buttered popcorn and \(\frac{2}{3}\) cheesy popcorn. How much does the cheesy popcorn weigh?
\(\frac{□}{□}\)
Answer:
\(\frac{5}{8}\)
Explanation:
Total weight of a box of popcorn =15/16 pounds.
We are given two types of popcorns are there, butter popcorns and cheesy popcorns.
Butter popcorn is the one-third of the total weight = 1/3 of the Total weight
Plugging the value of the total weight, we get
= 1/3 * 15/16 = 5/16 pounds.
Cheesy popcorn = 2/3 of Total weight
Plugging the value of total weight, we get
= 2/3 * 15/16 = 10/16 or 5/8 pounds.
Therefore, cheesy popcorn weighs is 5/8 pounds.
Spiral Review
Question 3.
Ramòn bought a dozen ears of corn for $1.80. What was the cost of each ear of corn?
$ ______
Answer:
$0.15
Explanation:
Ramòn bought a dozen ears of corn for $1.80.
So, for the cost of each ear of corn, $1.80/12 = $0.15
Question 4.
A 1.8-ounce jar of cinnamon costs $4.05. What is the cost per ounce?
$ ______
Answer:
$2.25 per ounce
Explanation:
If a 1.8-ounce jar costs $4.05, do $4.05 divided by 1.8.
$4.05 / 1.8 = $2.25 per ounce.
Question 5.
Rose bought \(\frac{7}{20}\) kilogram of ginger candy and 0.4 kilogram of cinnamon candy. Which did she buy more of? Explain how you know.
Type below:
__________
Answer:
Rose bought ginger candy = 7/20 kilogram = 0.35 Kilogram
She bought cinnamon candy = 0.4 kilogram
0.4 > 0.35
Therefore, She bought cinnamon candy more.
Question 6.
Don walked 3 \(\frac{3}{5}\) miles on Friday, 3.7 miles on Saturday, and 3 \(\frac{5}{8}\) miles on Sunday. List the distances from least to greatest.
Type below:
__________
Answer:
3 \(\frac{3}{5}\), 3 \(\frac{5}{8}\), 3.7
Explanation:
3 \(\frac{3}{5}\) = 18/5 = 3.6
3 \(\frac{5}{8}\) = 29/8 = 3.625
3.6 < 3.625 < 3.7
3 \(\frac{3}{5}\), 3 \(\frac{5}{8}\), 3.7
Mid-Chapter Checkpoint – Vocabulary – Page No. 93
Choose the best term from the box to complete the sentence.
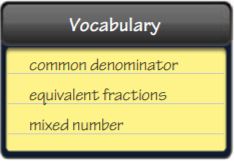
Question 1.
The fractions \(\frac{1}{2}\) and \(\frac{5}{10}\) are _____.
Type below:
__________
Answer:
Equivalent fractions
Question 2.
A _____ is a denominator that is the same in two or more fractions.
Type below:
__________
Answer:
Common Denominator
Concepts and Skills
Write as a decimal. Tell whether you used division, a number line, or some other method.
Question 3.
\(\frac{7}{20}\)
_____
Answer:
0.35
Explanation:
By using Division,
\(\frac{7}{20}\) = 0.35
Question 4.
8 \(\frac{39}{40}\)
_____
Answer:
8.975
Explanation:
By using Division,
8 \(\frac{39}{40}\) = 359/40 = 8.975
Question 5.
1 \(\frac{5}{8}\)
_____
Answer:
1.625
Explanation:
By using Division,
1 \(\frac{5}{8}\) = 13/8 = 1.625
Question 6.
\(\frac{19}{25}\)
_____
Answer:
0.76
Explanation:
By using Division,
\(\frac{19}{25}\) = 0.76
Order from least to greatest.
Question 7.
\(\frac{4}{5}, \frac{3}{4}, 0.88\)
Type below:
__________
Answer:
\(\frac{3}{4}\), \(\frac{4}{5}\),0.88
Explanation:
Write the decimal form of 4/5 = 0.8
Write the decimal form of 3/4 = 0.75
0.88
0.75 < 0.8 < 0.88
Question 8.
0.65, 0.59, \(\frac{3}{5}\)
Type below:
__________
Answer:
0.59, \(\frac{3}{5}\), 0.65
Explanation:
Write the decimal form of 3/5 = 0.6
0.59 < 0.6 < 0.65
Question 9.
\(1 \frac{1}{4}, 1 \frac{2}{3}, \frac{11}{12}\)
Type below:
__________
Answer:
\(\frac{11}{12}\), 1\(\frac{1}{4}\), 1\(\frac{2}{3}\)
Explanation:
Write the decimal form of 1 1/4 = 5/4 = 1.25
Write the decimal form of 1 2/3 = 5/3 = 1.66
Write the decimal form of 11/12 = 0.916
0.916 < 1.25 < 1.66
Question 10.
0.9, \(\frac{7}{8}\), 0.86
Type below:
__________
Answer:
0.86, \(\frac{7}{8}\), 0.9
Explanation:
Write the decimal form of \(\frac{7}{8}\) = 0.875
0.86 < 0.875 < 0.9
Find the product. Write it in simplest form.
Question 11.
\(\frac{2}{3} \times \frac{1}{8}\)
\(\frac{□}{□}\)
Answer:
\(\frac{1}{12}\)
Explanation:
\(\frac{2}{3} \times \frac{1}{8}\)
Multiply the numerators and Multiply the denominators.
\(\frac{2 × 1}{3 × 8}\) = \(\frac{2}{24}\)
Simplify using the GCF.
The GCF of 2 and 24 is 2.
Divide the numerator and the denominator by 2.
\(\frac{2 ÷ 2}{24 ÷ 2}\) = \(\frac{1}{12}\)
Question 12.
\(\frac{4}{5} \times \frac{2}{5}\)
\(\frac{□}{□}\)
Answer:
\(\frac{8}{25}\)
Explanation:
\(\frac{4}{5} \times \frac{2}{5}\)
Multiply the numerators and Multiply the denominators.
\(\frac{4 × 2}{5 × 5}\) = \(\frac{8}{25}\)
Question 13.
12 × \(\frac{3}{4}\)
_____
Answer:
9
Explanation:
12 × \(\frac{3}{4}\)
Multiply the numerators and Multiply the denominators.
\(\frac{12 × 3}{1 × 4}\) = \(\frac{36}{4}\) = 9
Question 14.
Mia climbs \(\frac{5}{8}\) of the height of the rock wall. Lee climbs \(\frac{4}{5}\) of Mia’s distance. What fraction of the wall does Lee climb?
\(\frac{□}{□}\)
Answer:
\(\frac{7}{40}\)
Explanation:
find the LCM (least common denominator) for 5/8 and 4/5.
5/8= 25/40 and 4/5= 32/40.
Subtract and you get 7/40.
Page No. 94
Question 15.
In Zoe’s class, \(\frac{4}{5}\) of the students have pets. Of the students who have pets, \(\frac{1}{8}\) have rodents. What fraction of the students in Zoe’s class have pets that are rodents? What fraction of the students in Zoe’s class have pets that are not rodents?
Type below:
__________
Answer:
\(\frac{1}{10}\) of the students in Zoe’s class have pets that are rodents
\(\frac{7}{10}\) of the students in Zoe’s class have pets that are not rodents
Explanation:
In Zoe’s class, \(\frac{4}{5}\) of the students have pets. Of the students who have pets, \(\frac{1}{8}\) have rodents.
4/5 X 1/8 = 1/10
4/5 – 1/10 = 7/10
Question 16.
A recipe calls for 2 \(\frac{2}{3}\) cups of flour. Terell wants to make \(\frac{3}{4}\) of the recipe. How much flour should he use?
_____ cups
Answer:
2 cups
Explanation:
2 \(\frac{2}{3}\) = 8/3
8/3 * 3/4 = 2
Question 17.
Following the Baltimore Running Festival in 2009, volunteers collected and recycled 3.75 tons of trash. Graph 3.75 on a number line and write the weight as a mixed number.
Type below:
__________
Answer:
Volunteers collected and recycled 3.75 tons of trash.
We need to convert 3.75 as a mixed number.
The mixed number consists of a whole number and a proper fraction.
In the given number 3.75, 3 as the whole number and convert 0.75 to a fraction.
3.75 = 3 + 0.75 = 3 + 75/100
We can reduce the fraction 75/ 100 = 3+ 3/4 = 3 3/4
Question 18.
Four students took an exam. The fraction of the total possible points that each received is given. Which student had the highest score? If students receive a whole number of points on every exam item, can the exam be worth a total of 80 points? Explain.
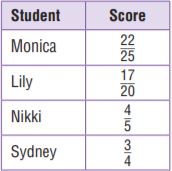
Type below:
__________
Answer:
22/25 = 0.88
17/20 = 0.85
4/5 = 0.8
3/4 = 0.75
Monica had the highest score
Let x be the total number of points:
(22/25 + 17/20 + 4/5 + 3/4)x = 80
x = 24.39
That is not a whole number of points.
Share and Show – Page No. 97
Use the model to find the quotient.
Question 1.
\(\frac{1}{2}\) ÷ 3

\(\frac{□}{□}\)
Answer:
\(\frac{1}{6}\)
Explanation:
1/2 groups of 3
\(\frac{1}{2}\) ÷ 3
1/2 × 1/3 = 1/6
Question 2.
\(\frac{3}{4} \div \frac{3}{8}\)

______
Answer:
2
Explanation:
3/4 groups of 3/8
3/4 × 8/3 = 2
Use fraction strips to find the quotient. Then draw the model.
Question 3.
\(\frac{1}{3}\) ÷ 4
\(\frac{□}{□}\)
Answer:
\(\frac{1}{12}\)
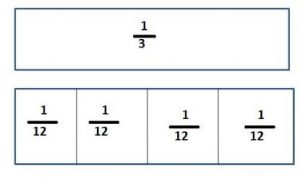
Explanation:
\(\frac{1}{3}\) ÷ 4
\(\frac{1}{3}\) × \(\frac{1}{4}\)
\(\frac{1}{12}\)
Question 4.
\(\frac{3}{5} \div \frac{3}{10}\)
______
Answer:
2
Explanation:
\(\frac{3}{5} \div \frac{3}{10}\)
\(\frac{3}{5}\) × \(\frac{10}{3}\)
2
Draw a model to solve. Then write an equation for the model. Interpret the result.
Question 5.
How many \(\frac{1}{4}\) cup servings of raisins are in \(\frac{3}{8}\) cup of raisins?
Type below:
__________
Answer:
1.5
Explanation:
3/8 × 1/4 = 1.5
Question 6.
How many \(\frac{1}{3}\) lb bags of trail mix can Josh make from \(\frac{5}{6}\) lb of trail mix?
Type below:
__________
Answer:
2
Explanation:
Multiply 1/3 with 2
1/3 × 2 = 2/6. 2/6 can go into 5/6 twice so the answer is two bags.
Question 7.
Pose a Problem Write and solve a problem for \(\frac{3}{4}\) ÷ 3 that represents how much in each of 3 groups.
Type below:
__________
Answer:
\(\frac{1}{4}\)
Explanation:
\(\frac{3}{4}\) ÷ 3
\(\frac{3}{4}\) × \(\frac{1}{3}\) = 1/4
Problem Solving + Applications – Page No. 98
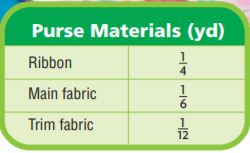
The table shows the amount of each material that students in a sewing class need for one purse.
Use the table for 8–10. Use models to solve.
Question 8.
Mrs. Brown has \(\frac{1}{3}\) yd of blue denim and \(\frac{1}{2}\) yd of black denim. How many purses can be made using denim as the main fabric?
_____ purses
Answer:
5 purses
Explanation:
Mrs. Brown has \(\frac{1}{3}\) yd of blue denim and \(\frac{1}{2}\) yd of black denim.
3 + 2 = 5
Question 9.
One student brings \(\frac{1}{2}\) yd of ribbon. If 3 students receive an equal length of the ribbon, how much ribbon will each student receive? Will each of them have enough ribbon for a purse? Explain.
Type below:
__________
Answer:
One student brings \(\frac{1}{2}\) yd of ribbon. If 3 students receive an equal length of the ribbon,
\(\frac{1}{2}\) ÷ 3
1/2 × 1/3 = 1/6
They don’t have enough ribbon for a purse
Question 10.
Make Arguments There was \(\frac{1}{2}\) yd of purple and pink striped fabric. Jessie said she could only make \(\frac{1}{24}\) of a purse using that fabric as the trim. Is she correct? Use what you know about the meanings of multiplication and division to defend your answer.
Type below:
__________
Answer:
There was \(\frac{1}{2}\) yd of purple and pink striped fabric. Jessie said she could only make \(\frac{1}{24}\) of a purse using that fabric as the trim.
1/2 × 12 = 1/24
So, 12 is the answer
Question 11.
Draw a model to find the quotient.
\(\frac{1}{2}\) ÷ 4 =
Type below:
__________
Answer:
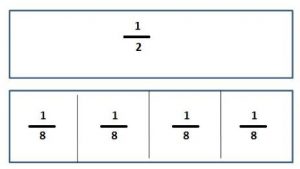
Explanation:
1/2 × 1/4 = 1/8
Model Fraction Division – Page No. 99
Use the model to find the quotient
Question 1.
\(\frac{1}{4}\) ÷ 3 =

\(\frac{□}{□}\)
Answer:
\(\frac{1}{12}\)
Explanation:
\(\frac{1}{4}\) ÷ 3
\(\frac{1}{4}\) × \(\frac{1}{3}\) = \(\frac{1}{12}\)
Question 2.
\(\frac{1}{2} \div \frac{2}{12}=\)

______
Answer:
3
Explanation:
\(\frac{1}{2} \div \frac{2}{12}=\)
\(\frac{1}{2}\) × \(\frac{12}{2}\) = \(\frac{12}{4}\) = 3
Use fraction strips to find the quotient.
Question 3.
\(\frac{5}{6} \div \frac{1}{2}=\)
______ \(\frac{□}{□}\)
Answer:
\(\frac{5}{3}\)
Explanation:
\(\frac{5}{6} \div \frac{1}{2}=\)
\(\frac{5}{6}\) × \(\frac{2}{1}\) = \(\frac{5}{3}\)
Question 4.
\(\frac{2}{3}\) ÷ 4 =
\(\frac{□}{□}\)
Answer:
\(\frac{1}{6}\)
Explanation:
\(\frac{2}{3}\) ÷ 4
\(\frac{2}{3}\) × \(\frac{1}{4}\) = \(\frac{2}{12}\) = 1/6
Question 5.
\(\frac{1}{2}\) ÷ 6 =
\(\frac{□}{□}\)
Answer:
\(\frac{1}{12}\)
Explanation:
\(\frac{1}{2}\) ÷ 6
\(\frac{1}{2}\) × \(\frac{1}{6}\) = \(\frac{1}{12}\)
Question 6.
\(\frac{1}{3} \div \frac{1}{12}\)
______
Answer:
4
Explanation:
\(\frac{1}{3} \div \frac{1}{12}\)
\(\frac{1}{3}\) × \(\frac{12}{1}\) = \(\frac{12}{3}\) = 4
Draw a model to solve. Then write an equation for the model. Interpret the result.
Question 7.
If Jerry runs \(\frac{1}{10}\) mile each day, how many days will it take for him to run \(\frac{4}{5}\) mile?
______ days
Answer:
8 days
Explanation:
If Jerry runs \(\frac{1}{10}\) mile each day,
\(\frac{4}{5}\) ÷ \(\frac{1}{10}\)
\(\frac{4}{5}\) × \(\frac{10}{1}\) = \(\frac{40}{5}\) = 8
Problem Solving
Question 8.
Mrs. Jennings has \(\frac{3}{4}\) gallon of paint for an art project. She plans to divide the paint equally into jars. If she puts \(\frac{1}{8}\) gallon of paint into each jar, how many jars will she use?
______ jars
Answer:
6 jars
Explanation:
Mrs. Jennings has 3/4 Gallons of paint for an art project.
In 1 jar she puts 1/8 gallon of paint.
The number of jars in which she plans to to divide the paint equally is given by,
n= 3/4 ÷ 1/8
n = \(\frac{3}{4}\) × \(\frac{8}{1}\) = \(\frac{24}{4}\) = 6
Question 9.
If one jar of glue weighs \(\frac{1}{12}\) pound, how many jars can Rickie get from \(\frac{2}{3}\) pound of glue?
______ jars
Answer:
8 jars
Explanation:
The weight of glue in one jar = 1/12 pound
To get 2/3 pound of glue Rickie can get the number of jars
2/3 ÷ 1/12
2/3 × 12/1 = 24/3 = 8
Question 10.
Explain how to use a model to show \(\frac{2}{6} \div \frac{1}{12}\) and \(\frac{2}{6}\) ÷ 4.
Type below:
__________
Answer:
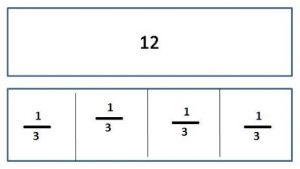

Explanation:
\(\frac{2}{6} \div \frac{1}{12}\)
2/6 = 1/3
1/3 x 12/1 = 4
\(\frac{2}{6}\) ÷ 4
1/3 x 1/4 = 1/12
Lesson Check – Page No. 100
Question 1.
Darcy needs \(\frac{1}{4}\) yard of fabric to make a banner. She has 2 yards of fabric. How many banners can she make?
______ banners
Answer:
8 banners
Explanation:
Darcy needs \(\frac{1}{4}\) yard of fabric to make a banner. She has 2 yards of fabric.
2 ÷ \(\frac{1}{4}\) = 2 x 4 = 8
Question 2.
Lorenzo bought \(\frac{15}{16}\) pounds of ground beef. He wants to make hamburgers that weigh \(\frac{3}{16}\) pound each. How many hamburgers can he make?
______ hamburgers
Answer:
5 hamburgers
Explanation:
Lorenzo bought \(\frac{15}{16}\) pounds of ground beef. He wants to make hamburgers that weigh \(\frac{3}{16}\) pound each.
\(\frac{15}{16}\) ÷ \(\frac{3}{16}\)
15/3 = 5
Spiral Review
Question 3.
Letisha wants to read 22 pages a night. At that rate, how long will it take her to read a book with 300 pages?
______ nights
Answer:
14 nights
Explanation:
Letisha wants to read 22 pages a night. It takes her to read a book with 300 pages
300/22 = 13.6
13.6 is near to 14
So, it is for 2 weeks.
Question 4.
A principal wants to order enough notebooks for 624 students. The notebooks come in boxes of 28. How many boxes should he order?
______ boxes
Answer:
22 boxes
Explanation:
A principal wants to order enough notebooks for 624 students. The notebooks come in boxes of 28.
624/28 = 22.2857
22.2857 is closer to 22
22 boxes.
Question 5.
Each block in Ton’s neighborhood is \(\frac{2}{3}\) mile long. If he walks 4 \(\frac{1}{2}\) blocks, how far does he walk?
______ miles
Answer:
3 miles
Explanation:
If each block is 2/3 miles long, and he walks 4 1/2 blocks, we can simply multiply to two. It looks like this:
(2/3)(4 1/2)
to multiply, make 4 1/2 into an improper fraction and multiply normally
(2/3)(9/4)
Ton walks 3 miles total.
Question 6.
In Cathy’s garden, \(\frac{5}{6}\) of the area is planted with flowers. Of the flowers, \(\frac{3}{10}\) of them are red. What fraction of Cathy’s garden is planted with red flowers?
\(\frac{□}{□}\)
Answer:
\(\frac{1}{4}\)
Explanation:
In Cathy’s garden, \(\frac{5}{6}\) of the area is planted with flowers. Of the flowers, \(\frac{3}{10}\) of them are red.
5/6 x 3/10 = 1/4
Share and Show – Page No. 103
Estimate using compatible numbers.
Question 1.
\(22 \frac{4}{5} \div 6 \frac{1}{4}\)
_______
Answer:
4
Explanation:
22 \(\frac{4}{5}\) = 114/5 = 22.8
6 \(\frac{1}{4}\) = 25/4 = 6.25
22.8 is closer to 24
6.25 is closer to 6
24/6 = 4
Question 2.
\(12 \div 3 \frac{3}{4}\)
_______
Answer:
3
Explanation:
3 \(\frac{3}{4}\) = 15/4 = 3.75
3.75 is closer to 4
12/4 = 3
Question 3.
\(33 \frac{7}{8} \div 5 \frac{1}{3}\)
_______
Answer:
7
Explanation:
33 \(\frac{7}{8}\) = 271/8 = 33.875
5 \(\frac{1}{3}\) = 16/3 = 5.333
33.875 is closer to 35
5.333 is closer to 5
35/5 = 7
Question 4.
\(3 \frac{7}{8} \div \frac{5}{9}\)
_______
Answer:
4
Explanation:
3 \(\frac{7}{8}\) = 31/8 = 3.875
\(\frac{5}{9}\) = 0.555
3.875 is closer to 4
0.555 is closer to 1
4/1 = 4
Question 5.
\(34 \frac{7}{12} \div 7 \frac{3}{8}\)
_______
Answer:
5
Explanation:
34 \(\frac{7}{12}\) = 415/12 = 34.583
7 \(\frac{3}{8}\) = 59/8 = 7.375
34.583 is closer to 35
7.375 is closer to 7
35/7 = 5
Question 6.
\(1 \frac{2}{9} \div \frac{1}{6}\)
_______
Answer:
5
Explanation:
1 \(\frac{2}{9}\) = 11/9 = 1.222
\(\frac{1}{6}\) = 0.1666
1.222 is closer to 1
0.1666 is closer to 0.2
1/0.2 = 5
On Your Own
Estimate using compatible numbers.
Question 7.
\(44 \frac{1}{4} \div 11 \frac{7}{9}\)
_______
Answer:
4
Explanation:
44 \(\frac{1}{4}\) = 177/4 = 44.25
11 \(\frac{7}{9}\) = 106/9 = 11.77
44.25 is closer to 44
11.77 is closer to 11
44/11 = 4
Question 8.
\(71 \frac{11}{12} \div 8 \frac{3}{4}\)
_______
Answer:
8
Explanation:
71 \(\frac{11}{12}\) = 863/12 = 71.916
8 \(\frac{3}{4}\) = 35/4 = 8.75
71.916 is closer to 72
8.75 is closer to 9
72/9 = 8
Question 9.
\(1 \frac{1}{6} \div \frac{1}{8}\)
_______
Answer:
12
Explanation:
1 \(\frac{1}{6}\) = 7/6 = 1.166
\(\frac{1}{8}\) = 0.125
1.166 is closer to 1.2
0.125 is closer to 0.1
1.2/0.1 = 12
Estimate to compare. Write <, >, or =.
Question 10.
\(21 \frac{3}{10} \div 2 \frac{5}{6}\) _______ \(35 \frac{7}{9} \div 3 \frac{2}{3}\)
Answer:
\(21 \frac{3}{10} \div 2 \frac{5}{6}\) < \(35 \frac{7}{9} \div 3 \frac{2}{3}\)
Explanation:
21 \(\frac{3}{10}\) = 213/10 = 21.3
2 \(\frac{5}{6}\) = 17/6 = 2.833
21.3 is closer to 21
2.833 is closer to 3
21/3 = 7
35 \(\frac{7}{9}\) = 322/9 = 35.777
3 \(\frac{2}{3}\) = 11/3 = 3.666
35.777 is closer to 36
3.666 is closer to 4
36/4 = 9
7 < 9
So, \(21 \frac{3}{10} \div 2 \frac{5}{6}\) < \(35 \frac{7}{9} \div 3 \frac{2}{3}\)
Question 11.
\(29 \frac{4}{5} \div 5 \frac{1}{6}\) _______ \(27 \frac{8}{9} \div 6 \frac{5}{8}\)
Answer:
\(29 \frac{4}{5} \div 5 \frac{1}{6}\) > \(27 \frac{8}{9} \div 6 \frac{5}{8}\)
Explanation:
29 \(\frac{4}{5}\) = 149/5 = 29.8
5 \(\frac{1}{6}\) = 31/6 = 5.1666
29.8 is closer to 30
5.1666 is closer to 5
30/5 = 6
27 \(\frac{8}{9}\) = 251/9 = 27.888
6 \(\frac{5}{8}\) = 53/8 = 6.625
27.888 is closer to 30
6.625 is closer 7
30/7 = 5
6 > 5
\(29 \frac{4}{5} \div 5 \frac{1}{6}\) > \(27 \frac{8}{9} \div 6 \frac{5}{8}\)
Question 12.
\(55 \frac{5}{6} \div 6 \frac{7}{10}\) _______ \(11 \frac{5}{7} \div \frac{5}{8}\)
Answer:
\(55 \frac{5}{6} \div 6 \frac{7}{10}\) < \(11 \frac{5}{7} \div \frac{5}{8}\)
Explanation:
55 \(\frac{5}{6}\) = 335/6 = 55.833
6 \(\frac{7}{10}\) = 67/10 = 6.7
55.833 is closer to 56
6.7 is closer to 7
56/7 = 8
11 \(\frac{5}{7}\) = 82/7 = 11.714
\(\frac{5}{8}\) = 0.625
11.714 is closer to 12
0.625 is closer to 1
12/1 = 12
8 < 12
Question 13.
Marion is making school flags. Each flag uses 2 \(\frac{3}{4}\) yards of felt. Marion has 24 \(\frac{1}{8}\) yards of felt. About how many flags can he make?
About _______ flags
Answer:
About 8 flags
Explanation:
Marion is making school flags. Each flag uses 2 \(\frac{3}{4}\) yards of felt. Marion has 24 \(\frac{1}{8}\) yards of felt.
2 \(\frac{3}{4}\) = 11/4
24 \(\frac{1}{8}\) = 193/8
193/8 ÷ 11/4
193/8 x 4/11 = 8.77
About 8 flags
Question 14.
A garden snail travels about 2 \(\frac{3}{5}\) feet in 1 minute. At that speed, about how many hours would it take the snail to travel 350 feet?
About _______ hours
Answer:
About 2 hours
Explanation:
2 \(\frac{3}{5}\) = 2.6
That’s how long he travels in one minute. There are 60 minutes in an hour so multiply it by 60 and see if that gets you close to 350.
60 x 2.6 = 156
Now let’s add one more hour.
156 + 156 = 312
14 x 2.6 = 36.4
312 + 36.4 = 348.4
348.4 + 2.6 = 351
So two hours and fourteen minutes
Problem Solving + Applications – Page No. 104
What’s the Error?
Question 15.
Megan is making pennants from a piece of butcher paper that is 10 \(\frac{3}{8}\) yards long. Each pennant requires \(\frac{3}{8}\) yard of paper. To estimate the number of pennants she could make, Megan estimated the quotient 10 \(\frac{3}{8}\) ÷ \(\frac{3}{8}\).
Look at how Megan solved the problem. Find her error
Estimate:
10 \(\frac{3}{8}\) ÷ \(\frac{3}{8}\)
10 ÷ \(\frac{1}{2}\) = 5
Correct the error. Estimate the quotient.
So, Megan can make about _____ pennants.
Describe the error that Megan made
Explain Tell which compatible numbers you used to estimate 10 \(\frac{3}{8}\) ÷ \(\frac{3}{8}\). Explain why you chose those numbers.
Type below:
__________
Answer:
10 \(\frac{3}{8}\) ÷ \(\frac{3}{8}\)
10 \(\frac{3}{8}\) = 83/8 = 10.375
\(\frac{3}{8}\) = 0.375
She had written 10 ÷ \(\frac{1}{2}\) = 5
10.375 is closer to 10
0.375 is closer to 0.5
10/0.5 = 20
But she has written 5 instead of 20.
Megan can make about 20 pennants.
For numbers 16a–16c, estimate to compare. Choose <, >, or =.
Question 16.
16a. 18 \(\frac{3}{10} \div 2 \frac{5}{6}\) ? \(30 \frac{7}{9} \div 3 \frac{1}{3}\)
_____
Answer:
16a. 18 \(\frac{3}{10} \div 2 \frac{5}{6}\) < \(30 \frac{7}{9} \div 3 \frac{1}{3}\)
Explanation:
18 \(\frac{3}{10}\) = 183/10 = 18.3
2 \(\frac{5}{6}\) = 17/6 = 2.833
18.3 is closer to 18
2.833 is closer to 3
18/3 = 6
30 \(\frac{7}{9}\) = 277/9 = 30.777
3 \(\frac{1}{3}\) = 10/3 = 3.333
30.777 is closer to 30
3.333 is closer to 3
30/3 = 10
6 < 10
Question 16.
16b. 17 \(\frac{4}{5} \div 6 \frac{1}{6}\) ? \(19 \frac{8}{9} \div 4 \frac{5}{8}\)
_____
Answer:
17 \(\frac{4}{5} \div 6 \frac{1}{6}\) < \(19 \frac{8}{9} \div 4 \frac{5}{8}\)
Explanation:
17 \(\frac{4}{5}\) = 89/5 = 17.8
6 \(\frac{1}{6}\) = 37/6 = 6.1666
17.8 is closer to 18
6.1666 is closer to 6
18/6 = 3
19 \(\frac{8}{9}\) = 179/9 = 19.888
4 \(\frac{5}{8}\) = 37/8 = 4.625
19.888 is closer to 20
4.625 is closer to 5
20/5 = 4
3 < 4
17 \(\frac{4}{5} \div 6 \frac{1}{6}\) < \(19 \frac{8}{9} \div 4 \frac{5}{8}\)
Question 16.
16c. 17 \(\frac{5}{6} \div 6 \frac{1}{4}\) ? \(11 \frac{5}{7} \div 2 \frac{3}{4}\)
_____
Answer:
17 \(\frac{5}{6} \div 6 \frac{1}{4}\) < \(11 \frac{5}{7} \div 2 \frac{3}{4}\)
Explanation:
17 \(\frac{5}{6}\) = 107/6 = 17.833
6 \(\frac{1}{4}\) = 25/4 = 6.25
17.833 is closer to 18
6.25 is closer to 6
18/6 = 3
11 \(\frac{5}{7}\) = 82/7 = 11.714
2 \(\frac{3}{4}\) = 11/4 = 2.75
11.714 is closer to 12
2.75 is closer to 3
12/3 = 4
3 < 4
17 \(\frac{5}{6} \div 6 \frac{1}{4}\) < \(11 \frac{5}{7} \div 2 \frac{3}{4}\)
Estimate Quotients – Page No. 105
Estimate using compatible numbers.
Question 1.
\(12 \frac{3}{16} \div 3 \frac{9}{10}\)
______
Answer:
3
Explanation:
12 \(\frac{3}{16}\) = 195/16 = 12.1875
3 \(\frac{9}{10}\) = 39/10 = 3.9
12.1875 is closer to 12
3.9 is closer to 4
12/4 = 3
Question 2.
\(15 \frac{3}{8} \div \frac{1}{2}\)
______
Answer:
30
Explanation:
15 \(\frac{3}{8}\) = 123/8 = 15.375
\(\frac{1}{2}\) = 0.5
15.375 is closer to 15
0.5 is closer to 0.5
15/0.5 = 30
Question 3.
\(22 \frac{1}{5} \div 1 \frac{5}{6}\)
______
Answer:
11
Explanation:
22 \(\frac{1}{5}\) = 111/5 = 22.2
1 \(\frac{5}{6}\) = 11/6 = 1.8333
22.2 is closer to 22
1.8333 is closer to 2
22/2 = 11
Question 4.
\(7 \frac{7}{9} \div \frac{4}{7}\)
______
Answer:
16
Explanation:
7 \(\frac{7}{9}\) = 70/9 = 7.777
\(\frac{4}{7}\) = 0.571
7.777 is closer to 8
0.571 is closer to 0.5
8/0.5 = 16
Question 5.
\(18 \frac{1}{4} \div 2 \frac{4}{5}\)
______
Answer:
6
Explanation:
18 \(\frac{1}{4}\) = 73/4 = 18.25
2 \(\frac{4}{5}\) = 14/5 = 2.8
18.25 is closer to 18
2.8 is closer to 3
18/3 = 6
Question 6.
\(\frac{15}{16} \div \frac{1}{7}\)
______
Answer:
10
Explanation:
\(\frac{15}{16}\) = 0.9375
\(\frac{1}{7}\) = 0.1428
0.9375 is closer to 1
0.1428 is closer to 0.1
1/0.1 = 10
Question 7.
\(14 \frac{7}{8} \div \frac{5}{11}\)
______
Answer:
30
Explanation:
14 \(\frac{7}{8}\) = 119/8 = 14.875
\(\frac{5}{11}\) = 0.4545
14.875 is closer to 15
0.4545 is closer to 0.5
15/0.5 = 30
Question 8.
\(53 \frac{7}{12} \div 8 \frac{11}{12}\)
______
Answer:
6
Explanation:
53 \(\frac{7}{12}\) = 643/12 = 53.58
8 \(\frac{11}{12}\) = 107/12 = 8.916
53.58 is closer to 54
8.916 is closer to 9
54/9 = 6
Question 9.
\(1 \frac{1}{6} \div \frac{1}{9}\)
______
Answer:
10
Explanation:
1 \(\frac{1}{6}\) = 7/6 = 1.166
\(\frac{1}{9}\) = 0.111
1.166 is closer to 1
0.111 is closer to 0.1
1/0.1 = 10
Problem Solving
Question 10.
Estimate the number of pieces Sharon will have if she divides 15 \(\frac{1}{3}\) yards of fabric into 4 \(\frac{4}{5}\) yard lengths.
About ______ pieces
Answer:
About 3 pieces
Explanation:
Sharon will have if she divides 15 \(\frac{1}{3}\) yards of fabric into 4 \(\frac{4}{5}\) yard lengths.
3 7/36 is the answer.
So, about 3 pieces
Question 11.
Estimate the number of \(\frac{1}{2}\) quart containers Ethan can fill from a container with 8 \(\frac{7}{8}\) quarts of water.
About ______ containers
Answer:
About 18 containers
Question 12.
How is estimating quotients different from estimating products?
Type below:
__________
Answer:
To estimate products and quotients, you need to first round the numbers. To round to the nearest whole number, look at the digit in the tenths place. If it is less than 5, round down. If it is 5 or greater, round up. Remember that an estimate is an answer that is not exact, but is approximate and reasonable.
Let’s look at an example of estimating a product.
Estimate the product: 11.256×6.81
First, round the first number. Since there is a 2 in the tenths place, 11.256 rounds down to 11.
Next, round the second number. Since there is an 8 in the tenths place, 6.81 rounds up to 7.
Then, multiply the rounded numbers. 11×7=77
The answer is 77.
Let’s look at an example of estimating a quotient.
Estimate the quotient: 91.93÷4.39
First, round the first number. Since there is a 9 in the tenths place, 91.93 rounds up to 92.
Next, round the second number. Since there is a 3 in the tenths place, 4.39 rounds down to 4.
Then, divide the rounded numbers.
92÷4=23
The answer is 23.
Lesson Check – Page No. 106
Question 1.
Each loaf of pumpkin bread calls for 1 \(\frac{3}{4}\) cups of raisins. About how many loaves can be made from 10 cups of raisins?
About ______ loaves
Answer:
About 5 loaves
Explanation:
Divide 10 by 1 3/4.
The answer is 5.714285
So you can make about 5 loaves of bread with 10 cups of raisins if each loaf needs 1 3/4 cups of raisins.
Question 2.
Perry’s goal is to run 2 \(\frac{1}{4}\) miles each day. One lap around the school track is \(\frac{1}{3}\) mile. About how many laps must he run to reach his goal?
About ______ laps
Answer:
About 9 laps
Explanation:
Perry’s goal is to run 2 \(\frac{1}{4}\) miles each day. One lap around the school track is \(\frac{1}{3}\) mile.
2 \(\frac{1}{4}\) = 9/4 = 2.25
\(\frac{1}{3}\) = 0.333
Perry will have to run 9 laps to reach his goal.
Spiral Review
Question 3.
A recipe calls for \(\frac{3}{4}\) teaspoon of red pepper. Uri wants to use \(\frac{1}{3}\) of that amount. How much red pepper should he use?
\(\frac{□}{□}\) teaspoon
Answer:
\(\frac{1}{4}\) teaspoon
Explanation:
A recipe calls for \(\frac{3}{4}\) teaspoon of red pepper. Uri wants to use \(\frac{1}{3}\) of that amount.
\(\frac{1}{3}\) of \(\frac{3}{4}\) = \(\frac{1}{4}\)
Question 4.
A recipe calls for 2 \(\frac{2}{3}\) cups of apple slices. Zoe wants to use 1 \(\frac{1}{2}\) times this amount. How many cups of apples should Zoe use?
______ cups
Answer:
4 cups
Explanation:
A recipe calls for 2 2/3 cups of apple slices.
Zoe wants to use 1 1/2 times this amount.
We will multiply the number of apple slices to 1 1/2
2 2/3 X 1 1/2
8/3 X3/2 = 24/6 = 4 cups
Zoe will use 4 cups of apple slices.
Question 5.
Edgar has 2.8 meters of rope. If he cuts it into 7 equal parts, how long will each piece be?
______ meters
Answer:
0.4 meters
Explanation:
2.8/7 = 0.4 meters
Question 6.
Kami has 7 liters of water to fill water bottles that each hold 2.8 liters. How many bottles can she fill?
______ bottles
Answer:
2 bottles
Explanation:
7/2.8 = 2.5
she can only fill 2 because anything over that would 8.4 liters of water
Share and Show – Page No. 109
Estimate. Then find the quotient.
Question 1.
\(\frac{5}{6}\) ÷ 3
\(\frac{□}{□}\)
Answer:
\(\frac{3}{10}\)
Explanation:
5/6 = 0.8333 is closer to 0.9
0.9/3 = 0.3 = 3/10
Use a number line to find the quotient.
Question 2.
\(\frac{3}{4} \div \frac{1}{8}\)
_______
Answer:
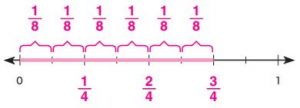
Explanation:
3/4 x 8 = 3 x 2 = 6
Question 3.
\(\frac{3}{5} \div \frac{3}{10}\)
_______
Answer:
Explanation:
3/5 x 10/3 = 2
Estimate. Then write the quotient in simplest form.
Question 4.
\(\frac{3}{4} \div \frac{5}{6}\)
\(\frac{□}{□}\)
Answer:
\(\frac{1}{1}\)
Explanation:
3/4 = 0.75 is closer to 0.8
5/6 = 0.8333 is closer to 0.8
0.8/0.8 = 1
Question 5.
\(3 \div \frac{3}{4}\)
_______
Answer:
4
Explanation:
3/4 = 0.75
3/0.75 = 4
Question 6.
\(\frac{1}{2} \div \frac{3}{4}\)
\(\frac{□}{□}\)
Answer:
\(\frac{625}{1000}\)
Explanation:
1/2 = 0.5
3/4 = 0.75 is closer to 0.8
0.5/0.8 = 0.625 = 625/1000
Question 7.
\(\frac{5}{12} \div 3\)
\(\frac{□}{□}\)
Answer:
\(\frac{2}{10}\)
Explanation:
5/12 = 0.4166 is closer to 0.6
0.6/3 = 0.2 = 2/10
On Your Own
Practice: Copy and Solve Estimate. Then write the quotient in simplest form
Question 8.
\(2 \div \frac{1}{8}\)
_______
Answer:
20
Explanation:
1/8 = 0.125 is closer to 0.1
2/0.1 = 20
Question 9.
\(\frac{3}{4} \div \frac{3}{5}\)
\(\frac{□}{□}\)
Answer:
\(\frac{1}{1}\)
Explanation:
3/4 = 0.75 is closer to 0.8
3/5 = is 0.6 closer to 0.8
0.8/0.8 = 1
Question 10.
\(\frac{2}{5} \div 5\)
\(\frac{□}{□}\)
Answer:
\(\frac{1}{10}\)
Explanation:
2/5 = 0.4 is closer to 0.5
0.5/5 = 0.1 = 1/10
Question 11.
\(4 \div \frac{1}{7}\)
_______
Answer:
40
Explanation:
1/7 = 0.1428 is closer to 0.1
4/0.1 = 40
Practice: Copy and Solve Evaluate using the order of operations.
Write the answer in simplest form.
Question 12.
\(\left(\frac{3}{5}+\frac{1}{10}\right) \div 2\)
\(\frac{□}{□}\)
Answer:
\(\frac{7}{20}\)
Explanation:
3/5 + 1/10 = 7/10 = 0.7
0.7/2 = 7/20
Question 13.
\(\frac{3}{5}+\frac{1}{10} \div 2\)
\(\frac{□}{□}\)
Answer:
\(\frac{13}{20}\)
Explanation:
\(\frac{3}{5}+\frac{1}{10} \div 2\)
(1/10)/2 = 1/20
3/5 + 1/20 = 0.65 = 13/20
Question 14.
\(\frac{3}{5}+2 \div \frac{1}{10}\)
_______ \(\frac{□}{□}\)
Answer:
Explanation:
2/(1/10) = 1/5
3/5 + 1/5 = 4/5
Question 15.
Generalize Suppose the divisor and the dividend of a division problem are both fractions between 0 and 1, and the divisor is greater than the dividend. Is the quotient less than, equal to, or greater than 1?
Type below:
__________
Answer:
Divisor and Dividend are fractions lying between 0 and 1
Also, Divisor > Dividend
A smaller number is being divided by a larger number
Whenever a smaller number is divided by a larger number, the quotient is less than 1
Example:
0,5/0,6 Here, they are both numbers between 0 and 1, and the divisor is greater than the dividend.
The result is 0,8333, LESS THAN 1
Hence, the answer is that the quotient will be less than 1
Problem Solving + Applications – Page No. 110
Use the table for 16–19.
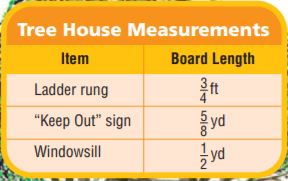
Question 16.
Kristen wants to cut ladder rungs from a 6 ft board. How many ladder rungs can she cut?
_______ ladder rungs
Answer:
8 ladder rungs
Explanation:
Kristen wants to cut ladder rungs from a 6 ft board.
ladder rungs = 3/4 ft
6/(3/4) = 8 rungs
Question 17.
Pose a Problem Look back at Problem 16. Write and solve a new problem by changing the length of the board Kristen is cutting for ladder rungs.
Type below:
__________
Answer:
Kristen wants to cut ladder rungs from a 9 ft board. How many ladder rungs can she cut?
Kristen wants to cut ladder rungs from a 9 ft board.
ladder rungs = 3/4 ft
9/(3/4) = 12 rungs
Question 18.
Dan paints a design that has 8 equal parts along the entire length of the windowsill. How long is each part of the design?
\(\frac{□}{□}\) yards
Answer:
\(\frac{1}{16}\) yards
Explanation:
Dan paints a design that has 8 equal parts along the entire length of the windowsill.
(1/2)/8 = 1/2 x 1/8 = 1/16 yards
Question 19.
Dan has a board that is \(\frac{15}{16}\) yd. How many “Keep Out” signs can he make if the length of the sign is changed to half of the original length?
_______ signs
Answer:
3 signs
Explanation:
Dan has a board that is \(\frac{15}{16}\) yd.
If the length of the sign is changed to half of the original length, (5/8)/2 = 5/16
(15/16) ÷ 5/16 = 15/16 x 16/5 = 3
Question 20.
Lauren has \(\frac{3}{4}\) cup of dried fruit. She puts the dried fruit into bags, each holding \(\frac{1}{8}\) cup. How many bags will Lauren use? Explain your answer using words and numbers.
Type below:
__________
Answer:
6
Explanation:
Lauren has \(\frac{3}{4}\) cup of dried fruit. She puts the dried fruit into bags, each holding \(\frac{1}{8}\) cup.
3/4 ÷ 1/8 = 3/4 x 8 = 6
Lauren has 3/4 and in 1/4 there are 2 1/8s. That 3 fourths times two = 6 so 6 one eights
Divide Fractions – Page No. 111
Estimate. Then write the quotient in simplest form.
Question 1.
\(5 \div \frac{1}{6}\)
_____
Answer:
25
Explanation:
1/6 = 0.166 is closer to 0.2
5/0.2 = 25
Question 2.
\(\frac{1}{2} \div \frac{1}{4}\)
_____
Answer:
5
Explanation:
1/2 = 0.5 is closer to 1
1/4 = 0.25 is closer to 0.2
1/0.2 = 5
Question 3.
\(\frac{4}{5} \div \frac{2}{3}\)
_____ \(\frac{□}{□}\)
Answer:
1 \(\frac{1}{5}\)
Explanation:
4/5 = 0.8 is closer to 0.8
2/3 = 0.66 is closer to 0.6
0.8/0.6 = 1 1/5
Question 4.
\(\frac{14}{15} \div 7\)
\(\frac{□}{□}\)
Answer:
\(\frac{2}{15}\)
Explanation:
14/15 = 0.9333
0.9/7 = 2/15
Question 5.
\(8 \div \frac{1}{3}\)
_____
Answer:
20
Explanation:
1/3 = 0.33 is closer to 0.4
8/0.4 = 20
Question 6.
\(\frac{12}{21} \div \frac{2}{3}\)
\(\frac{□}{□}\)
Answer:
\(\frac{1}{1}\)
Explanation:
12/21 = 0.571 is closer to 0.6
2/3 = 0.666 is closer to 0.6
0.6/0.6 = 1
Question 7.
\(\frac{5}{6} \div \frac{5}{12}\)
_____
Answer:
2
Explanation:
5/6 = 0.833 is closer to 0.8
5/12 = 0.416 is closer to 0.4
0.8/0.4 = 2
Question 8.
\(\frac{5}{8} \div \frac{1}{2}\)
_____ \(\frac{□}{□}\)
Answer:
1 \(\frac{2}{10}\)
Explanation:
5/8 = 0.625 is closer to 0.6
1/2 = 0.5 is closer to 0.5
0.6/0.5 = 1.2 = 1 2/10
Question 9.
Joy ate \(\frac{1}{4}\) of a pizza. If she divides the rest of the pizza into pieces equal to \(\frac{1}{8}\) pizza for her family, how many pieces will her family get?
_____ pieces
Answer:
6 pieces
Explanation:
The pizza is divided into 4 pieces, Joy ate 1/4.
So, the left pices are 1 – 1/4 = 3/4
now, 3/4 of a pizza and Joy will divide this rest of the pizza in pieces equal to 1/8, so we need to make a division
(3/4) ÷ (1/8) = 24/4 = 6 pieces.
Question 10.
Hideko has \(\frac{3}{5}\) yard of ribbon to tie on balloons for the festival. Each balloon will need \(\frac{3}{10}\) yard of ribbon. How many balloons can Hideko tie with ribbon?
_____ balloons
Answer:
2 balloons
Explanation:
3/10 yard of ribbon required to tie = 1 balloon
3/5 yard of ribber can tie = (3/5) ÷ (3/10) = 2 ballons
With 3/5 yard, Hideko can tie 2 balloons
Problem Solving
Question 11.
Rick knows that 1 cup of glue weighs \(\frac{1}{18}\) pound. He has \(\frac{2}{3}\) pound of glue. How many cups of glue does he have?
_____ cups
Answer:
12 cups
Explanation:
For 1/18lb, 1 cup
For 2/3lb, x cups.
1/8x = 1 x 2/3
1/8x = 2/3
x = 2/3 x 18
x = 2 x 6 = 12 cups
Question 12.
Mrs. Jennings had \(\frac{5}{7}\) gallon of paint. She gave \(\frac{1}{7}\) gallon each to some students. How many students received paint if Mrs. Jennings gave away all the paint?
_____ students
Answer:
4 students
Explanation:
Mrs. Jennings had \(\frac{5}{7}\) gallon of paint. She gave \(\frac{1}{7}\) gallon each to some students.
\(\frac{5}{7}\) ÷ \(\frac{1}{7}\) = 25/7 = 3.571 is closer to 4
Question 13.
Write a word problem that involves two fractions. Include the solution.
Type below:
__________
Answer:
Mrs. Jennings had \(\frac{5}{7}\) gallon of paint. She gave \(\frac{1}{7}\) gallon each to some students. How many students received paint if Mrs. Jennings gave away all the paint?
Answer:
Mrs. Jennings had \(\frac{5}{7}\) gallon of paint. She gave \(\frac{1}{7}\) gallon each to some students.
\(\frac{5}{7}\) ÷ \(\frac{1}{7}\) = 25/7 = 3.571 is closer to 4
Lesson Check – Page No. 112
Question 1.
There was \(\frac{2}{3}\) of a pizza for 6 friends to share equally. What fraction of the pizza did each person get?
\(\frac{□}{□}\)
Answer:
\(\frac{1}{9}\)
Explanation:
There was \(\frac{2}{3}\) of a pizza for 6 friends to share equally.
\(\frac{2}{3}\) ÷ 6 = 2/3 x 1/6 = 2/18 = 1/9
Question 2.
Rashad needs \(\frac{2}{3}\) pound of wax to make a candle. How many candles can he make with 6 pounds of wax?
_____ candles
Answer:
9 candles
Explanation:
Rashad needs 2/3 pound a wax to make candles.
1 Candle = 2/3 pounds.
So, for 2 pounds,
3 x 2/3 = 3 candles
2 pounds = 3 candles
1 pound = 3/2 candles
So, for 6 pounds,
6 x 3/2 = 9 candles
Spiral Review
Question 3.
Jeremy had \(\frac{3}{4}\) of a submarine sandwich and gave his friend \(\frac{1}{3}\) of it. What fraction of the sandwich did the friend receive?
\(\frac{□}{□}\)
Answer:
\(\frac{1}{4}\)
Explanation:
Jeremy had \(\frac{3}{4}\) of a submarine sandwich and gave his friend \(\frac{1}{3}\) of it.
1/3 x 3/4 = 1/4
Question 4.
Ebony walked at a rate of 3 \(\frac{1}{2}\) miles per hour for 1 \(\frac{1}{3}\) hours. How far did she walk?
_____ \(\frac{□}{□}\)
Answer:
4 \(\frac{2}{3}\)
Explanation:
Ebony walked at a rate of 3 \(\frac{1}{2}\) miles per hour for 1 \(\frac{1}{3}\) hours.
3 1/2 miles = 7/2 miles … 1 hour
x miles = ? … 1 1/3 hours = 4/3 hours
7/2 x 4/3 = 1 x x
x = 7/2 x 4/3
x = 14/3 = 4 2/3 miles
The correct result would be 4 2/3 miles.
Question 5.
Penny uses \(\frac{3}{4}\) yard of fabric for each pillow she makes. How many pillows can she make using 6 yards of fabric?
_____ pillows
Answer:
8 pillows
Explanation:
Penny uses \(\frac{3}{4}\) yard of fabric for each pillow she makes.
Using 6 yards of fabric 6/(3/4) = 24/3 = 8
Question 6.
During track practice, Chris ran 2.5 laps in 81 seconds. What was his average time per lap?
_____ seconds
Answer:
32.4 seconds
Explanation:
During track practice, Chris ran 2.5 laps in 81 seconds.
81/2.5 = 32.4 seconds
Share and Show – Page No. 115
Use the model to find the quotient.
Question 1.
\(3 \frac{1}{3} \div \frac{1}{3}\)

_____
Answer:
21
Explanation:
Model 3 with 3 hexagonal blocks.
Model 1/2 with 1 trapezoid block.
For 1/6,
6 triangle blocks are equal to 1 hexagon.
So, a triangle block shows 1/6.
Count the triangles.
There are 21 triangle blocks.
So, 3 1/2 ÷ 1/6 = 21.
Question 2.
\(2 \frac{1}{2} \div \frac{1}{6}\)

_____
Answer:
15
Explanation:
Model 2 with 2 hexagonal blocks.
Model 1/2 with 1 trapezoid block.
For 1/6,
6 triangle blocks are equal to 1 hexagon.
So, a triangle block shows 1/6.
Count the triangles.
There are 15 triangle blocks.
So, \(2 \frac{1}{2} \div \frac{1}{6}\) = 15.
Use pattern blocks to find the quotient. Then draw the model.
Question 3.
\(2 \frac{2}{3} \div \frac{1}{6}\)
_____
Answer:

Explanation:
2 2/3 = 8/3
8/3 ÷ 1/6 = 16
Question 4.
\(3 \frac{1}{2} \div \frac{1}{2}\)
_____
Answer:

Explanation:
3 1/2 = 7/2
7/2 ÷ 1/2 = 7
Draw a model to find the quotient.
Question 5.
\(3 \frac{1}{2} \div 3\)
_____ \(\frac{□}{□}\)
Answer:

Explanation:
3 1/2 = 7/2
7/2 ÷ 3 = 21/2
Question 6.
\(1 \frac{1}{4} \div 2\)
\(\frac{□}{□}\)
Answer:

Explanation:
1/4 ÷ 2 = 1/2
Question 7.
Use Appropriate Tools Explain how models can be used to divide mixed numbers by fractions or whole numbers
Type below:
__________
Answer:
Multiply the whole number part by the fraction’s denominator. Add that to the numerator. Then write the result on top of the denominator.
Problem Solving + Applications – Page No. 116
Use a model to solve. Then write an equation for the model.
Question 8.
Use Models Eliza opens a box of bead kits. The box weighs 2 \(\frac{2}{3}\) lb. Each bead kit weighs \(\frac{1}{6}\) lb. How many kits are in the box? What does the answer mean?
Type below:
__________
Answer:

16 kits are in the box
Explanation:
Eliza opens a box of bead kits. The box weighs 2 \(\frac{2}{3}\) lb. Each bead kit weighs \(\frac{1}{6}\) lb, 2 \(\frac{2}{3}\) ÷ \(\frac{1}{6}\) = 8/3 ÷ 1/6 = 16.
16 kits are in the box
Question 9.
Hassan has two boxes of trail mix. Each box holds 1 \(\frac{2}{3}\) lb of trail mix. He eats \(\frac{1}{3}\) lb of trail mix each day. How many days can Hassan eat trail mix before he runs out?
_____ days
Answer:
10 days
Explanation:
Hassan has two boxes of trail mix. Each box holds 1 \(\frac{2}{3}\) lb of trail mix.
1 \(\frac{2}{3}\) = 5/3
2 x (5/3) = 10/3
He eats \(\frac{1}{3}\) lb of trail mix each day.
10/3 ÷ 1/3 = 10
Hassan eats trail mix for 10 days before he runs out.
Question 10.
Sense or Nonsense? Steve made this model to show \(2 \frac{1}{3} \div \frac{1}{6}\). He says that the quotient is 7. Is his answer sense or nonsense? Explain your reasoning

Type below:
__________
Answer:
\(2 \frac{1}{3} \div \frac{1}{6}\) = 7/3 ÷ 1/6 = 14.
He said the quotient is 7.
His answer is Nonsense.
Question 11.
Eva is making muffins to sell at a fundraiser. She has 2 \(\frac{1}{4}\) cups of flour, and the recipe calls for \(\frac{3}{4}\) cup of flour for each batch of muffins. Explain how to use a model to find the number of batches of muffins Eva can make.
Type below:
__________
Answer:
3
Explanation:
Eva is making muffins to sell at a fundraiser. She has 2 \(\frac{1}{4}\) cups of flour, and the recipe calls for \(\frac{3}{4}\) cup of flour for each batch of muffins.
2 \(\frac{1}{4}\) ÷ \(\frac{3}{4}\) = 9/4 ÷ 3/4 = 3
Model Mixed Number Division – Page No. 117
Use the model to find the quotient.
Question 1.
\(4 \frac{1}{2} \div \frac{1}{2}\)
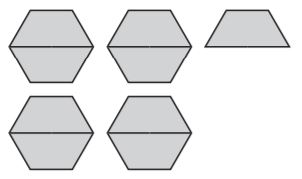
_____
Answer:
9
Explanation:
Count the number of trapezoids to find the answer.
Question 2.
\(3 \frac{1}{3} \div \frac{1}{6}\)

_____
Answer:
20
Use pattern blocks or another model to find the quotient. Then draw the model.
Question 3.
\(2 \frac{1}{2} \div \frac{1}{6}\)
_____
Answer:

Explanation:
Model 2 with 2 hexagonal blocks.
Model 1/2 with 1 trapezoid block.
For 1/6,
6 triangle blocks are equal to 1 hexagon.
So, a triangle block shows 1/6.
Count the triangles.
There are 15 triangle blocks.
So, 212÷16 = 15.
Question 4.
\(2 \frac{3}{4} \div 2\)
_____
Answer:
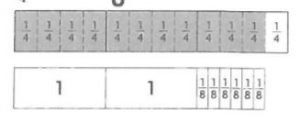
Explanation:
2 3/4 ÷ 2 = 11/2
Problem Solving
Question 5.
Marty has 2 \(\frac{4}{5}\) quarts of juice. He pours the same amount of juice into 2 bottles. How much does he pour into each bottle?
_____ \(\frac{□}{□}\) quarts
Answer:
1\(\frac{2}{5}\) quarts
Explanation:
Marty has 2 \(\frac{4}{5}\) quarts of juice. He pours the same amount of juice into 2 bottles.
2 \(\frac{4}{5}\) = 14/5 = 2.8
2.8/2 = 1.4 = 1 2/5
Question 6.
How many \(\frac{1}{3}\) pound servings are in 4 \(\frac{2}{3}\) pounds of cheese?
_____ pounds
Answer:
14 pounds
Explanation:
4 2/3 = 14/3
(14/3)/(1/3) = 14
Question 7.
Write a word problem that involves dividing a mixed number by a whole number. Solve the problem and describe how you found the answer.
Type below:
__________
Answer:
How many \(\frac{1}{3}\) pound servings are in 4 \(\frac{2}{3}\) pounds of cheese?
Explanation:
4 2/3 = 14/3
(14/3)/(1/3) = 14
Lesson Check – Page No. 118
Sketch a model to find the quotient.
Question 1.
Emma has 4 \(\frac{1}{2}\) pounds of birdseed. She wants to divide it evenly among 3 bird feeders. How much birdseed should she put in each?
_____ \(\frac{□}{□}\) pounds
Answer:
1\(\frac{1}{2}\) pounds
Explanation:
Emma has 4 1/2 pounds of birdseed.
Convert this to an improper fraction.
4 1/2 = 9/2
Emma wants to divide it evenly among 3 bird feeders.
So, she should put (9/2)/3 = 3/2 = 1 1/2
Question 2.
A box of crackers weighs 11 \(\frac{1}{4}\) ounces. Kaden estimates that one serving is \(\frac{3}{4}\) ounce. How many servings are in the box?
_____ servings
Answer:
15 servings
Explanation:
11 1/4 by 3/4
11 1/4 = 45/4
45/4 / 3/4 = 45/4 × 4/3 = 180/12 = 15
there are 15 servings
Spiral Review
Question 3.
The Ecology Club has volunteered to clean up 4.8 kilometers of highway. The members are organized into 16 teams. Each team will clean the same amount of highway. How much highway will each team clean?
_____ kilometers
Answer:
0.3 kilometers
Explanation:
The Ecology Club has volunteered to clean up 4.8 kilometers of highway. The members are organized into 16 teams.
The total length of the highway is given to clean = 4.8 kilometers
If the members are organized into 16 teams.
4.8/16 = 0.3
Hence, each team will clean 0.3 kilometers of the highway.
Question 4.
Tyrone has $8.06. How many bagels can he buy if each bagel costs $0.65?
_____ bagels
Answer:
12 bagels
Explanation:
$8.06/$0.65 = 12.4
12 bagels
Question 5.
A nail is 0.1875 inch thick. What is its thickness as a fraction? Is 0.1875 inch closer to \(\frac{1}{8}\) inch or \(\frac{1}{4}\) inch on a number line?
Type below:
__________
Answer:
0.1875 = 3/16 which is at the same distance to 1/4 and 1/8
It is the same distance apart.
Question 6.
Maria wants to find the product of 5 \(\frac{3}{20}\) × 3 \(\frac{4}{25}\) using decimals instead of fractions. How can she rewrite the problem using decimals?
Type below:
__________
Answer:
16.274
Explanation:
The decimal for 5 3/20 is 5.15
The decimal for 3 4/25 is 3.16
5.15 × 3.16 = 16.274
Share and Show – Page No. 121
Estimate. Then write the quotient in simplest form.
Question 1.
\(4 \frac{1}{3} \div \frac{3}{4}\)
______ \(\frac{□}{□}\)
Answer:
5\(\frac{375}{1000}\)
Explanation:
4 1/3 = 13/3 = 4.333 is closer to 4.3
3/4 = 0.75 is closer to 0.8
4.3/0.8 = 5.375 = 5 375/1000
Question 2.
Six hikers shared 4 \(\frac{1}{2}\) lb of trail mix. How much trail mix did each hiker receive?
\(\frac{□}{□}\)
Answer:
\(\frac{75}{100}\)
Explanation:
6 hikers = 4.5 lbs of trail mix
4.5/6= .75 lbs each hiker.
Question 3.
\(5 \frac{2}{3} \div 3\)
______ \(\frac{□}{□}\)
Answer:
2\(\frac{947}{1000}\)
Explanation:
5 2/3 = 17/3 = 5.666 is closer to 5.6
5.6/3 = 1.866 is closer to 1.9
5.6/1.9 = 2.947 = 2 947/1000
Question 4.
\(7 \frac{1}{2} \div 2 \frac{1}{2}\)
______
Answer:
3
Explanation:
7 1/2 = 15/2 = 7.5
2 1/2 = 5/2 = 2.5
7.5/2.5 = 3
On Your Own
Estimate. Then write the quotient in simplest form.
Question 5.
\(5 \frac{3}{4} \div 4 \frac{1}{2}\)
______ \(\frac{□}{□}\)
Answer:
1\(\frac{27}{100}\)
Explanation:
5 3/4 = 23/4 = 5.75
4 1/2 = 9/2 = 4.5
5.75/4.5 = 1.27 = 1 27/100
Question 6.
\(5 \div 1 \frac{1}{3}\)
______ \(\frac{□}{□}\)
Answer:
3\(\frac{84}{100}\)
Explanation:
1 1/3 = 4/3 = 1.33 is closer to 1.3
5/1.3 = 3.84 = 3 84/100
Question 7.
\(6 \frac{3}{4} \div 2\)
______ \(\frac{□}{□}\)
Answer:
3\(\frac{2}{5}\)
Explanation:
6 3/4 = 27/4 = 6.75 is closer to 6.8
6.8/2 = 3.4 = 3 2/5
Question 8.
\(2 \frac{2}{9} \div 1 \frac{3}{7}\)
______ \(\frac{□}{□}\)
Answer:
1\(\frac{571}{1000}\)
Explanation:
2 2/9 = 20/9 = 2.22 is closer to 2.2
1 3/7 = 10/7 = 1.428 is closer to 1.4
2.2/1.4 = 1.571 = 1 571/1000
Question 9.
How many 3 \(\frac{1}{3}\) yd pieces can Amanda get from a 3 \(\frac{1}{3}\) yd ribbon?
______
Answer:
1
Explanation:
(3 1/3) ÷ (3 1/3) = 1
Question 10.
Samantha cut 6 \(\frac{3}{4}\) yd of yarn into 3 equal pieces. Explain how she could use mental math to find the length of each piece
Type below:
__________
Answer:
27/12
Explanation:
Samantha cut 6 \(\frac{3}{4}\) yd of yarn into 3 equal pieces.
6 3/4 = 27/4
(27/4)/3
(27/4)(1/3) = 27/12
Evaluate Algebra Evaluate using the order of operations. Write the answer in simplest form.
Question 11.
\(1 \frac{1}{2} \times 2 \div 1 \frac{1}{3}\)
_____ \(\frac{□}{□}\)
Answer:
2\(\frac{1}{4}\)
Explanation:
(1 1/2) × 2 = 3/2 × 2 = 3
1 1/3 = 4/3
3/(4/3) = 9/4 = 2.25 = 2 1/4
Question 12.
\(1 \frac{2}{5} \div 1 \frac{13}{15}+\frac{5}{8}\)
_____ \(\frac{□}{□}\)
Answer:
1\(\frac{3}{8}\)
Explanation:
(1 2/5)/(1 13/15) = (7/5)/(28/15) = 3/4 = 0.75
0.75 + 0.625 = 1.375 = 1 3/8
Question 13.
\(3 \frac{1}{2}-1 \frac{5}{6} \div 1 \frac{2}{9}\)
_____
Answer:
2
Explanation:
(1 5/6)/(1 2/9) = (11/6)/11/9 = 3/2 = 1 1/2 = 1.5
3 1/2 = 7/2 = 3.5
3.5 – 1.5 = 2
Question 14.
Look for a Pattern Find these quotients: \(20 \div 4 \frac{4}{5}\), \(10 \div 4 \frac{4}{5}\), \(5 \div 4 \frac{4}{5}\). Describe a pattern you see.
Type below:
__________
Answer:
20 ÷ 4 4/5 = 20 ÷ 24/5 = 20/4.8 = 4.1666
10 ÷ 4 4/5 = 10 ÷ 24/5 = 10/4.8 = 2.08333
5 ÷ 4 4/5 = 5 ÷ 24/5 = 5/4.8 = 1.04166
The pattern is multiplied by 2 every time.
Page No. 122
Question 15.
Dina hikes \(\frac{1}{2}\) of the easy trail and stops for a break every 3 \(\frac{1}{4}\) miles. How many breaks will she take?
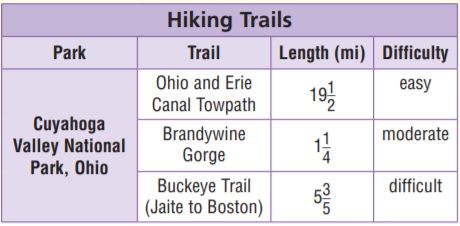
a. What problem are you asked to solve?
Type below:
__________
Answer:
How many breaks Dina will take when hikes \(\frac{1}{2}\) of the easy trail and stops for a break every 3 \(\frac{1}{4}\) mile.
Question 15.
b. How will you use the information in the table to solve the problem?
Type below:
__________
Answer:
Dina easy trail length, break time
Question 15.
c. How can you find the distance Dina hikes? How far does she hike?
______ \(\frac{□}{□}\) miles
Answer:
9\(\frac{3}{4}\) miles
Explanation:
19 1/2 × 1/2 = 39/2 × 1/2 = 39/4 = 9 3/4
Question 15.
d. What operation will you use to find how many breaks Dina takes?
Type below:
__________
Answer:
Division
Question 15.
e. How many breaks will Dina take?
______ breaks
Answer:
3 breaks
Explanation:
39/4 ÷ 13/4 = 3
Question 16.
Carlo packs 15 \(\frac{3}{4}\) lb of books in 2 boxes. Each book weighs 1 \(\frac{1}{8}\) lb. There are 4 more books in Box A than in Box B. How many books are in Box A? Explain your work.
______ books
Answer:
Carlo packs 15 \(\frac{3}{4}\) lb of books in 2 boxes. Each book weighs 1 \(\frac{1}{8}\) lb.
15 \(\frac{3}{4}\) ÷ 1 \(\frac{1}{8}\) = 63/4 ÷ 9/8 = 14
14 books available in 2 boxes.
There are 4 more books in Box A than in Box B.
Box A contains 5 + 4 = 9 books
Box B contains 5 books
Question 17.
Rex’s goal is to run 13 \(\frac{3}{4}\) miles over 5 days. He wants to run the same distance each day. Jordan said that Rex would have to run 3 \(\frac{3}{4}\) miles each day to reach his goal. Do you agree with Jordan? Explain your answer using words and numbers.
Type below:
__________
Answer:
Rex’s goal is to run 13 \(\frac{3}{4}\) miles over 5 days. He wants to run the same distance each day.
13 \(\frac{3}{4}\) ÷ 5 = 55/4 ÷ 5 = 11/4 or 2 3/4.
Jordan answer is wrong
Divide Mixed Numbers – Page No. 123
Estimate. Then write the quotient in simplest form.
Question 1.
\(2 \frac{1}{2} \div 2 \frac{1}{3}\)
______ \(\frac{□}{□}\)
Answer:
1\(\frac{1}{2}\)
Explanation:
2 1/2 = 5/2 = 2.5 is closer to 3
2 1/3 = 7/3 = 2.333 is closer to 2
3/2 = 1.5 = 1 1/2
Question 2.
\(2 \frac{2}{3} \div 1 \frac{1}{3}\)
______
Answer:
2
Explanation:
2 2/3 = 8/3 = 2.666 is closer to 2.6
1 1/3 = 4/3 = 1.333 is closer to 1.3
2.6/1.3 = 2
Question 3.
\(2 \div 3 \frac{5}{8}\)
\(\frac{□}{□}\)
Answer:
\(\frac{1}{2}\)
Explanation:
3 5/8 = 29/8 = 3.625 is closer to 3.6
2/3.6 = 0.5 = 1/2
Question 4.
\(1 \frac{13}{15} \div 1 \frac{2}{5}\)
\(\frac{□}{□}\)
Answer:
\(\frac{126}{100}\)
Explanation:
1 13/15 = 28/15 = 1.8666 is closer to 1.9
1 2/5 = 7/5 = 1.4 is closer to 1.5
1.9/1.5 = 1.266
126/100
Question 5.
\(10 \div 6 \frac{2}{3}\)
______ \(\frac{□}{□}\)
Answer:
1\(\frac{1}{2}\)
Explanation:
6 2/3 = 20/3 = 6.666 is closer to 6.7
10/6.7 = 3/2 = 1 1/2
Question 6.
\(2 \frac{3}{5} \div 1 \frac{1}{25}\)
______ \(\frac{□}{□}\)
Answer:
2\(\frac{3}{5}\)
Explanation:
2 3/5 = 13/5 = 2.6
1 1/25 = 26/25 = 1.04 is closer to 1
2.6/1 = 13/5 or 2 3/5
Question 7.
\(2 \frac{1}{5} \div 2\)
______ \(\frac{□}{□}\)
Answer:
1\(\frac{1}{10}\)
Explanation:
2 1/5 = 11/5 = 2.2 is closer to 2.2
2.2/2 = 1.1 = 11/10 = 1 1/10
Question 8.
Sid and Jill hiked 4 \(\frac{1}{8}\) miles in the morning and 1 \(\frac{7}{8}\) miles in the afternoon. How many times as far did they hike in the morning as in the afternoon?
______ \(\frac{□}{□}\) times
Answer:
2\(\frac{1}{5}\) times
Explanation:
Sid and Jill hiked 4 \(\frac{1}{8}\) miles in the morning and 1 \(\frac{7}{8}\) miles in the afternoon.
4 \(\frac{1}{8}\) = 33/8
1 \(\frac{7}{8}\) = 15/8
(33/8) ÷ (15/8) = 33/15 = 11/5 or 2 1/5
Problem Solving
Question 9.
It takes Nim 2 \(\frac{2}{3}\) hours to weave a basket. He worked Monday through Friday, 8 hours a day. How many baskets did he make?
______ baskets
Answer:
15 baskets
Explanation:
he worked (Mon – Fri) 5 days at 8 hrs per day = 5 × 8= 40 hrs
40/ (2 2/3) = 40 / (8/3) = 40 × 3/8 = 120/8 = 15 baskets
Question 10.
A tree grows 1 \(\frac{3}{4}\) feet per year. How long will it take the tree to grow from a height of 21 \(\frac{1}{4}\) feet to a height of 37 feet?
______ years
Answer:
9 years
Explanation:
A tree grows 1 3/4 = 7/4 feet per year.
If you would like to know how long will it take the tree to grow from a height of 21 1/4 = 85/4 feet to a height of 37 feet,
37 – 21 1/4 = 37 – 85/4 = 148/4 – 85/4 = 63/4 = 15 3/4
15 3/4 / 1 3/4 = 63/4 / 7/4 = 63/4 × 4/7 = 9 years
Question 11.
Explain how you would find how many 1 \(\frac{1}{2}\) cup servings there are in a pot that contains 22 \(\frac{1}{2}\) cups of soup.
Type below:
__________
Answer:
Given that, Total number of cups = 22 1/2
The number of cups required for each serving = 1 1/2
The number of servings = 22 1/2 ÷ 1 1/2
= 45/2 ÷ 3/2 = 45/3 = 15
Lesson Check – Page No. 124
Question 1.
Tom has a can of paint that covers 37 \(\frac{1}{2}\) square meters. Each board on the fence has an area of \(\frac{3}{16}\) square meters. How many boards can he paint?
______ boards
Answer:
200 boards
Explanation:
Tom has a can of paint that covers 37 \(\frac{1}{2}\) square meters. Each board on the fence has an area of \(\frac{3}{16}\) square meters.
37 \(\frac{1}{2}\) ÷ \(\frac{3}{16}\) = 200 square meters
Question 2.
A baker wants to put 3 \(\frac{3}{4}\) pounds of apples in each pie she makes. She purchased 52 \(\frac{1}{2}\) pounds of apples. How many pies can she make?
______ pies
Answer:
14 pies
Explanation:
A baker wants to put 3 \(\frac{3}{4}\) pounds of apples in each pie she makes. She purchased 52 \(\frac{1}{2}\) pounds of apples.
52 \(\frac{1}{2}\) ÷ 3 \(\frac{3}{4}\) = 14 pies
Spiral Review
Question 3.
The three sides of a triangle measure 9.97 meters, 10.1 meters, and 0.53 meter. What is the distance around the triangle?
______ meters
Answer:
20.6 meters
Explanation:
The distance around the triangle is call perimeter, to get it we must add the 3 sides.
So, 9.97 + 10.1 + 0.53 = 20.6 meters
Question 4.
Selena bought 3.75 pounds of meat for $4.64 per pound. What was the total cost of the meat?
$ ______
Answer:
$17.40
Explanation:
Selena bought 3.75 pounds of meat.
The cost of meat of one pound = $4.64
The total cost of the meat = 4.64 × 3.75 = $17.40
The total cost of 3.75 lb of meat was $17.40.
Question 5.
Melanie prepared 7 \(\frac{1}{2}\) tablespoons of a spice mixture. She uses \(\frac{1}{4}\) tablespoon to make a batch of barbecue sauce. Estimate the number of batches of barbecue sauce she can make using the spice mixture.
Type below:
__________
Answer:
30 batches of sauce
Explanation:
Melanie prepared 7 \(\frac{1}{2}\) tablespoons of a spice mixture. She uses \(\frac{1}{4}\) tablespoon to make a batch of barbecue sauce.
4 X 1/4 tbsp = 1 tbsp.
4 X 7 1/2 = 30.
she can make 30 batches of sauce
Question 6.
Arturo mixed together 1.24 pounds of pretzels, 0.78 pounds of nuts, 0.3 pounds of candy, and 2 pounds of popcorn. He then packaged it in bags that each contained 0.27 pounds. How many bags could he fill?
______ bags
Answer:
16 bags
Explanation:
Arturo mixed together 1.24 pounds of pretzels, 0.78 pounds of nuts, 0.3 pounds of candy, and 2 pounds of popcorn.
1.24 + 0.78 + 0.3 + 2 = 4.32
4.32/0.27 = 16
Page No. 127
Question 1.
There is \(\frac{4}{5}\) lb of sand in the class science supplies. If one scoop of sand weighs \(\frac{1}{20}\) lb, how many scoops of sand can Maria get from the class supplies and still leave \(\frac{1}{2}\) lb in the supplies?
Type below:
__________
Answer:
16 scoops
Explanation:
There is \(\frac{4}{5}\) lb of sand in the class science supplies. If one scoop of sand weighs \(\frac{1}{20}\) lb,
\(\frac{4}{5}\) ÷ \(\frac{1}{20}\) = 4/5 × 1/20 = 16 scoops
Question 2.
What if Maria leaves \(\frac{2}{5}\) lb of sand in the supplies? How many scoops of sand can she get?
______ scoops
Answer:
8 scoops
Explanation:
There is \(\frac{2}{5}\) lb of sand in the class science supplies. If one scoop of sand weighs \(\frac{1}{20}\) lb,
\(\frac{2}{5}\) ÷ \(\frac{1}{20}\) = 2/5 × 20 = 8
Question 3.
There are 6 gallons of distilled water in the science supplies. If 10 students each use an equal amount of the distilled water and there is 1 gal left in the supplies, how much will each student get?
\(\frac{□}{□}\) gallon
Answer:
\(\frac{1}{2}\) gallon
Explanation:
There are 6 gallons of distilled water in the science supplies.
There is 1 gal left in the supplies, 6 – 1 = 5
10 students each use an equal amount of the distilled water = 5/10 = 1/2
.5 gal for each student
On Your Own – Page No. 128
Question 4.
The total weight of the fish in a tank of tropical fish at Fish ‘n’ Fur was \(\frac{7}{8}\) lb. Each fish weighed \(\frac{1}{64}\) lb. After Eric bought some fish, the total weight of the fish remaining in the tank was \(\frac{1}{2}\) lb. How many fish did Eric buy?
______ fish
Answer:
386 fish
Explanation:
The total weight of the fish in a tank of tropical fish at Fish ‘n’ Fur was \(\frac{7}{8}\) lb. Each fish weighed \(\frac{1}{64}\) lb. After Eric bought some fish, the total weight of the fish remaining in the tank was \(\frac{1}{2}\) lb.
386 is the answer
Question 5.
Fish ‘n’ Fur had a bin containing 2 \(\frac{1}{2}\) lb of gerbil food. After selling bags of gerbil food that each held \(\frac{3}{4}\) lb, \(\frac{1}{4}\) lb of food was left in the bin. If each bag of gerbil food sold for $3.25, how much did the store earn?
$ ______
Answer:
$9.75
Explanation:
The store would earn 9.75$ because 3 bags of gerbil food is sold. Then you would multiply 3 by 3.25.
Question 6.
Describe Niko bought 2 lb of dog treats. He gave his dog \(\frac{3}{5}\) lb of treats one week and \(\frac{7}{10}\) lb of treats the next week. Describe how Niko can find how much is left.
Type below:
__________
Answer:
Niko bought 2 lb of dog treats. He gave his dog \(\frac{3}{5}\) lb of treats one week and \(\frac{7}{10}\) lb of treats the next week.
Let us find the amount of dog-food eaten by dogs in two months.
3/5 + 7/10 = 13/10
Now we will subtract the amount of food eaten by the dog from the amount of food initially to find the remaining amount of dog food.
2 – 13/10 = 7/10
Therefore, 7/10 pounds of food was remaining in the bag at the end of the two months.
Question 7.
There were 14 \(\frac{1}{4}\) cups of apple juice in a container. Each day, Elise drank 1 \(\frac{1}{2}\) cups of apple juice. Today, there is \(\frac{3}{4}\) cup of apple juice left. Derek said that Elise drank apple juice on nine days. Do you agree with Derek? Use words and numbers to explain your answer.
Type below:
__________
Answer:
Derek is correct.
Explanation:
An apple juice the container had 14 1/2 =14.25
She drank per day 1 1/2= 1.5
The left part in the container 3/4= .75
14.25 cups – .75 cup = 13.5 cups
13.5 cups ÷ 1.5 cups per day= 9 days
Problem Solving Fraction Operations – Page No. 129
Read each problem and solve.
Question 1.
\(\frac{2}{3}\) of a pizza was left over. A group of friends divided the leftover pizza into pieces each equal to \(\frac{1}{18}\) of the original pizza. After each friend took one piece, \(\frac{1}{6}\) of the original pizza remained. How many friends were in the group?
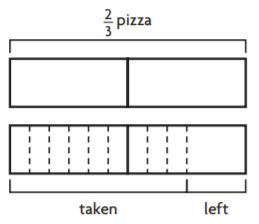
______ friends
Answer:
9 friends
Explanation:
Let us say that there are x friends.
Each one gets 1/18 of the original pizza: but this in turn leaves 1/6 of the 2/3 leftover.
1x/18 = 2/3 – 1/6
x = 12 – 3 = 9
Question 2.
Sarah’s craft project uses pieces of yarn that are \(\frac{1}{8}\) yard long. She has a piece of yarn that is 3 yards long. How many \(\frac{1}{8}\) -yard pieces can she cut and still have 1 \(\frac{1}{4}\) yards left?
______ pieces
Answer:
14 pieces
Explanation:
Sarah’s craft project uses pieces of yarn that are \(\frac{1}{8}\) yard long. She has a piece of yarn that is 3 yards long.
If she left 1 \(\frac{1}{4}\) yards left, 3 – 1 \(\frac{1}{4}\) = 7/4
7/4 ÷ \(\frac{1}{8}\) = 14
Question 3.
Alex opens a 1-pint container of orange butter. He spreads \(\frac{1}{16}\) of the butter on his bread. Then he divides the rest of the butter into \(\frac{3}{4}\) -pint containers. How many \(\frac{3}{4}\) -pint containers is he able to fill?
______ \(\frac{□}{□}\) containers
Answer:
1\(\frac{1}{4}\) containers
Explanation:
Alex opens a 1-pint container of orange butter. He spreads \(\frac{1}{16}\) of the butter on his bread.
1 – 1/16 = 15/16
Then he divides the rest of the butter into \(\frac{3}{4}\) -pint containers.
(15/16) ÷ (3/4) = 5/4 = 1 1/4
Question 4.
Kaitlin buys \(\frac{9}{10}\) a pound of orange slices. She eats \(\frac{1}{3}\) of them and divides the rest equally into 3 bags. How much is in each bag?
______ lb
Answer:
17/90 lb
Explanation:
Kaitlin buys \(\frac{9}{10}\) a pound of orange slices. She eats \(\frac{1}{3}\) of them and divides the rest equally into 3 bags.
If she starts with 9/10 pounds and has eaten 1/3 of them, 9/10 – 1/3 = 17/30
This is the amount she has left. Let’s divide this value by 3 to see how many pounds are in one bag.
(17/30)/3 = 17/90
There are 17/90 pounds in one bag.
Question 5.
Explain how to draw a model that represents \(\left(1 \frac{1}{4}-\frac{1}{2}\right) \div \frac{1}{8}\).
Type below:
__________
Answer:
Divide 2 bars into 8 quarters.
Below that draw 1 1/4 or 5 quarters.
Remove 1/2 or 2 quarters
Divide each of the 3 quarters left into 2 eighths
Explanation:
\(\left(1 \frac{1}{4}-\frac{1}{2}\right) \div \frac{1}{8}\)
1 1/4 -1/2 = 5/4 – 1/2 = 3/4
3/4 ÷ 1/8 = 6
Lesson Check – Page No. 130
Question 1.
Eva wanted to fill bags with \(\frac{3}{4}\) pounds of trail mix. She started with 11 \(\frac{3}{8}\) pounds but ate \(\frac{1}{8}\) pound before she started filling the bags. How many bags could she fill?
______ bags
Answer:
15 bags
Explanation:
11 and 3/8-1/8=11 and 2/8=11 and 1/4
3/4 times x bags=11 and 1/4
convert 11 and 1/4 to improper fraction
11 and 1/4 = 11 + 1/4 = 44/4 + 1/4 = 45/4
3/4 times x bags=45/4
x bags = 45/4 × 4/3 = 15 bags
she could fill 15 bags
Question 2.
John has a roll containing 24 \(\frac{2}{3}\) feet of wrapping paper. He wants to divide it into 11 pieces. First, though, he must cut off \(\frac{5}{6}\) foot because it was torn. How long will each piece be?
______ \(\frac{□}{□}\) feet
Answer:
2\(\frac{4}{25}\) feet
Explanation:
John had a roll containing wrapping paper = 24 2/3 = 74/3
First, he must cut off 5/6 foot because it was torn.
He wants to divide it into 11 pieces.
74/3 – 5/6
Taking the L.C.M of 3 and 6 is 6
(148-5)/6 = 143/6 = 23.83 feet
He wants to divide it into 11 pieces. length of the each piece = 23.83/11 = 2.16 feet
Spiral Review
Question 3.
Alexis has 32 \(\frac{2}{5}\) ounces of beads. How many necklaces can she make if each uses 2 \(\frac{7}{10}\) ounces of beads?
______ necklaces
Answer:
12 necklaces
Explanation:
Alexis has 32 \(\frac{2}{5}\) ounces of beads.
If each uses 2 \(\frac{7}{10}\) ounces of beads, 32 \(\frac{2}{5}\) × 2 \(\frac{7}{10}\)
32 \(\frac{2}{5}\) = 162/5
2 \(\frac{7}{10}\) = 27/10
162/5 × 27/10 = 12 necklaces
Question 4.
Joseph has $32.40. He wants to buy several comic books that each cost $2.70. How many comic books can he buy?
______ comic books
Answer:
12 comic books
Explanation:
Joseph has $32.40. He wants to buy several comic books that each cost $2.70.
$32.40/$2.70 = 12 comic books
Question 5.
A rectangle is 2 \(\frac{4}{5}\) meters wide and 3 \(\frac{1}{2}\) meters long. What is its area?
______ \(\frac{□}{□}\) m2
Answer:
9\(\frac{4}{5}\) m2
Explanation:
2 \(\frac{4}{5}\) = 14/5
3 \(\frac{1}{2}\) = 7/2
14/5 × 7/2 = 9 4/5
Question 6.
A rectangle is 2.8 meters wide and 3.5 meters long. What is its area?
______ m2
Answer:
9.8 m2
Explanation:
A rectangle is 2.8 meters wide and 3.5 meters long.
2.8 × 3.5 = 9.8
Chapter 2 Review/Test – Page No. 131
Question 1.
Write the values in order from least to greatest.

Type below:
__________
Answer:
0.45, 0.5, 5/8, 3/4
Explanation:
3/4 = 0.75
5/8 = 0.625
0.45, 0.5
0.45 < 0.5 < 0.625 < 0.75
Question 2.
For numbers 2a–2d, compare. Choose <, >, or =.
2a. 0.75 _____ \(\frac{3}{4}\)
2b. \(\frac{4}{5}\) _____ 0.325
2c. 1 \(\frac{3}{5}\) _____ 1.9
2d. 7.4 _____ 7 \(\frac{2}{5}\)
Answer:
2a. 0.75 = \(\frac{3}{4}\)
2b. \(\frac{4}{5}\) > 0.325
2c. 1 \(\frac{3}{5}\) < 1.9
2d. 7.4 = 7 \(\frac{2}{5}\)
Explanation:
2a. 3/4 = 0.75
0.75 = 0.75
2b. \(\frac{4}{5}\) = 0.8
0.8 > 0.325
2c. 1 \(\frac{3}{5}\) = 8/5 = 1.6
1.6 < 1.9
2d. 7 \(\frac{2}{5}\) = 37/5 = 7.4
7.4 = 7.4
Question 3.
The table lists the heights of 4 trees.
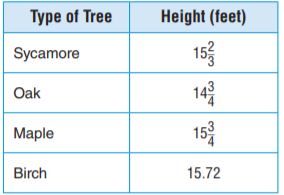
For numbers 3a–3d, select True or False for each statement.
3a. The oak tree is the shortest. True False
3b. The birch tree is the tallest. True False
3c. Two of the trees are the same height. True False
3d. The sycamore tree is taller than the maple tree. True False
Type below:
__________
Answer:
3a. The oak tree is the shortest. True
3b. The birch tree is the tallest. False
3c. Two of the trees are the same height. False
3d. The sycamore tree is taller than the maple tree. False
Explanation:
Sycamore = 15 2/3 = 47/3 = 15.666
Oak = 14 3/4 = 59/4 = 14.75
Maple = 15 3/4 = 63/4 = 15.75
Birch = 15.72
Page No. 132
Question 4.
For numbers 4a–4d, choose Yes or No to indicate whether the statement is correct.

4a. Point A represents 1.0. Yes No
4b. Point B represents \(\frac{3}{10}\). Yes No
4c. Point C represents 6.5. Yes No
4d. Point D represents \(\frac{4}{5}\). Yes No
Type below:
__________
Answer:
4a. Point A represents 1.0. Yes
4b. Point B represents \(\frac{3}{10}\). Yes
4c. Point C represents 6.5. No
4d. Point D represents \(\frac{4}{5}\). Yes
Question 5.
Select the values that are equivalent to one twenty-fifth. Mark all that apply.
Options:
a. 125
b. 25
c. 0.04
d. 0.025
Answer:
c. 0.04
Explanation:
one twenty-fifth = 1/25 = 0.04
Question 6.
The table shows Lily’s homework assignment. Lily’s teacher instructed the class to simplify each expression by dividing the numerator and denominator by the GCF. Complete the table by simplifying each expression and then finding the product.
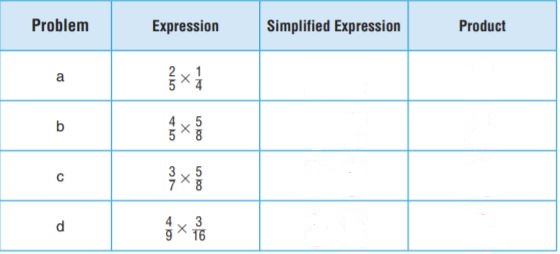
Type below:
___________
Answer:
a. Simplified Expression: 1/10
Product: 0.1
b. Simplified Expression: 1/2
Product: 0.5
c. Simplified Expression: 15/56
Product: 0.267
d. Simplified Expression: 1/12
Product: 0.083
Explanation:
a. 2/5 × 1/4 = 2/20
Simplify using the GCF.
The GCF of 2 and 20 is 2.
Divide the numerator and the denominator by 2.
So, 1/10 is the answer.
Product: 0.1
b. 4/5 × 5/8 = 1/2
Product: 0.5
c. 3/7 × 5/8 = 15/ 56
Product: 0.267
d. 4/9 × 3/16 = 1/12
Product: 0.083
Page No. 133
Question 7.
Two-fifths of the fish in Gary’s fish tank are guppies. One fourth of the guppies are red. What fraction of the fish in Gary’s tank are red guppies? What fraction of the fish in Gary’s tank are not red guppies? Show your work.
Type below:
___________
Answer:
1/10 of the fish are red guppies.
and 9/10 of the fish are not red guppies.
Explanation:
two-fifths of the fish in Gary’s fish tank are guppies.
One-fourth of the guppies are red.
Let the total number of fish in Gary’s fish tank be x.
It is given that two-fifths of the fish in Gary’s fish tank are guppies.
So, the number of guppies in Gary’s fish tank is 2/5 × x
Given that One-fourth of the guppies are red.
number of red guppies = 1/4 × 2x/5 = x/10
So, 1/10 of the fish are red guppies.
1 – 1/10 = 9/10 of the fish are not red guppies.
Question 8.
One-third of the students at Finley High School play sports. Two-fifths of the students who play sports are girls. What fraction of all students are girls who play sports? Use numbers and words to explain your answer.
Type below:
___________
Answer:
One-third of the students at Finley High School play sports. Two-fifths of the students who play sports are girls.
1/3 × 2/5 = 2/15 of the girls in the school play sports.
Question 9.
Draw a model to find the quotient.
\(\frac{3}{4}\) ÷ 2 =
\(\frac{3}{4}\) ÷ \(\frac{3}{8}\) =
How are your models alike? How are they different?
Type below:
___________
Answer:
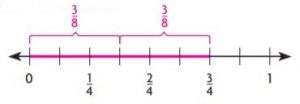
Explanation:
\(\frac{3}{4}\) ÷ 2 = 3/4 × 1/2 = 3/8
\(\frac{3}{4}\) ÷ \(\frac{3}{8}\) = 3/4 × 8/3 = 2
Both models are multiplying with the 3/4.
The number line model shows how many groups of 3/8 are in 3/4.
Question 10.
Explain how to use a model to find the quotient.
2 \(\frac{1}{2}\) ÷ 2 =
Type below:
___________
Answer:
5/4
Explanation:
2 1/2 = 5/2
5/2 groups of 2
5/2 ÷ 2 = 5/2 × 1/2 = 5/4
Page No. 134
Divide. Show your work.
Question 11.
\(\frac{7}{8}\) ÷ \(\frac{3}{5}\) =
_______ \(\frac{□}{□}\)
Answer:
1 \(\frac{11}{24}\)
Explanation:
\(\frac{7}{8}\) ÷ \(\frac{3}{5}\)
\(\frac{7}{8}\) × \(\frac{5}{3}\) = 35/24 = 1 \(\frac{11}{24}\)
Question 12.
\(2 \frac{1}{10} \div 1 \frac{1}{5}=\) =
_______ \(\frac{□}{□}\)
Answer:
1 \(\frac{3}{4}\)
Explanation:
2 \(\frac{1}{10}\) = 21/10
1 \(\frac{1}{5}\) = 6/5
(21/10) ÷ (6/5) = 7/4 or 1 3/4
Question 13.
Sophie has \(\frac{3}{4}\) quart of lemonade. If she divides the lemonade into glasses that hold \(\frac{1}{16}\) quart, how many glasses can Sophie fill? Show your work
_______ glasses
Answer:
12 glasses
Explanation:
Let x be the number of glasses
1/16x = 3/4
x = 3/4 × 16 = 3 × 4 = 12 glasses
Question 14.
Ink cartridges weigh \(\frac{1}{8}\) pound. The total weight of the cartridges in a box is 4 \(\frac{1}{2}\) pounds. How many cartridges does the box contain? Show your work and explain why you chose the operation you did.
_______ cartridges
Answer:
36 cartridges
Explanation:
Weight of ink cartridges = 1/8 pounds
Total weight of the cartridges in a box = 4 1/2 = 9/2 pounds
so, the Number of cartridges that box contain is given by
9/2 ÷ 1/8 = 36
Hence, there are 36 cartridges that box contain.
Question 15.
Beth had 1 yard of ribbon. She used \(\frac{1}{3}\) yard for a project. She wants to divide the rest of the ribbon into pieces \(\frac{1}{6}\) yard long. How many \(\frac{1}{6}\) yard pieces of ribbon can she make? Explain your solution.
_______ pieces
Answer:
4 pieces
Explanation:
Beth had 1 yard of ribbon. She used \(\frac{1}{3}\) yard for a project.
1 – \(\frac{1}{3}\) = 2/3 yard left
She wants to divide the rest of the ribbon into pieces \(\frac{1}{6}\) yard long.
2/3 ÷ 1/6 = 4
Page No. 135
Question 16.
Complete the table by finding the products. Then answer the questions in Part A and Part B.
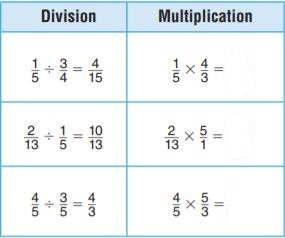
Part A
Explain how each pair of division and multiplication problems are the same, and how they are different.
Type below:
___________
Answer:
1/5 ÷ 3/4 = 4/15; 1/5 × 4/3 = 4/15
2/13 ÷ 1/5 = 10/13; 2/13 × 5/1 = 10/13
4/5 ÷ 3/5 = 4/3; 4/5 × 5/3 = 4/3
the product of the each pair of division and multiplication problems are the same.
They are different from the operation performed.
Question 16.
Part B
Explain how to use the pattern in the table to rewrite a division problem involving fractions as a multiplication problem.
Type below:
___________
Answer:
First, since it’s the division you have to change the second fraction which is called the reciprocal. That means the second fraction has to be flipped before you can multiple the fractions.
Page No. 136
Question 17.
Margie hiked a 17 \(\frac{7}{8}\) mile trail. She stopped every 3 \(\frac{2}{5}\) miles to take a picture. Martin and Tina estimated how many times Margie stopped.
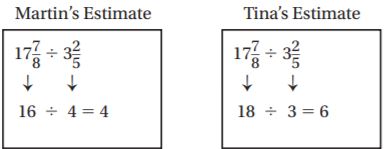
Who made the better estimate? Use numbers and words to explain your answer.
Type below:
___________
Answer:
Margie hiked a 17 7/8 mile trail.
Distance hiked by Margie = 17 7/8 = 143/8 mile.
She stopped every 3 2/5 miles to take a picture = 17/5 mile
Number of pictures = (143/8) ÷ (17/5) = 715/136 = 5.28
So she can take a maximum of 6 pictures and a minimum of 5 pictures.
B is the correct answer.
Question 18.
Brad and Wes are building a tree house. They cut a 12 \(\frac{1}{2}\) foot piece of wood into 5 of the same length pieces. How long is each piece of wood? Show your work.
_______ \(\frac{□}{□}\) foot
Answer:
2 \(\frac{1}{2}\) foot
Explanation:
Brad and Wes cut a 12 1/2foot piece of wood into 5 of the same length.
Let the length of 1 piece be x
So, Length of 5 pieces = 5x
The total length of wood = 25/2
5x = 25/2
x = 5/2 = 2 1/2
Free Grade 6 HMH Go Math Answer Key PDF Download
In addition, to the exercise problems students of grade 6 can get the solutions for mid-chapter checkpoint and review test also. So, start solving the problems which are at the end of the chapter and check the solutions from here. Hope the information regarding Go Math 6th Grade Answer Key Chapter 2 Fractions and Decimals is helpful for you to overcome the issues in maths. Check out the links and start solving all the questions.
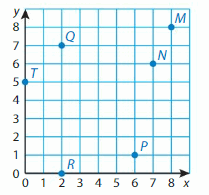



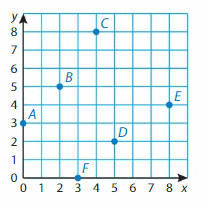


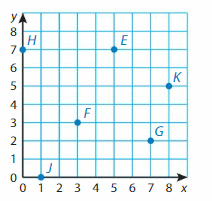


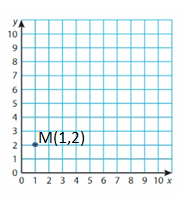
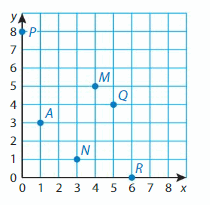


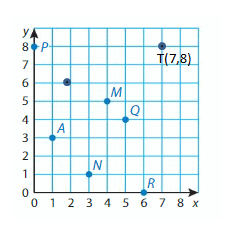
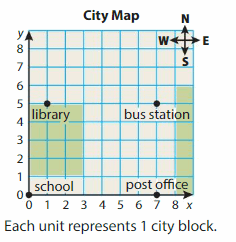


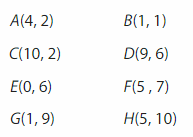

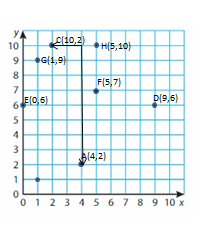




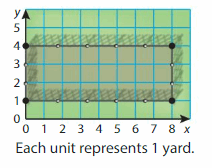
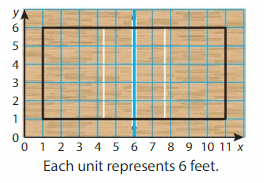
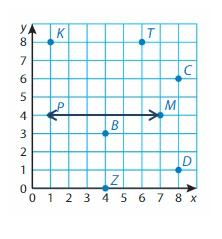
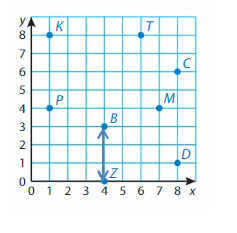
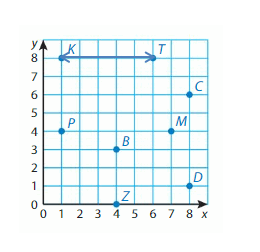
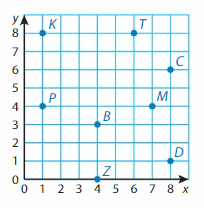
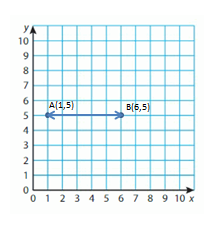
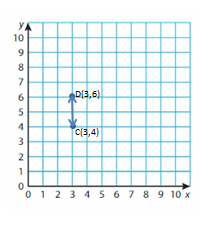
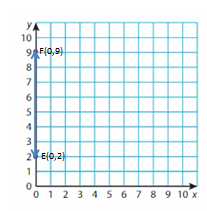
![]()
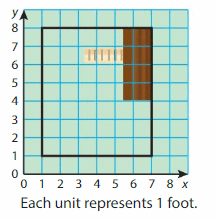
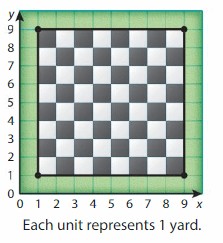
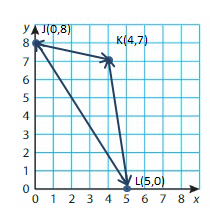
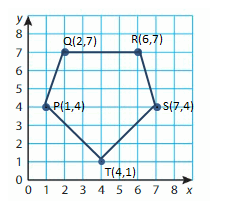
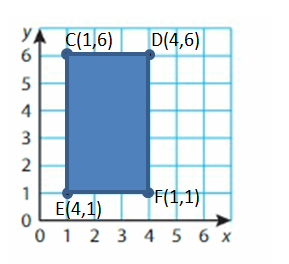
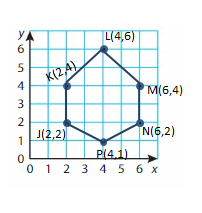
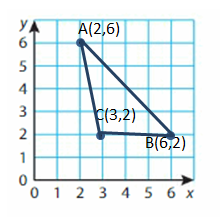
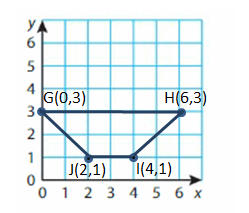
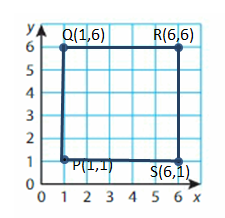
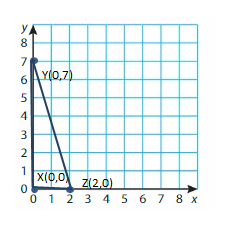
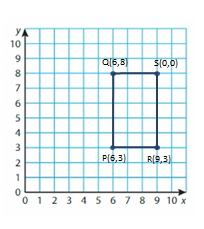
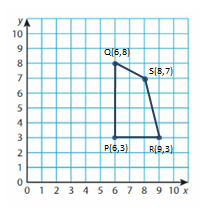
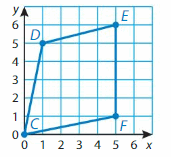
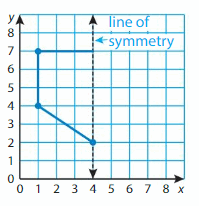
![]()
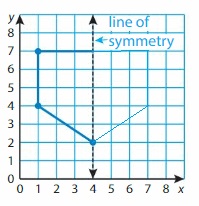
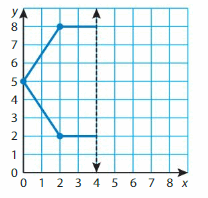
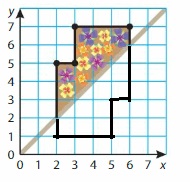
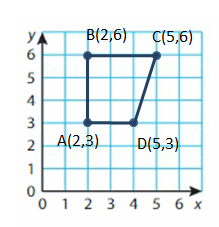

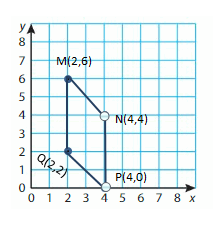
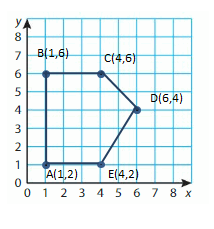
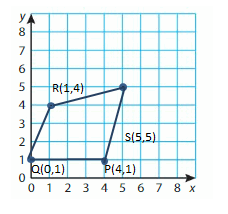
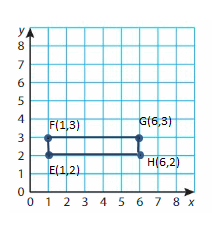
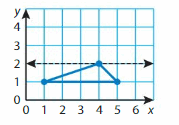
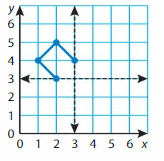
![]()


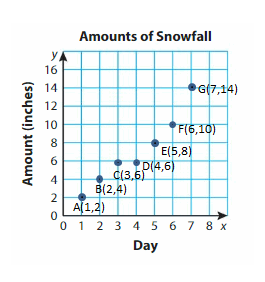
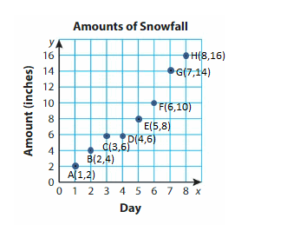
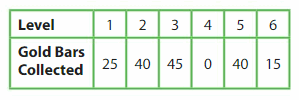
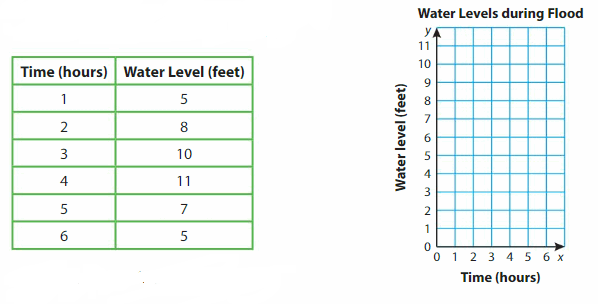



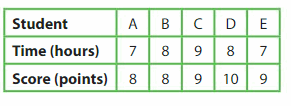
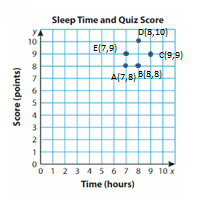

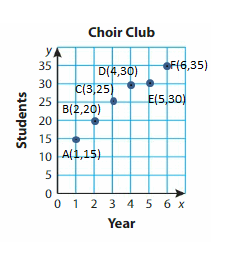
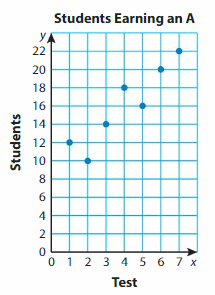








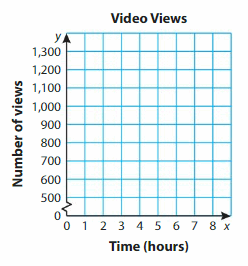
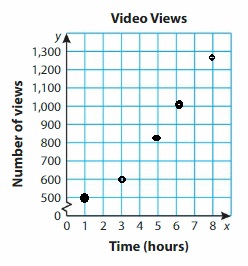

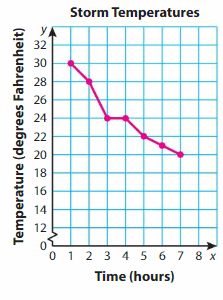

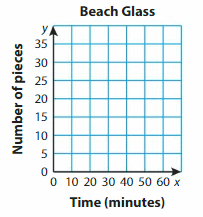









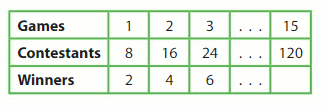



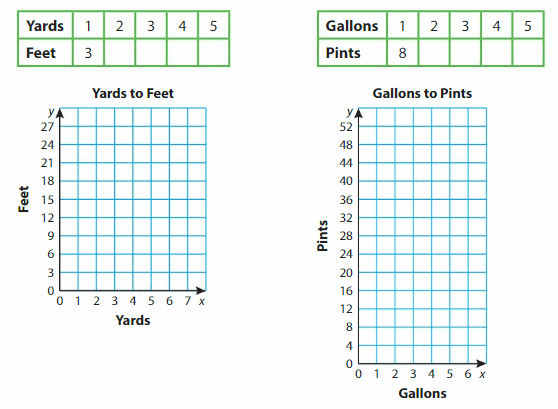


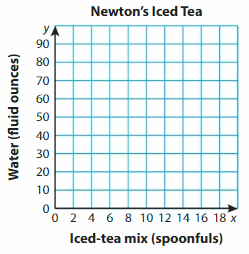


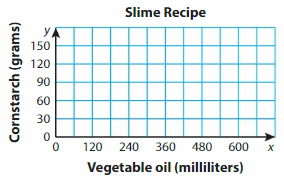

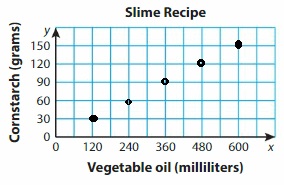

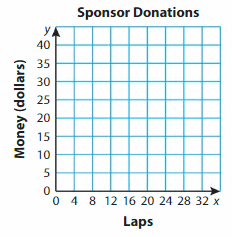

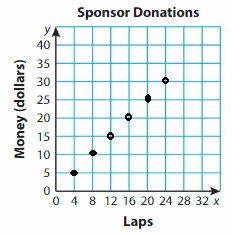
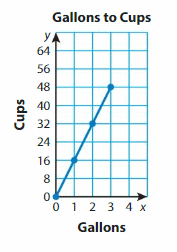
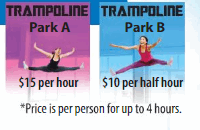

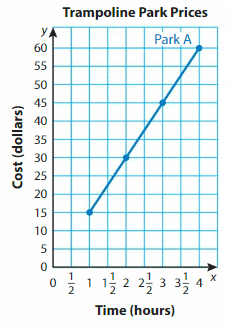



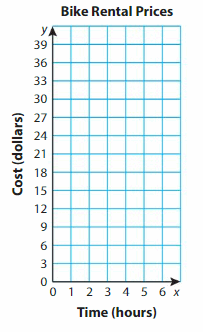
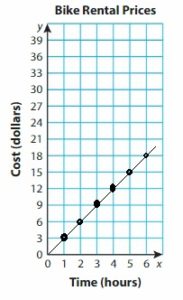

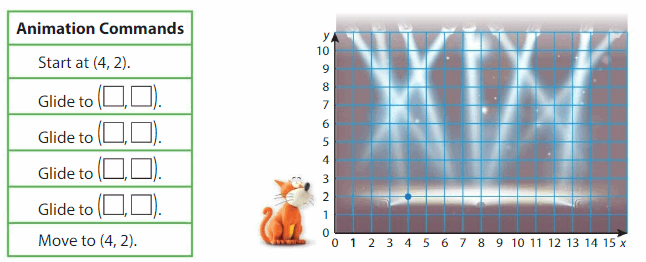


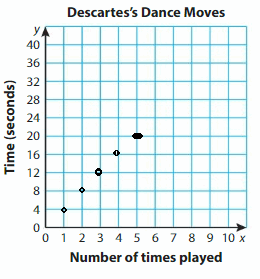
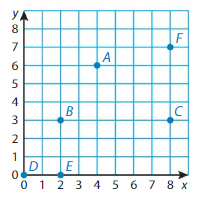
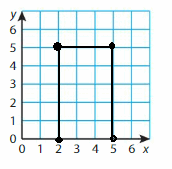
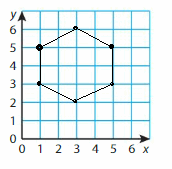





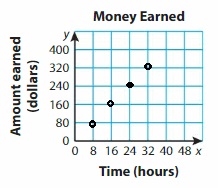

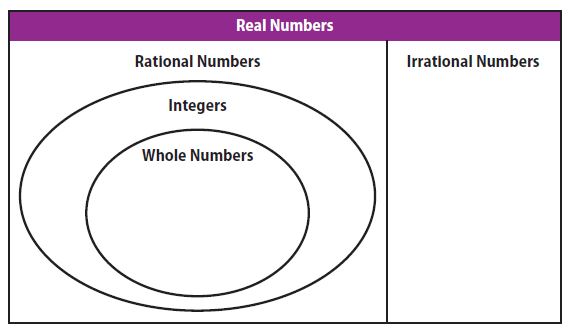

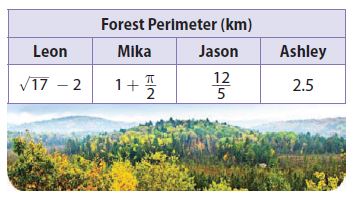
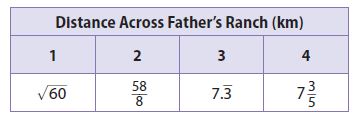
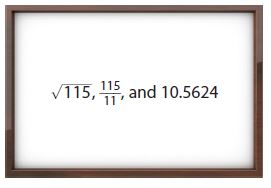


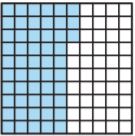
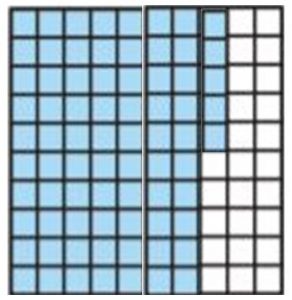
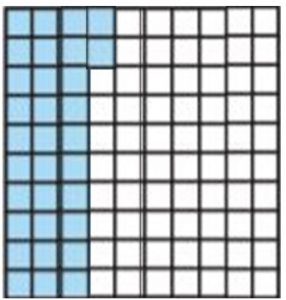
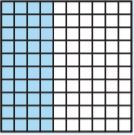
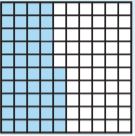
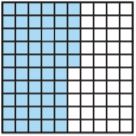
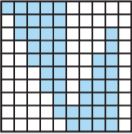
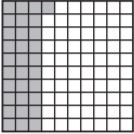
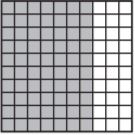
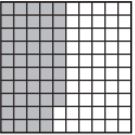
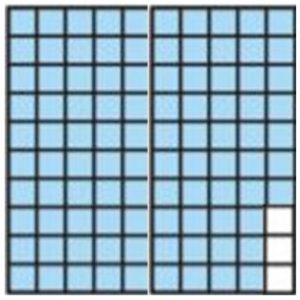
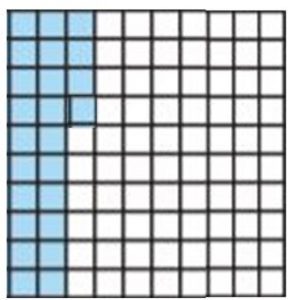
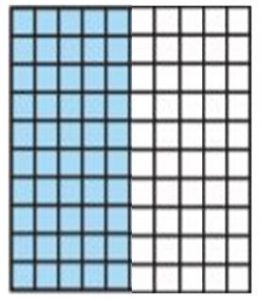
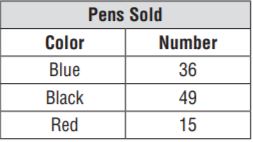
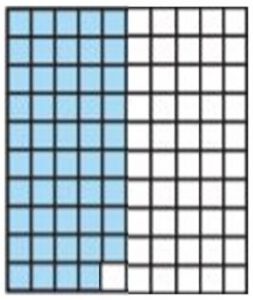
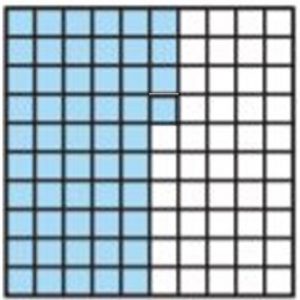
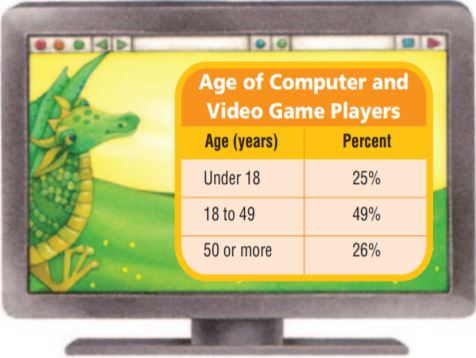
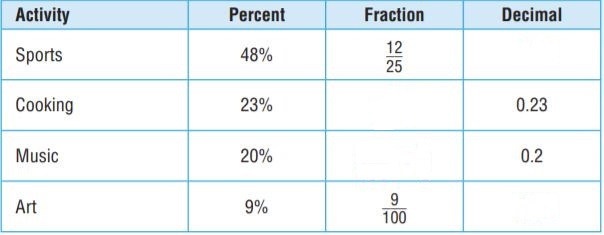

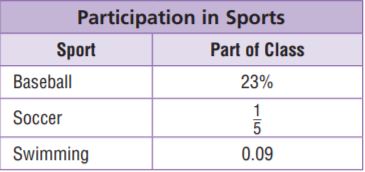
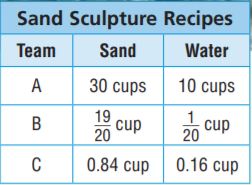
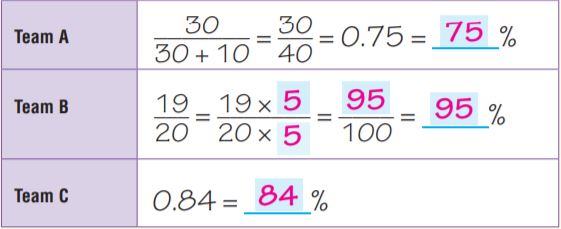
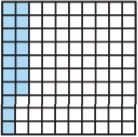
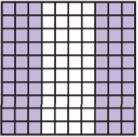
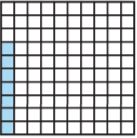
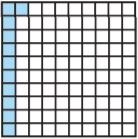
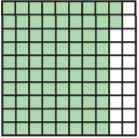
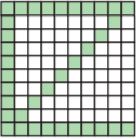
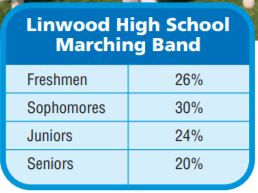
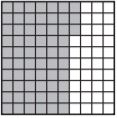

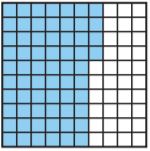
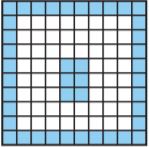
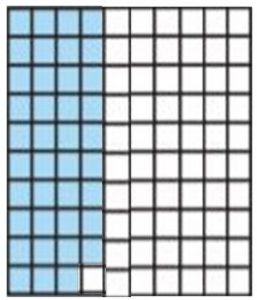
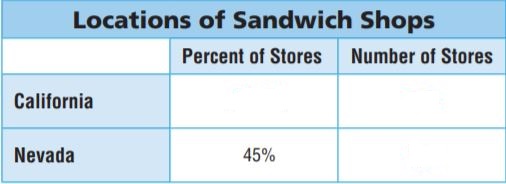
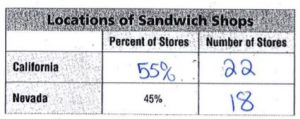

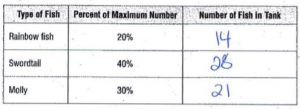
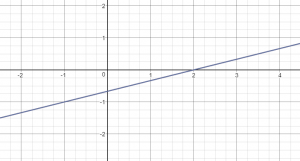
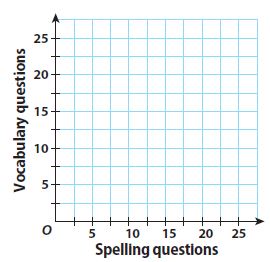
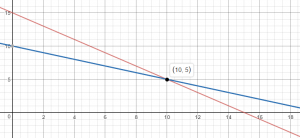
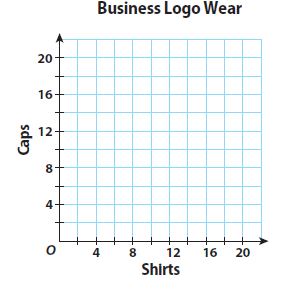
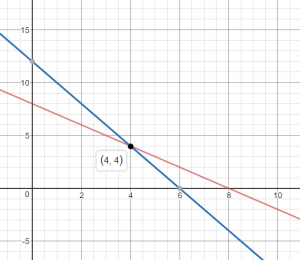
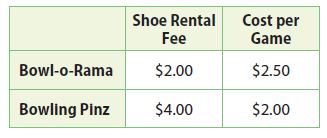
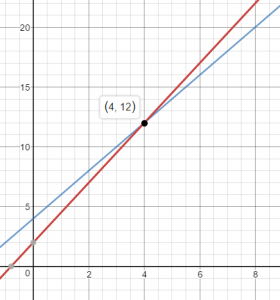

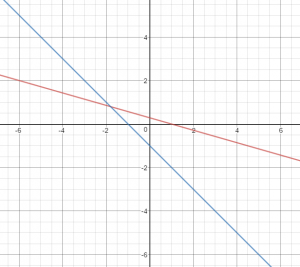
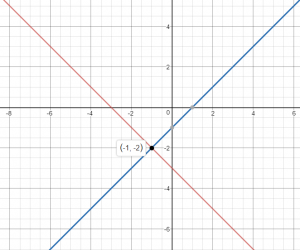
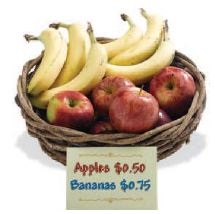
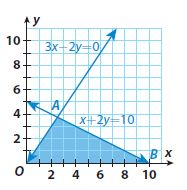
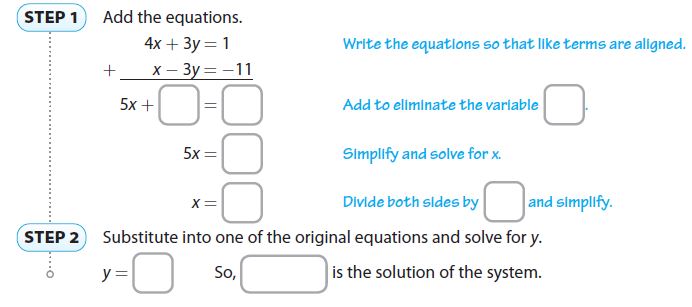
 img 14
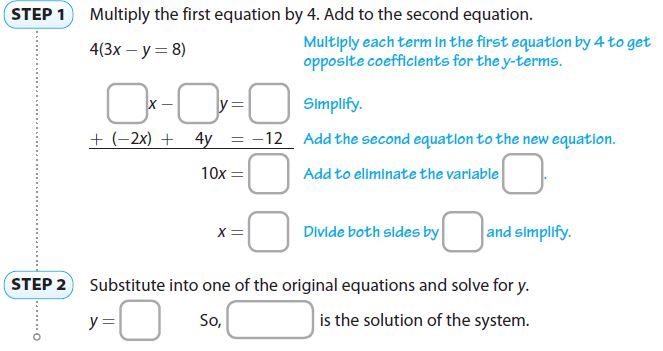
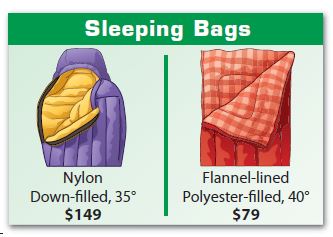
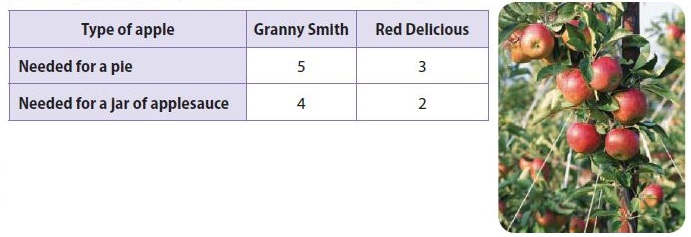
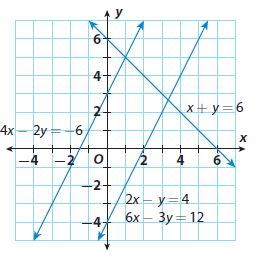


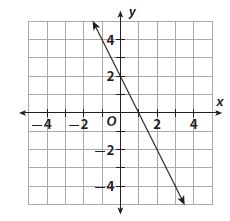
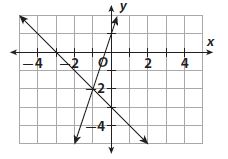
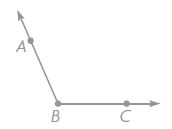
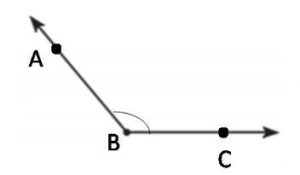








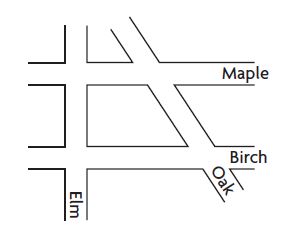
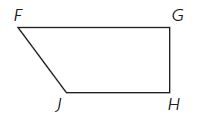




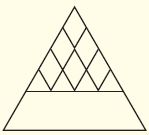





















































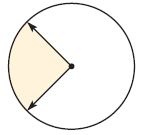
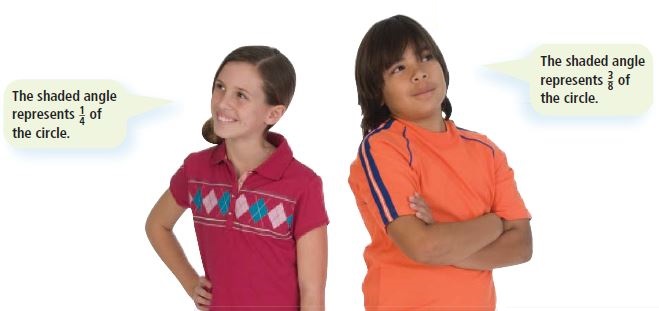


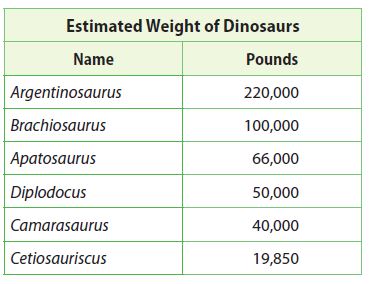
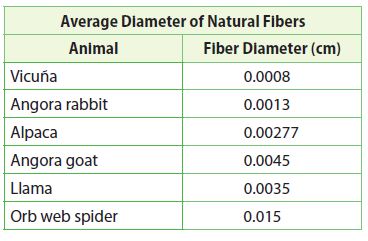









 \(\frac{1}{4}\)
 \(\frac{1}{3}\)