Engage NY Eureka Math 3rd Grade Module 6 Lesson 8 Answer Key
Eureka Math Grade 3 Module 6 Lesson 8 Pattern Sheet Answer Key
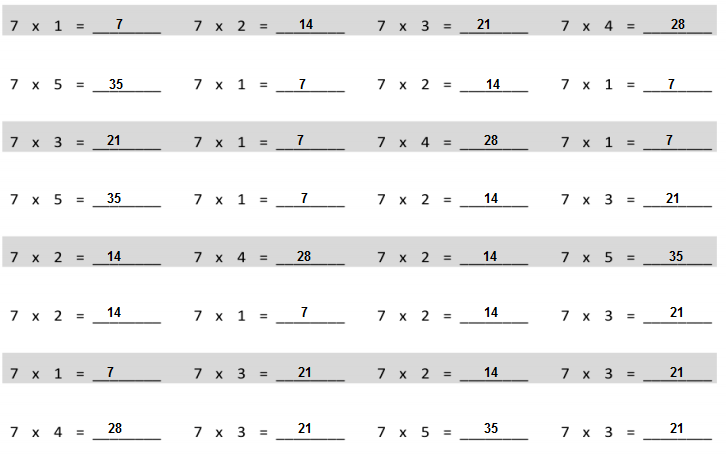
Multiply.
multiply by 7 (1–5)
Answer:
Eureka Math Grade 3 Module 6 Lesson 8 Problem Set Answer Key
Question 1.
Delilah stops under a silver maple tree and collects leaves. At home, she measures the widths of the leaves to the nearest \(\frac{1}{4}\) inch and records the measurements as shown below.
Widths of Silver Maple Tree Leaves (in Inches) | ||||
| 5\(\frac{3}{4}\) | 6 | 6\(\frac{1}{4}\) | 6 | 5\(\frac{3}{4}\) |
| 6\(\frac{1}{2}\) | 6\(\frac{1}{4}\) | 5\(\frac{1}{2}\) | 5\(\frac{3}{4}\) | 6 |
| 6\(\frac{1}{4}\) | 6 | 6 | 6\(\frac{1}{2}\) | 6\(\frac{1}{4}\) |
| 6\(\frac{1}{2}\) | 5\(\frac{3}{4}\) | 6\(\frac{1}{4}\) | 6 | 6\(\frac{3}{4}\) |
| 6 | 6\(\frac{1}{4}\) | 6 | 5\(\frac{3}{4}\) | 6\(\frac{1}{2}\) |
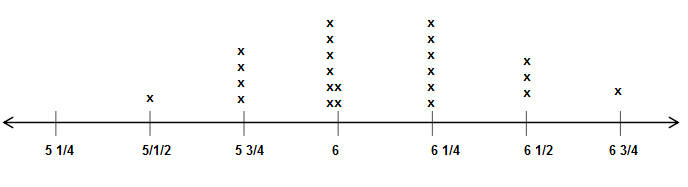
a. Use the data to create a line plot below.
b. Explain the steps you took to create the line plot.
c. How many more leaves were 6 inches wide than 6\(\frac{1}{2}\) inches wide?
d. Find the three most frequent measurements on the line plot. What does this tell you about the typical width of a silver maple tree leaf?
Answer:
a. line plot below
b. The steps you took to create the line plot
To create a line plot, first, create a number line that includes all the values in the data set. Next, place an X above each data value on the number line. If a value occurs more than once in a data set, place an Xs over that number for each time it occurs.
c. There are eight more leaves that were 6 inches wide than 6\(\frac{1}{2}\) inches wide
d. The three most frequent measurements on the line plot are 6 inches leaves and 6\(\frac{1}{4}\) inches leaves. this tell you about the typical width of a silver maple tree leaf are there are most frequent measurements on the line plot are 6 inches leaves and 6\(\frac{1}{4}\) inches leaves
Eureka Math Grade 3 Module 6 Lesson 8 Exit Ticket Answer Key
Question 1.
The line plot below shows the lengths of fish the fishing boat caught.
Lengths of Fish
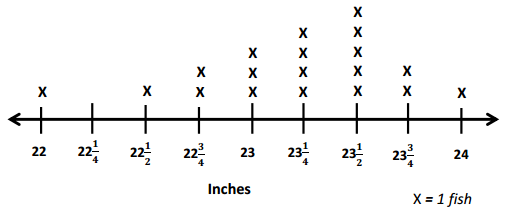
a. Find the three most frequent measurements on the line plot.
b. Find the difference between the lengths of the longest and shortest fish.
c. How many more fish were 23\(\frac{1}{4}\) inches long than 24 inches long?
Answer:
a. The three most frequent measurements on the line plot are 23\(\frac{1}{4}\) and 23\(\frac{1}{2}\)
b. The difference between the lengths of the longest and shortest fish is longest fish length is 2 inches as the longest fish length is 24 inches and the shortest fish length is 22 inches
c. There are 3 more fish were 23\(\frac{1}{4}\) inches longer than 24 inches long?
Eureka Math Grade 3 Module 6 Lesson 8 Homework Answer Key
Question 1.
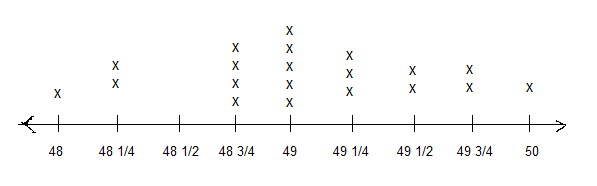
Mrs. Leah’s class uses what they learned about simple machines to build marshmallow launchers. They record the distances their marshmallows travel in the chart below.
Distance Traveled (in Inches) | ||||
| 48\(\frac{3}{4}\) | 49 | 49\(\frac{1}{4}\) | 50 | 49\(\frac{3}{4}\) |
| 49\(\frac{1}{2}\) | 48\(\frac{1}{4}\) | 49\(\frac{1}{2}\) | 48\(\frac{3}{4}\) | 49 |
| 49\(\frac{1}{4}\) | 49\(\frac{3}{4}\) | 48 | 49\(\frac{1}{4}\) | 48\(\frac{1}{4}\) |
| 49 | 48\(\frac{3}{4}\) | 49 | 49 | 48\(\frac{3}{4}\) |
a. Use the data to create a line plot below.
b. Explain the steps you took to create the line plot.
c. How many more marshmallows traveled 48\(\frac{3}{4}\) inches than 48\(\frac{1}{4}\) inches?
d. Find the three most frequent measurements on the line plot. What does this tell you about the distance that most of the marshmallows traveled?
Answer:
a. Used the data to create a line plot below.
b. The steps you took to create the line plot.
To create a line plot, first, create a number line that includes all the values in the data set. Next, place an X above each data value on the number line. If a value occurs more than once in a data set, place an Xs over that number for each time it occurs.
c. Two more marshmallows traveled 48\(\frac{3}{4}\) inches than 48\(\frac{1}{4}\) inches
d. The three most frequent measurements on the line plot are 48\(\frac{3}{4}\) and 49. the 49 inches tell you about the distance that most of the marshmallows traveled