Engage NY Eureka Math Grade 6 Module 6 Lesson 11 Answer Key
Eureka Math Grade 6 Module 6 Lesson 11 Example Answer Key
Example 1: Comparing Distributions with the Same Mean
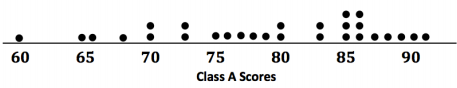
In Lesson 10, data distribution was characterized mainly by its center (mean) and variability (MAD). How these measures help us make a decision often depends on the context of the situation. For example, suppose that two classes of students took the same test, and their grades (based on loo points) are shown in the following dot plots. The mean score for each distribution is 79 points. Would you rather be in Class A or Class B if you had a score of 79?

Exercises 1 – 6:
Exercise 1.
Looking at the dot plots, which class has the greater MAD? Explain without actually calculating the MAD.
Answer:
Class A. The data for Class A have a much wider spread. Thus, it has greater variability and a larger MAD.
Exercise 2.
If Liz had one of the highest scores in her class, in which class would she rather be? Explain your reasoning.
Answer:
She would rather be in Class A. This doss had higher scores in the 90’s, whereas Class B had a high score of only 81.
Exercise 3.
If Logan scored below average, in which class would he rather be? Explain your reasoning.
Answer:
Logan would rather be in Class B. The low scores in Class B were in the 70 ‘s, whereas Class A had low scores in the 60’s.
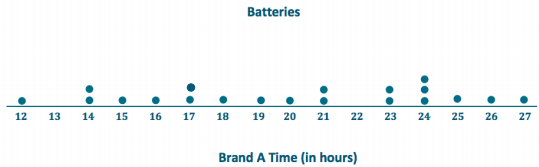
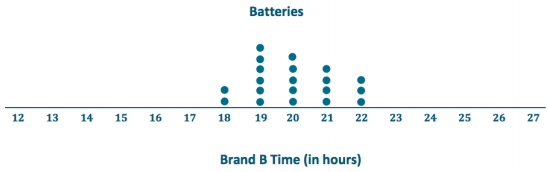
Your little brother asks you to replace the battery in his favorite remote control car. The car is constructed so that it is difficult to replace its battery. Your research of the lifetimes (in hours) of two different battery brands (A and B) shows the following lifetimes for 20 batteries from each brand:

Exercise 4.
To help you decide which battery to purchase, start by drawing a dot plot of the lifetimes for each brand.
Answer:
Exercise 5.
Find the mean battery lifetime for each brand, and compare them.
Answer:
The mean of Brand A is 20 hours.
The mean of Brand B is 20 hours.
Both Brand A and Brand B have the same mean lifetime.
Exercise 6.
Looking at the variability in the dot plot for each data set, give one reason you might choose Brand A. What is one reason you might choose Brand B? Explain your reasoning.
Answer:
Answers will vary.
If I choose Brand A, I might get a battery that lasts a lot longer than 20 hours, on might get a battery that has a much shorter lifetime. If I choose Brand B, I would always geta battery that lasts approximately 20 hours.
Example 2: Comparing Distributions with Different Means
You have been comparing distributions that have the same mean but different variability. As you have seen, deciding whether large variability or small variability is best depends on the context and on what is being asked. If two data distributions have different means, do you think that variability will still play a part in making decisions?
Answer:
Yes, because considering variability in addition to center provides us with more information about the distributions and allows us to make more informed decisions.
Exercises 7 – 9:
Suppose that you wanted to answer the following question: Are field crickets better predictors of air temperature than katydids? Both species of insect make chirping sounds by rubbing their front wings together.
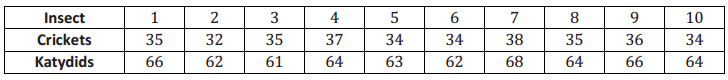
The following data are the number of chirps (per minute) for 10 insects of each type. All the data were taken on the same evening at the same time.
Exercise 7.
Draw dot plots for these two data distributions using the same scale, going from 30 to 70. Visually, what conclusions can you draw from the dot plots?
Answer:
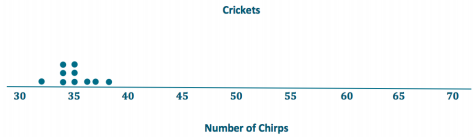
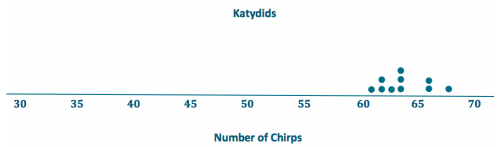
Visually, you can see that the value for the mean number of chirps is higher for the katydids. The variability looks to be similar.
Exercise 8.
Calculate the mean and MAD for each distribution.
Answer:
Crickets: The mean is 35 chirps per minute.
The sum of all the distances from the mean is 12 because 0 + 3 + 0 + 2 + 1 + 1 + 3 + 0 + 1 + 1 = 12. Therefore, the MAD is 1.2 chirps per minute because \(\frac{12}{10}\) = 1. 2.
Katydids: The mean is 64 chirps per minute.
The sum of all the distances from the mean is 16 because 2 + 2 + 3 + 0 + 1 + 2 + 4 + 0 + 2 + 0 = 16. Therefore, the MAD is 1.6 chirps per minute because \(\frac{16}{10}\) = 1.6.
Exercise 9.
The outside temperature T, in degrees Fahrenheit, can be predicted by using two different formulas. The formulas include the mean number of chirps per minute made by crickets or katydids.
a. For crickets, T is predicted by adding 40 to the mean number of chirps per minute. What value of T is being predicted by the crickets?
Answer:
The predicted temperature is 35 + 40, or 75 degrees.
b. For katydids, T is predicted by adding 161 to the mean number of chirps per minute and then dividing the sum by 3. What value of T is being predicted by the katydids?
Answer:
The predicted temperature is \(\frac{(64+161)}{3}\), or 75 degrees.
c. The temperature was 75 degrees Fahrenheit when these data were recorded, so using the mean from each data set gave an accurate prediction of temperature. If you were going to use the number of chirps from a single cricket or a single katydid to predict the temperature, would you use a cricket of a katydid? Explain how variability in the distributions of number of chirps played a role in your decision.
Answer:
The crickets had a smaller MAD. This indicates that an indiuidual cricket is more likely to have a number of chirps that is close to the mean.
Eureka Math Grade 6 Module 6 Lesson 11 Problem Set Answer Key
Question 1.
Two classes took the same mathematics test. Summary measures for the two classes are as follows:
| Mean | MAD | |
| Class A | 78 | 2 |
| Class B | 78 | 10 |
a. Suppose that you received the highest score in your class. Would your score have been higher if you were in Class A or Class B? Explain your reasoning.
Answer:
My score would have been higher if I had been in Class B because the means are the same, and the variability,
as measured by the MAD, is higher in that class than it is in Class A.
b. Suppose that your score was below the mean score. In which class would you prefer to have been? Explain your reasoning.
Answer:
I would prefer to have been in Class A because the variability, as measured by the MAD, indicates a more compact distribution around the mean. In contrast, a score below the mean in Class B could be far lower than in Class A.
Question 2.
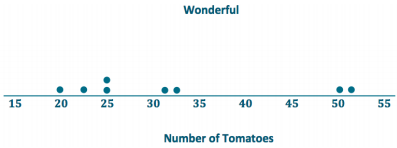
Eight of each of two varieties of tomato plants, LoveEm and Wonderful, are grown under the same conditions. The numbers of tomatoes produced from each plant of each variety are shown:
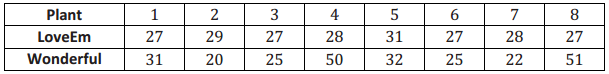
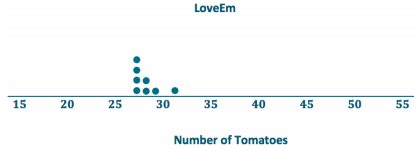
a. Draw dot plots to help you decide which variety is more productive.
Answer:
b. Calculate the mean number of tomatoes produced for each variety. Which one produces more tomatoes on average?
Answer:
The mean number of LoveEm tomatoes is 28, and the mean number of Wonderful tomatoes is 32. Wonderful produces more tomatoes on average.
c. If you want to be able to accurately predict the number of tomatoes a plant is going to produce, which variety should you choose – the one with the smaller MAD or the one with the larger MAD? Explain your reasoning.
Answer:
LoveEm produces fewer tomatoes on average but is far more consistent. Looking at the dot plots, its variability is far less than that of Wonderful tomatoes. Based on these data sets, choosing LoveEm should yield numbers in the high 20’s consistently, but the number from Wonderful could vary wildly from lower yields in the low 20’s too huge yields around 50.
d. Calculate the MAD of each plant variety.
Answer:
The sum of the distances from the mean for LoveEm is 8 because 1 + 1 + 1 + 0 + 3 + 1 + 0 + 1 = 8.
Therefore, the MAD for LoveEm is 1 tomato because \(\frac{8}{8}\) = 1.
The sum of the distances from the mean for Wonderfulis 74 because 1 + 12 + 7 + 18 + 0 + 7 + 10 + 19 = 74. Therefore, the MAD for Wonderful is 9.25 tomatoes because \(\frac{74}{8}\) = 9. 25.
Eureka Math Grade 6 Module 6 Lesson 11 Exit Ticket Answer Key
Question 1.
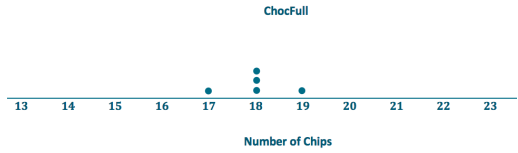
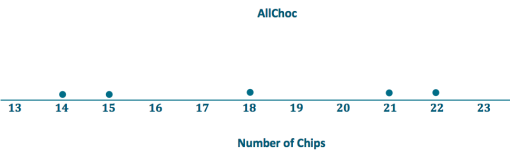
You need to decide which of two brands of chocolate chip cookies to buy. You really love chocolate chip cookies. The numbers of chocolate chips in each of five cookies from each brand are as follows:
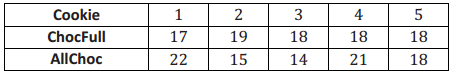
a. Draw a dot plot for each set of data that shows the distribution of the number of chips for that brand. Use the same scale for both of your dot plots (one that covers the span of both distributions).
Answer:
b. Find the mean number of chocolate chips for each of the two brands. Compare the means.
Answer:
Mean for ChocFull: 18 chocolate chips
Mean for AliChoc: 18 chocolate chips
The means for the two different brands are the same.
c. Looking at your dot plots and considering variability, which brand do you prefer? Explain your reasoning.
Answer:
Students could argue either way:
1. Students who prefer ChocFull may argue that they are assured of getting 18 chips most of the time, with no fewer than 17 chips, and a bonus once in a while of 19 chips. With AliChoc, they may sometimes get more than 20 chips but would sometimes get only 14or 15 chips.
2. Students who prefer AllChoc are the risk-takers who are willing to tolerate the chance of getting only 14 or 15 chips for the chance of getting 21 or 22 chips.