Engage NY Eureka Math Grade 6 Module 6 Lesson 12 Answer Key
Eureka Math Grade 6 Module 6 Lesson 12 Example Answer Key
Suppose a chain restaurant (Restaurant A) advertises that a typical number of french fries in a large bag is 82. The dot plot shows the number of french fries in a sample of twenty large bags from Restaurant A.

Sometimes it is useful to know what point separates a data distribution into two equal parts, where one part represents the upper half of the data values and the other part represents the lower half of the data values. This point is called the median. When the data are arranged in order from smallest to largest, the same number of values will be above the median point as below the median.
Exercises 1 – 3:
Exercise 1.
You just bought a large bag of fries from the restaurant. Do you think you have exactly 82 french fries? Why or why not?
Answer:
The number of fries in a bag seems to wary greatly from bag to bag. No bag had exactly 82 fries, so mine probably will not. The bags that were in the sample had from 66 to 93 french fries.
Exercise 2.
How many bags were in the sample?
Answer:
20 bags were port of the sample.
Exercise 3.
Which of the following statement(s) would seem to be true for the given data? Explain your reasoning.
a. Half of the bags had more than 82 fries in them.
b. Half of the bags had fewer than 82 fries in them.
c. More than half of the bags had more than 82 fries in them.
d. More than half of the bags had fewer than 82 fries in them.
e. If you got a random bag of fries, you could get as many as 93 fries.
Answer:
Statements (a) and (b) are true because there are 10 bags above 82 fries and 10 bags below 82 fries. Also, statement (e) is true because that happened once, so ¡t could probably happen again.
Example 2:
Examine the dot plot below.

a. How many data values are represented on the dot plot above?
Answer:
There are 28 data values on the dot plot.
b. How many data values should be located above the median? How many below the median? Explain.
Answer:
There should be 14 data values above the median and 14 data values below the median because the median represents the middle value in o sorted data set.
c. For this data set, 14 values are 80 or smaller, and 14 values are 85 or larger, so the median should be between 80 and 85. When the median falls between two values in a data set, we use the average of the two middle values. For this example, the two middle values are 80 and 85. What is the median of the data presented on the dot plot?
Answer:
The median of the dot plot is 82.5.
d. What does this information tell us about the data?
Answer:
The median tells us half of the students in the class scored below an 82. 5 on the science test, and the other half of the students scored above 82.5 on the science test.
Example 3:
Use the information from the dot plot In Example 2.
a. What percentage of students scored higher than the median? Lower than the median?
Answer:
50% of the students scored higher than the median, and 50% of the students scored lower than the median.
b. Suppose the teacher made a mistake, and the student who scored a 65 actually scored a 71. Would the median change? Why or why not?
Answer:
The median would not change because there would still be 14 scores below 82 5 and 14 scores above 82.5.
c. Suppose the student who scored a 65 actually scored an 89. Would the median change? Why or why not?
Answer:
The median would change because now there would be 13 scores below 82. 5 and 15 scores above 82.5, so 82.5 would not be the median.
Example 4:
A grocery store usually has three checkout lines open on Saturday afternoons. One Saturday afternoon, the store manager decided to count how many customers were waiting to check out at 10 different times. She calculated the median of her ten data values to be 8 customers.
a. Why might the median be an important number for the store manager to consider?
Answer:
Answers will vary. For example, students might point out that this means that half the time there were mœe than 8 customers waiting to check out. if there are only 3 checkout lines open, there would be a lot of people waiting to check out. She might want to consider having more checkout lines open on Saturday afternoons.
b. Give another example of when the median of a data set might provide useful information. Explain your thinking.
Answer:
Answers will vary.
Possible responses: When the data are about how much time students spend doing homework, it would be interesting to know the amount of time that more than half of the students spend on homework. If you are looking at the number of points earned in a competition, it would be good to know what number separates the top half of the competitors from the bottom half.
Exercises 4 – 5: A Skewed Distribution
Exercise 4.
The owner of the chain decided to check the number of french fries at another restaurant in the chain. Here are the data for Restaurant B: 82, 83, 83, 79, 85. 82, 78, 76, 76, 75, 78, 74, 70, 60, 82, 82, 83, 83, 83
a. How many bags of fries were counted?
Answer:
19 bags of fries were counted.
b. Sallee claims the median is 75 because she sees that 75 is the middle number in the data set listed on the previous page. She thinks half of the bags had fewer than 75 fries because there are 9 data values that come before 75 in the list, and there are 9 data values that come after 75 in the list. Do you think she would change her mind if the data were plotted in a dot plot? Why or why not?
Answer:
Yes. You cannot find the median unless the data are organized from least to greatest. Plotting the number of fries in each bag on a dot plot would order the data correctly. You would probably get a different halfway point because the data above are not ordered from least to greatest.
c. Jake said the median was 83. What would you say to Jake?
Answer:
83 is the most common number of fries in the bags (5 bags had 83 fries), but It is not in the middle of the data.
d. Betse argued that the median was halfway between 60 and 85, or 72.5. Do you think she is right? Why or why not?
Answer:
She is wrong because the median is not calculated from the distance between the largest and smallest value in the data set. This is not the same as finding a point that separates the ordered data into two ports with the same number of values in each part.
e. Chris thought the median was 82. Do you agree? Why or why not?
Answer:
Chris is correct because ¡f you order the numbers, the middle number will be the 10th number in the ordered list, with at most 9 bags that have more than 82 fries and at most 9 bogs that have fewer than 82 fries.
Exercise 5.
Calculate the mean, and compare it to the median. What do you observe about the two values? If the mean and median are both measures of center, why do you think one of them is smaller than the other?
Answer:
The mean is 78.6, and the median is 82. The bag with only 60 fries decreased the value of the mean.
Exercises 6 – 8: Finding Medians from Frequency Tables
Exercise 6.
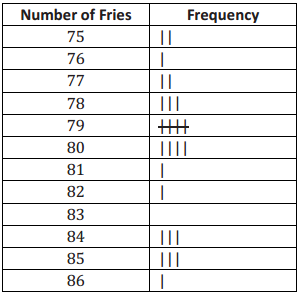
A third restaurant (Restaurant C) tallied the number of fries for a sample of bags of french fries and found the results below.

a. How many bags of fries did they count?
Answer:
They counted 26 bags of fries.
b. What is the median number of fries for the sample of bags from this restaurant? Describe how you found your answer.
Answer:
79.5; I took half of 26, which is 13, and then counted 13 tallies from 86 to reach 80. I also counted 13 tallies from 75 to reach 79. The point halfway between 79 and 80 is the median.
Exercise 7.
Robere wanted to look more closely at the data for bags of fries that contained a smaller number of fries and bags that contained a larger number of fries. He decided to divide the data into two parts. He first found the median of the whole data set and then divided the data set into the bottom half (the values in the ordered list that are before the median) and the top half (the values in the ordered list that are after the median).
a. List the 13 values in the bottom half. Find the median of these 13 values.
Answer:
75 75 76 77 77 78 78 78 79 79 79 79 79
The median of the lower half is 78.
b. List the 13 values of the top half. Find the median of these 13 values.
Answer:
80 80 80 80 81 82 84 84 84 85 85 85 86
The median of the top half is 84.
Exercise 8.
Which of the three restaurants seems most likely to really have 82 fries in a typical bag? Explain your thinking.
Answer:
Answers will vary. The data sets for Restaurants A and B both have a median of 82. Look for answers that consider how much the data values vary around 82. Restaurant B seems to have the most bogs closest to a count of 82. The data set for Restaurant C has a median of 79.5, but the data values are not very spread out, and most are close to 82, so some students might make a case for Restaurant C.
Eureka Math Grade 6 Module 6 Lesson 12 Problem Set Answer Key
Question 1.
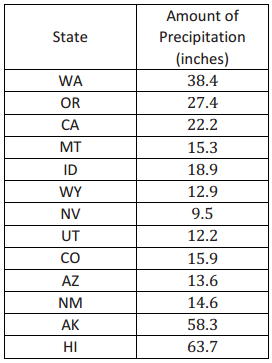
The amount of precipitation in each of the western states in the United States is given in the table as well as the dot plot.


a. How do the amounts vary across the states?
Answer:
Answers will vary. The spread is pretty large: 54.2 inches. Nevada has the lowest precipitation at 9.5 inches per year. Hawaii, Alaska, and Washington have more rain than most of the states. Hawaii has the most precipitation with 63.7 inches, followed by Alaska at 58.3 inches.
b. Find the median. What does the median tell you about the amount of precipitation?
Answer:
The median is 15.9 inches. Half of the western states have more than 15.9 inches of precipitation per year, and half have less.
c. Do you think the mean or median would be a better description of the typical amount of precipitation? Explain your thinking.
Answer:
The mean at 24.8 inches reflects the extreme values, while the median seems more typical at 15.9 inches.
Question 2.
Identify the following as true or false. If a statement is false, give an example showing why.
a. The median is always equal to one of the values in the data set.
Answer:
False. If the middle two values in the ordered data set are 1 and 5, the median is 3, and 3 is not in the set.
b. The median is halfway between the least and greatest values in the data set.
Answer:
False. For example, looking at the number of french fries per bog for Restaurant A in Example 1, the median is 82, which is not halfway between 66 and 93 (79.5).
c. At most, half of the values in a data set have values less than the median.
Answer:
True
d. In a data set with 25 different values, if you change the two smallest values in the data set to smaller values, the median will not be changed.
Answer:
True
e. If you add 10 to every value in a data set, the median will not change.
Answer:
False. The median will increase by 10 as well. If the data set is 1, 2, 3, 4, 5, the median is 3. For the data set 11, 12, 13, 14,15, the median is 13.
Question 3.
Make up a data set such that the following is true:
a. The data set has 11 different values, and the median is 5.
Answer:
Answers will vary. If the numbers are whole numbers, the set would be 0, 1, 2, 3, 4, 5, 6, 7, 8, 9, 10.
b. The data set has 10 values, and the median is 25.
Answer:
Answers will vary. One answer is to have ten values that are all 25’s.
c. The data set has 7 values, and the median is the same as the least value.
Answer:
Answers will vary. One answer is to have 1, 1, 1, 1, 2, 3, 4.
Question 4.
The dot plot shows the number of landline phones that a sample of people have in their homes.

a. How many people were in the sample?
Answer:
There are 25 people in the sample.
b. Why do you think three people have no landline phones in their homes?
Answer:
Possible answers: Some people might only have cell phones or some people may not be able to afford a phone or may not want a phone.
c. Find the median number of phones for the people in the sample.
Answer:
The median number of phones per home is 2.
Question 5.
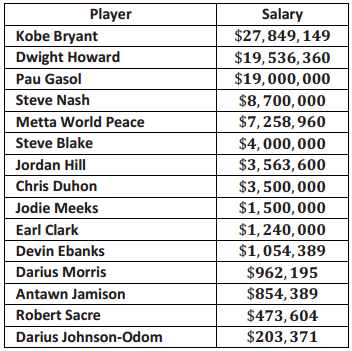
The salaries of the Los Angeles Lakers for the 2012 – 2013 basketball season are given below. The salaries in the table are ordered from largest to smallest.

a. Just looking at the data, what do you notice about the salaries?
Answer:
Possible answer: A few of the salaries for the big stars like Kobe Bryant are really big, while others are very small in comparison.
b. Find the median salary, and explain what it tells you about the salaries.
Answer:
The median salary ¡s $3, 500,000 for Chris Duhon. Half of the players make more than $3, 500,000, and half of the players make less than $3, 500, 000.
c. Find the median of the lower half of the salaries and the median of the upper half of the salaries.
Answer:
$962, 195 is the median for the bottom half of the salaries. $8, 700,000 is the median for the top half of the salaries.
d. Find the width of each of the following intervals. What do you notice about the size of the interval widths, and what does that tell you about the salaries?
i. Minimum salary to the median of the lower half:
Answer:
$758, 824
ii. Median of the lower half to the median of the whole data set:
Answer:
$2,537,805
iii. Median of the whole data set to the median of the upper half:
Answer:
$5, 200, 000
iv. Median of the upper half to the highest salary:
Answer:
$19,149,149
The largest width is from the median of the upper half to the highest salary. The smaller salaries are closer together than the larger ones.
Question 6.
Use the salary table from the previous page to answer the following.
a. If you were to find the mean salary, how do you think it would compare to the median? Explain your reasoning.
Answer:
Possible answer: The mean will be a lot larger than the median because when you add in the really big salaries, the size of the mean will increase a lot.
b. Which measure do you think would give a better picture nf a typical salary for the Lakers, the mean or the median? Explain your thinking.
Answer:
Possible answer: The median seems better, os ¡t ¡s more typical of most of the salaries.
Eureka Math Grade 6 Module 6 Lesson 12 Exit Ticket Answer Key
Question 1.
What is the median age for the following data set representing the ages of students requesting tickets for a summer band concert? Explain your reasoning.
13 14 15 15 16 16 17 18 18
Answer:
The median is the 5th value in the ordered list, or 16 years, as there are 4 values less than 16 and 4 values greater than or equal to 16 (excluding the 5 value).
Question 2.
What ¡s the median number of diseased trees from a data set representing the numbers of diseased trees on each of 12 city blocks? Explain your reasoning.
11 3 3 4 6 12 9 3 8 8 8 1
Answer:
To find the median, the values first need to be ordered: 1 3 3 3 4 6 8 8 8 9 11 12.
Because there are an even number of data values, the median would be the mean of the 6th and 7th values: \(\frac{6+8}{2}\) or 7 diseased trees.
Question 3.
Describe how you would find the median for a set of data that has 35 values. How would this be different if there were 36 values?
Answer:
Answers will vary. First, you would order the data from kast to greatest. Because there are 35 values, you would look for the 18th value from the top or bottom in the ordered list. This would be the median with 17 values above and 17 values below, if the set hod 36 values, you would find the average of the middle two data values, which would be the average of the 18th and the 19th values in the ordered list.