Engage NY Eureka Math Grade 6 Module 6 Lesson 7 Answer Key
Eureka Math Grade 6 Module 6 Lesson 7 Example Answer Key
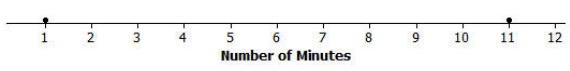
Sabina wants to know how long it takes students to get to school. She asks two students how long it takes them to get to school. It takes one student 1 minute and the other student 11 minutes. Sabina represents these data values on a ruler, putting a penny at 1 inch and another at 11 inches.
Sabina thinks that there might be a connection between the mean of two data points and where they balance on a ruler. She thinks the mean may be the balancing point. Sabina shows her data using a dot plot.
Dot plot of Number of Minutes
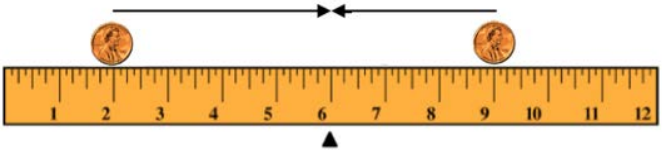
Sabina decides to move the penny at 1 inch to 4 inches and the other penny from 11 inches to 8 inches on the ruler, noting that the movement for the two pennies is the same distance but in opposite directions. Sabina thinks that if two data points move the same distance but in opposite directions, the balancing point on the ruler does not change. Do you agree with Sabina?
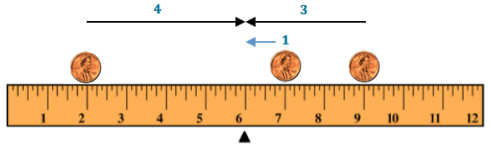
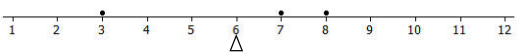
Sabina continues by moving the penny at 4 inches to 6 inches. To keep the ruler balanced at 6 inches, how far should Sabina move the penny from 8 inches, and in what direction?
Answer:
Since the penny at inches moved two to the right, to maintain the balance, the penny at inches needs to move two inches to the left. Both pennies are now at inches, and the ruler clearly balances there. Note that the mean of these two values (minutes and minutes) is still minutes.
Exercises 1 – 2:
Now it is your turn to try balancing two pennies on a ruler.
Exercise 1.
Tape one penny at 2.5 inches on your ruler.
a. Where should a second penny be taped so that the ruler will balance at 6 inches?
Answer:
The penny should be at 9. 5 inches.
b. How far is the penny at 2. 5 inches from 6 inches? How far is the other penny from 6 inches?
Answer:
Each penny Is 3.5 inches away from 6 inches.
c. Is 6 inches the mean of the two locations of the pennies? Explain how you know this.
Answer:
Yes, the mean of the two locations of the pennies is 6 inches. The distance of the penny that is below 6 inches is equal to the distance to the penny that is above 6 inches.
Exercise 2.
Move the penny that is at 2.5 inches to the right two inches.
a. Where will the penny be placed?
Answer:
The penny will be placed at 4.5 inches.
b. What do you have to do with the other data point (the other penny) to keep the balance point at 6 inches?
Answer:
I will have to move it 2 inches to the left.
c. What is the mean of the two new data points? Is it the same value as the balance point of the ruler?
Answer:
The mean is 6. It is the same value as the balance point of the ruler. (Remember that the ruler might not balance at exactly 6, depending on the accuracy of the placement of the two pennies on the ruler.)
Example 2: Balancing More Than Two Points
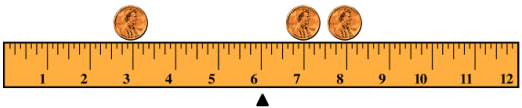
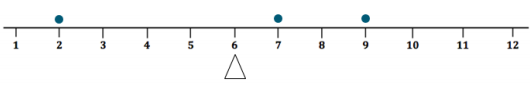
Sabina wants to know what happens if there are more than two data points. Suppose there are three students. One student lives 2 minutes from school, and another student lives 9 minutes from school. If the mean time for all three students is 6 minutes, she wonders how long it takes the third student to get to school. Using what you know about distances from the mean, where should the third penny be placed in order for the mean to be 6 inches? Label the diagram, and explain your reasoning.
The third penny should be placed at 7 inches. The 7 is 1 inch from 6 inches, and the 9 is 3 inches from 6 inches. Combined, the total distance for these two pennies is 4 inches. Since the distance of the point on the left of 6 inches is also 4 inches, the mean is now 6 inches.
Exercises 3 – 6:
Imagine you are balancing pennies on a ruler.
Exercise 3.
Suppose you place one penny each at 3 inches, 7 inches, and 8 inches on your ruler.
a. Sketch a picture of the ruler. At what value do you think the ruler will balance? Mark the balance point with the symbol ∆.
Answer:
Students should represent the pennies at 3 inches, 7 inches, and 8 inches on the ruler with a balancing point at 6 inches.
b. What is the mean of 3 inches, 7 inches, and 8 inches? Does your ruler balance at the mean?
Answer:
The mean is 6 inches. Yes, it balances at the mean.
c. Show the information from part (a) on a dot plot. Mark the balance point with the symbol ∆.
Answer:
d. What are the distances on each side of the balance point? How does this prove the mean is 6?
Answer:
The distance to the left of the mean (the distance between 3 and 6): 3
One of the distances to the right of the mean (the distance between 7 and 6): 1
One of the distances to the right of the mean (the distance between 8 and 6): 2
The total of the distances to the right of the mean: 2 + 1 = 3
The mean is 6 because the total of the distances on either side of 6 is 3.
Exercise 4.
Now, suppose you place a penny each at 7 inches and 9 inches on your ruler.

a. Draw a dot plot representing these two pennies.
Answer:
b. Estimate where to place a third penny on your ruler so that the ruler balances at 6 inches, and mark the point on the dot plot above. Mark the balance point with the symbol A.
Answer:
The third penny should be placed of 2 inches.
c. Explain why your answer in part (b) is true by calculating the distances of the points from 6. Are the totals of the distances on either side of the mean equal?
Answer:
The distance to the left of the mean (the distance between 2 and 6): 4
One of the distances fo the right of the mean (the distance between 7 and 6): 1
One of the distances to the right of the mean (the distance between 9 and 6): 3
The total of the distances to the right of the mean: 3 + 1 = 4
The mean is 6 because the total of the distances on either side of 6 is 4.
Exercise 5.
Is the concept of the mean as the balance point true if you put multiple pennies on a single location on the ruler?
Answer:
Yes. The balancing process is applicable to stacking pennies or having more thon one dato point at the same location on a dot plot. (If students have difficulty seeing this, remind them of the fair share interpretation of the mean using a dot plot, where oil of the dots were stacked up at the mean.)
Exercise 6.
Suppose you place two pennies at 7 inches and one penny at 9 inches on your ruler.

a. Draw a dot plot representing these three pennies.
Answer:
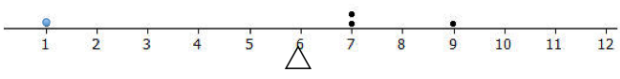
b. Estimate where to place a fourth penny on your ruler so that the ruler balances at 6 inches, and mark the point on the dot plot above. Mark the balance point with the symbol.
Answer:
The fourth penny should be placed at 1 inch.
c. Explain why your answer in part (b) is true by calculating the distances of the points from 6. Are the totals of the distances on either side of the mean equal?
Answer:
The total of the distances to the left of the mean is 5. The total of the distances to the right of the mean can be found by calculating the distance between 7 and 6 twice, since there are two data points at 7, and then adding it to the distance between 9 and 6. Therefore, the total of the distances to the right of the mean is 5 because 1 + 1 + 3 = 5, which is equal to the total of the distances to the left of the mean.
Example 3: Finding the Mean
What if the data on a dot plot were 1, 3, and 8? Will the data balance at 6? If not, what is the balance point, and why?
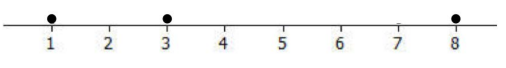
The data do not balance at 6. The balance point must be 4 in order for the total of the distances on either side of the mean to be equal.
Exercise 7.
Use what you have learned about the mean to answer the following questions.
Recall from Lesson 6 that Michelle asked ten of her classmates for the number of hours they usually sleep when there is school the next day. Their responses (in hours) were 8, 10, 8, 8, 11, 11,9, 8, 10, 7.
a. It’s hard to balance ten pennies. Instead of actually using pennies and a ruler, draw a dot plot that represents the data set.

Answer:
b. Use your dot plot to find the balance point.
Answer:
A balance point of 9 would mean the total of the distances to the left of 9 is 6 because 2 + 1 + 1 + 1 + 1 = 6, and the total of the distances to the right of 9 is 6 because 1 + 1 + 2 + 2 = 6. Since the totals of the distances on each side of the mean are equal, 9 is the balance point. The data point that is directly on 9 has a distance of zero, which does not change the total of the distances to the right or the left of the mean.
Eureka Math Grade 6 Module 6 Lesson 7 Problem Set Answer Key
Question 1.
The number of pockets in the clothes worn by four students to school today is 4, 1, 3, 4.
a. Perform the fair share process to find the mean number of pockets for these four students. Sketch the cube’s representations for each step of the process.
Answer:
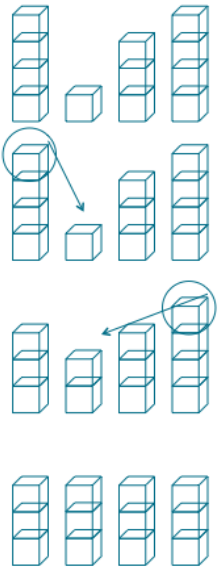
Each of the 4’s gives up a pocket to the person with one pocket, yielding four stacks of three pockets each. The mean is 3 pockets.
b. Find the total of the distances on each side of the mean to show the mean found in part (a) is correct.
Answer:
The mean is correct because the total of the distances to the left of 3 is 2 and the total of the distances to the right of 3 is 2 because 1 + 1 = 2
Question 2.
The times (rounded to the nearest minute) it took each of six classmates to run a mile are 7, 9, 10, 11, 11, and 12 minutes.
a. Draw a dot plot representation for the mile times.
Answer:
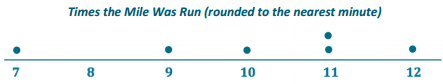
b. Suppose that Sabina thinks the mean is 11 minutes. Is she correct? Explain your answer.
Answer:
Sabina is incorrect. The total of the distances to the left of 11 is 7 and the total of the distances to the right of 11 is 1. The totals of the distances are not equal; therefore, the mean cannot be 11 minutes.
c. What is the mean?
Answer:
For the total of the distances to be equal on either side of the mean, the mean must be 10 because on the left of 10 the total of the distances is 4 because 1 + 3 = 4, and the total of the distances to the right of 10 is 4 because 1 + 1 + 2 = 4.
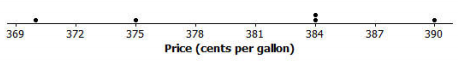
Question 3.
The prices per gallon of gasoline (in cents) at five stations across town on one day are shown in the following dot plot. The price for a sixth station is missing, but the mean price for all six stations was reported to be 380 cents per gallon. Use the balancing process to determine the price of a gallon of gasoline at the sixth station.
Dot Plot of Price(cents per gallon)
Answer:
To find the price per gallon of gasoline at the sixth station, we need to assess the distances from 380 of the five current data points and then place the sixth data point to ensure that the total of the distances to the left of the mean equals the total of the distances to the right of the mean.
Currently, the total of the distances to the left of 380 is 15 because 5 + 10 = 15, and the total of the distances to the right of 380 is 18 because 4 + 4 + 10 = 18. For the mean of all six prices to be 380, the total of the distances to the left of 380 needs to be 18. This means we need to place a dot three cents to the left of the mean. 380 – 3 = 377. The sixth price is 377 cents per gallon.
Question 4.
The number of phones (landline and cell) owned by the members of each of nine families is 3, 5, 6, 6, 6, 6, 7, 7, 8.
a. Use the mathematical formula for the mean (determine the sum of the data points, and divide by the number of data points) to find the mean number of phones owned for these nine families.
Answer:
\(\frac{54}{9}\)= 6. The mean is 6 phones.
b. Draw a dot plot of the data, and verify your answer in part (a) by using the balancing process.
Answer:
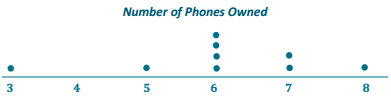
The total of the distances to the left of 6 is 4 because 3 + 1 = 4. The total of the distances to the right of 6 is 4 because 1 + 1 + 2 = 4. Since both totals are equal, 6 is the correct mean.
Eureka Math Grade 6 Module 6 Lesson 7 Exit Ticket Answer Key
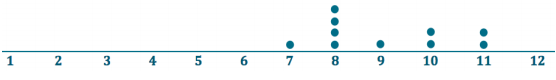
Question 1.
The dot plot below shows the number of goals scored by a school’s soccer team in 7 games so far this season.
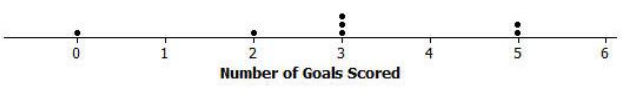
Use the balancing process to explain why the mean number of goals scored is 3.
Answer:
The total of the distances to the left of 3 is 4 because 1+ 3 = 4. The total of the distances to the right of 3 is also 4 because 2 + 2 = 4. Since the totals of the distances on either side of the mean are equal, then 3 must be the mean.