Engage NY Eureka Math 7th Grade Module 1 Lesson 5 Answer Key
Eureka Math Grade 7 Module 1 Lesson 5 Opening Exercise Answer Key
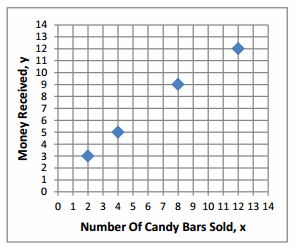
Isaiah sold candy bars to help raise money for his scouting troop. The table shows the amount of candy he sold compared to the money he received
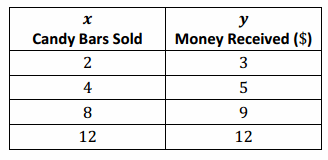
Is the amount of candy bars sold proportional to the money Isaiah received? How do you know?
___________________________________________________________________
Answer:
The two quantities are not proportional to each other because a constant describing the proportion does not exist.
Eureka Math Grade 7 Module 1 Lesson 5 Exploratory Challenge Answer Key
From a Table to a Graph
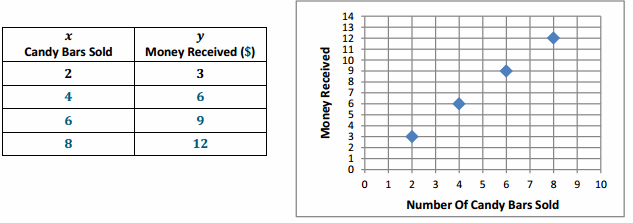
Using the ratio provided, create a table that shows that money received is proportional to the number of candy bars sold. Plot the points in your table on the grid.
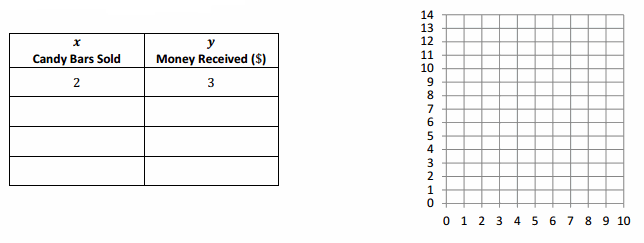
Answer:
Eureka Math Grade 7 Module 1 Lesson 5 Problem Set Answer Key
Example 1.
Graph the points from the Opening Exercise.
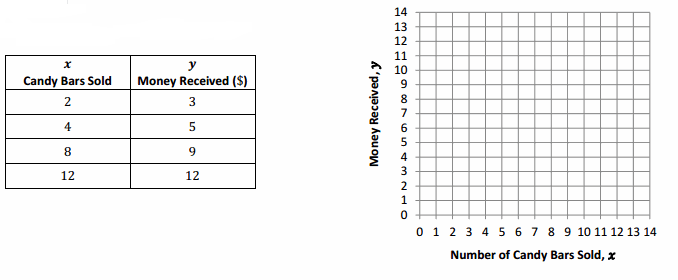
Answer:
Example 2.
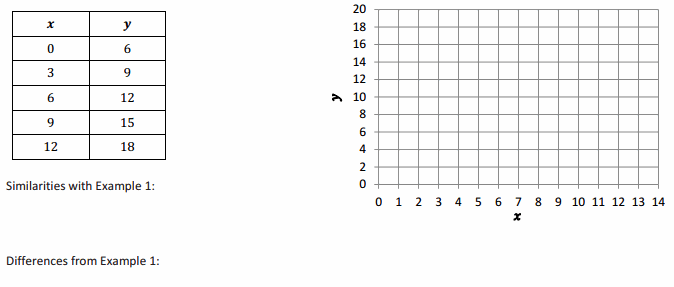
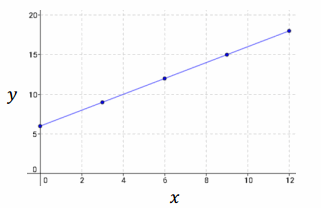
Graph the points provided in the table below, and describe the similarities and differences when comparing your graph to the graph in Example 1.
Answer:
Similarities with Example 1:
Answer:
The points of both graphs fall in a line.
Differences from Example 1:
Answer:
The points of the graph in Example 1 appear on a line that passes through the origin. The points of the graph in Example 3 appear on a line that does not pass through the origin.
Eureka Math Grade 7 Module 1 Lesson 5 Problem Set Answer Key
Question 1.
Determine whether or not the following graphs represent two quantities that are proportional to each other. Explain your reasoning.
a. 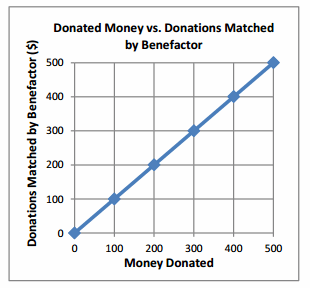
Answer:
This graph represents two quantities that are proportional to each other because the points appear on a line, and the line that passes through the points would also pass through the origin.
b. 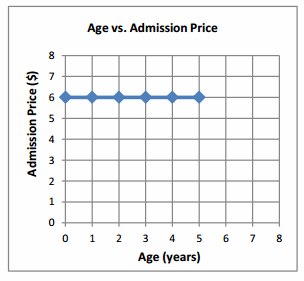
Answer:
Even though the points appear on a line, the line does not go through the origin. Therefore, this graph does not represent a proportional relationship.
c. 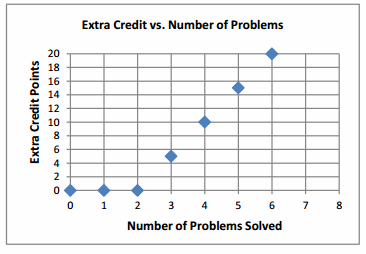
Answer:
Even though it goes through the origin, this graph does not show a proportional relationship because the points do not appear on one line.
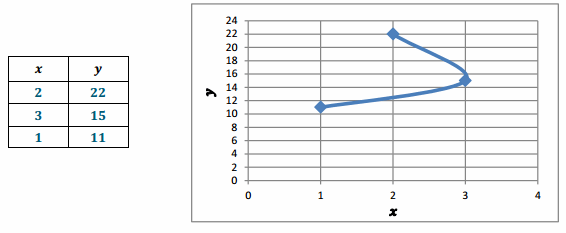
Question 2.
Create a table and a graph for the ratios 2:22, 3 to 15, and 1:11. Does the graph show that the two quantities are proportional to each other? Explain why or why not.
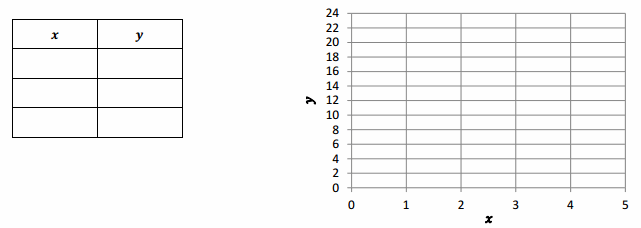
Answer:
This graph does not because the points do not appear on a line that goes through the origin.
Question 3.
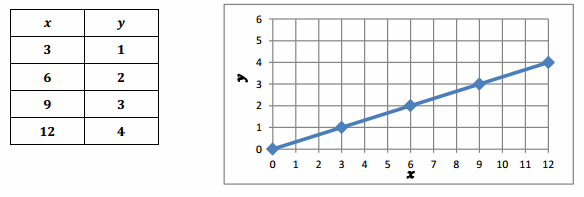
Graph the following tables, and identify if the two quantities are proportional to each other on the graph. Explain why or why not.
a. 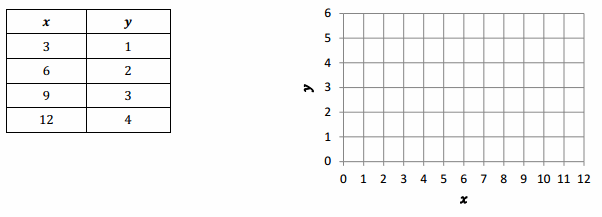
Answer:
Yes, because the graph of the relationship is a straight line that passes through the origin.
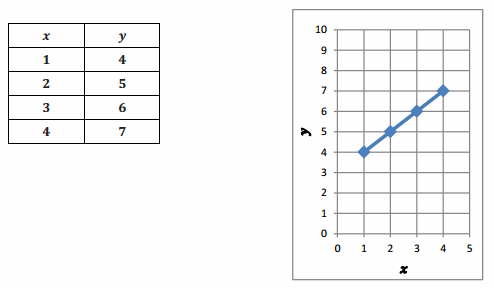
b. 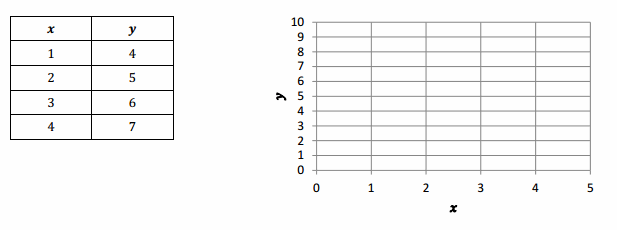
Answer:
No, because the graph does not pass through the origin.
Eureka Math Grade 7 Module 1 Lesson 5 Exit Ticket Answer Key
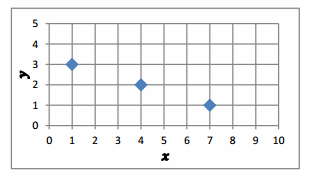
Question 1.
The following table gives the number of people picking strawberries in a field and the corresponding number of hours that those people worked picking strawberries. Graph the ordered pairs from the table. Does the graph represent two quantities that are proportional to each other? Explain why or why not.
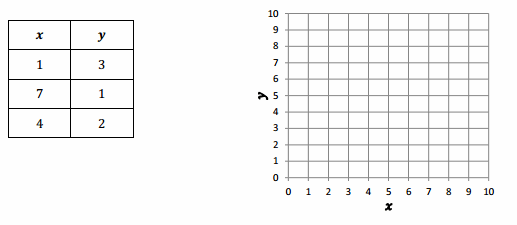
Answer:
Although the points fall on a line, the line does not pass through the origin, so the graph does not represent two quantities that are proportional to each other.
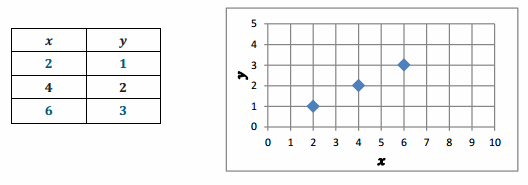
Question 2.
Use the given values to complete the table. Create quantities proportional to each other and graph them.
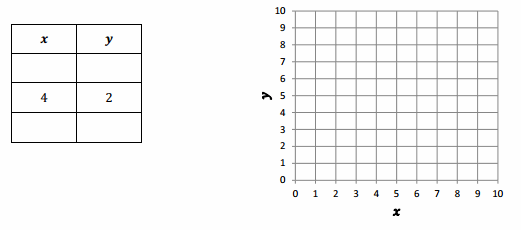
Answer:
Question 3.
a. What are the differences between the graphs in Problems 1 and 2?
Answer:
The graph in Problem 1 forms a line that slopes downward, while the graph in Problem 2 slopes upward.
b. What are the similarities in the graphs in Problems 1 and 2?
Answer:
Both graphs form lines, and both graphs include the point (4,2).
c. What makes one graph represent quantities that are proportional to each other and one graph not represent quantities that are proportional to each other in Problems 1 and 2?
Answer:
Although both graphs form lines, the graph that represents quantities that are proportional to each other needs to pass through the origin.