Engage NY Eureka Math 7th Grade Module 5 Lesson 16 Answer Key
Eureka Math Grade 7 Module 5 Lesson 16 Example Answer Key
Example 2: Using Random Numbers to Select a Sample
The histogram indicates the differences in the number of words in the collection of 150 books. How many words are typical for a best-selling children’s book? Answering this question would involve collecting data, and there would be variability in those data. This makes the question a statistical question. Think about the 150 books used to create the histogram on the previous page as a population. How would you go about collecting data to determine the typical number of words for the books in this population?
How would you choose a random sample from the collection of 150 books discussed in this lesson?
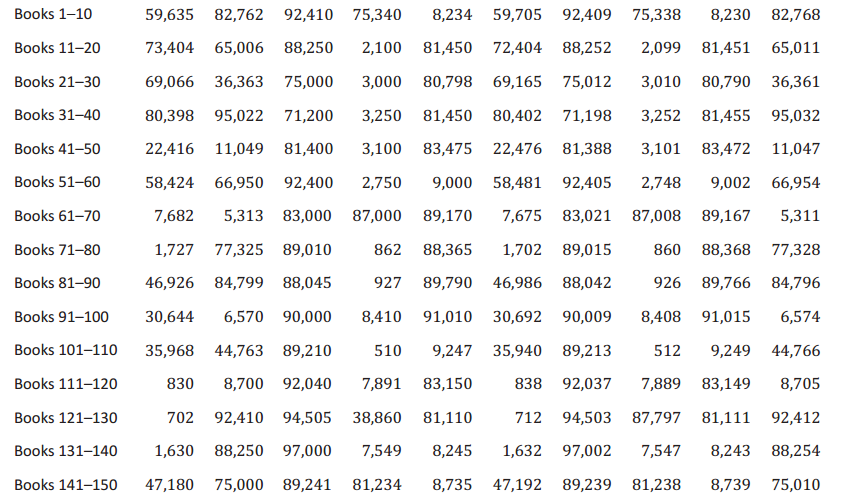
The data for the number of words in the 150 best-selling children’s books are listed below. Select a random sample of the number of words for 10 books.
Answer:
Sample response: I would add up all of the words in the 150 books and divide by 150. This would be the mean number of words for the 150 books. As the data distribution is not symmetrical, I could also find the median of the 150 books, as it would be a good description of the typical number of words. (Note: Discuss with students that using data for all 150 books is very tedious. As a result, students may indicate that selecting a random sample of the 150 books might be a good way to learn about the number of words in these children’s books.)
Sample response: I would make 150 slips of paper that contained the names of the books. I would then put the slips of paper in a bag and select 10 or 15 books. The number of pages of the books selected would be my sample.
If necessary, explain how to use ten numbers selected from a bag that contains the numbers from 1 to 150 to select the books for the sample.
If students need more direction in finding a random sample, develop the following example: Consider the following random numbers obtained by drawing slips from a bag that contained the numbers 1 to 150: {114,65,77,38,86,105,50,1,56,85}. These numbers represent the randomly selected books. To find the number of words in those books, order the random numbers {1,38,50,56,75,77,85,86,105,114}. Count from left to right across the first row of the list of the number of words, then down to the second row, and so on. The sample consists of the 1st element in the list, the 38th, the 50th, and so on.
Use the above example of random numbers to help students connect the random numbers to the books selected and to the number of words in those books.
→ What number of words corresponds to the book identified by the random number 1?
59,635; the 1st children’s book listed has 59,635 words.
→ What number of words corresponds to the book identified by the random number 38?
3,252; the 38th children’s book listed has 3,252 words.
Eureka Math Grade 7 Module 5 Lesson 16 Exercise Answer Key
Exercises 1–2
Exercise 1.
From the table, choose two books with which you are familiar, and describe their locations in the data distribution shown in the histogram.
Answer:
Answers will vary. Sample response: I read The Mouse and the Motorcycle, and that has 22,416 words. It is below the median number of words and may be below the lower quartile. Harry Potter and the Chamber of Secrets has 84,799 words. It is one of the books with lots of words but may not be in the top quarter for the total number of words.
Exercise 2.
Put dots on the number line below that you think would represent a random sample of size 10 from the number of words distribution above.

Answer:
Answers will vary. The sample distribution might have more values near the maximum and minimum than in the center.
Exercises 3–6
Exercise 3.
Follow your teacher’s instructions to generate a set of 10 random numbers. Find the total number of words corresponding to each book identified by your random numbers.
Answer:
Answers will vary. Sample response: I generated random numbers 123, 25, 117, 119, 93, 135, 147, 69, 48, 46, which produces the sample 94505, 80798, 92037, 83149, 90000, 8245, 89239, 89167, 3101, 22476.
Exercise 4.
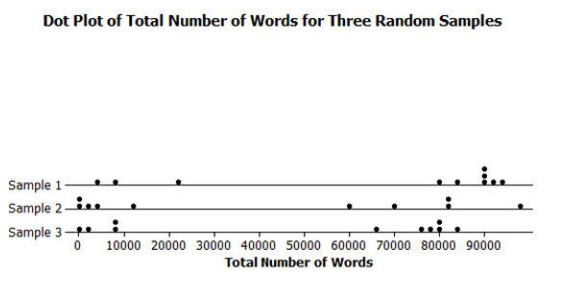
Choose two more different random samples of size 10 from the data, and make a dot plot of each of the three samples.
Answer:
Answers will vary. One possible response is displayed below.
Exercise 5.
If your teacher randomly chooses 10 books from your summer vacation reading list, would you be likely to get many books with a lot of words? Explain your thinking using statistical terms.
Answer:
Answers will vary. Sample response: From my samples, it looks like I probably would get at least one book that had over 90,000 words because the maximum in each of the samples approached or exceeded 90,000 words. The three samples vary a lot, probably because the sample size is only 10. The median numbers of words for the three samples were about 86,000, 35,000, and 70,000, respectively, so it seems like at least half of the books would contain about 50,000 or more words.
Exercise 6.
If you were to compare your samples to your classmates’ samples, do you think your answer to Exercise 5 would change? Why or why not?
Answer:
Answers will vary. Sample response: The sample size is pretty small, so different samples might be different. I still think that I would have to read some books with a lot of words because of the shape of the population distribution.
Exercises 7–9: A Statistical Study of Balance and Grade
Exercise 7.
Is the following question a statistical question: Do sixth graders or seventh graders tend to have better balance?
Answer:
Yes, this is a statistical question because the data collected would vary between sixth and seventh graders.
Exercise 8.
Berthio’s class decided to measure balance by finding out how long people can stand on one foot.
a. How would you rephrase the question from Exercise 7 to create a statistical question using this definition of balance? Explain your reasoning.
Answer:
a. Answers will vary. Sample response: What is the typical length of time that a seventh grader can balance on one foot? The data collected to answer this question will have some variability—1 min., 2 min., 2 min. 10 sec., and so on. So, it is also a statistical question.
b. What should the class think about to be consistent in how they collect the data if they actually have people stand on one foot and measure the time?
Answer:
Sample response: Would it make a difference if students stood on their right feet or on their left? How high do they have to hold their feet off the ground? Can they do it barefoot or with shoes on? Would tennis shoes be better than shoes with higher heels? What can we use to measure the time?
Exercise 9.
Work with your class to devise a plan to select a random sample of sixth graders and a random sample of seventh graders to measure their balance using Berthio’s method. Then, write a paragraph describing how you will collect data to determine whether there is a difference in how long sixth graders and seventh graders can stand on one foot. Your plan should answer the following questions:
a. What is the population? How will samples be selected from the population? Why is it important that they be random samples?
Sample response: The populations will be all of the sixth graders and all of the seventh graders in our school. To get a random sample, we will find the number of sixth graders, say 62, and generate a list of 15 random numbers from the set 1 to 62, that is, {4,17,19,25,…}. Then, we will go into one classroom and count off the students beginning with 1 and use student 4, 17, and 19. Then we will go into the next classroom and count off the students beginning where we left off in the first room and so on. We will do the same for the seventh graders. This will give random samples because it offers every sixth and seventh grader the same chance of being selected (if using this plan with both grades).
b. How would you conduct the activity?
Answer:
Sample response: Students will stand for as long as they can using whichever foot they choose in their stocking or bare feet with their eyes open. We will time them to the nearest second using stopwatches from our science class. We will have students do the activity one at a time out in the hall so they cannot see each other.
c. What sample statistics will you calculate, and how will you display and analyze the data?
Answer:
Sample response: The sample statistics will be the mean time (in seconds) standing on one foot for the sixth graders and seventh graders. We will make a dot plot of the times for the sixth graders and for the seventh graders using parallel number lines with the same scale.
d. What would you accept as evidence that there actually is a difference in how long sixth graders can stand on one foot compared to seventh graders?
Answer:
We will compare the shape, center, and spread of the sample distributions of times for the sixth graders and do the same for the seventh graders. If the mean times are fairly close together and the spreads not that different, there is not really evidence to say one group of students has better balance.
Eureka Math Grade 7 Module 5 Lesson 16 Problem Set Answer Key
Question 1.
The suggestions below for how to choose a random sample of students at your school were made and vetoed. Explain why you think each was vetoed.
a. Use every fifth person you see in the hallway before class starts.
Answer:
Students who are not in the hallway because they have a class in another part of the building would not have a chance to be selected, so the sample would not be a random sample.
b. Use all of the students taking math the same time that your class meets.
Answer:
The students not taking math at that time would not have a chance of being selected, so the sample would not be a random sample.
c. Have students who come to school early do the activity before school starts.
Answer:
The sample would be not be a random sample because some students would not be able to get to school early, so they could not be selected.
d. Have everyone in the class find two friends to be in the sample.
Answer:
Choosing people that members of the class know would not be a random sample because people that members of the class do not know have no chance to be chosen.
Question 2.
A teacher decided to collect homework from a random sample of her students rather than grading every paper every day.
a. Describe how she might choose a random sample of five students from her class of 35 students.
Answer:
Sample response: You could assign each student a number from 1 to 35, generate five random numbers from 1 to 35, and choose the corresponding students.
b. Suppose every day for 75 days throughout an entire semester she chooses a random sample of five students. Do you think some students will never get selected? Why or why not?
Answer:
Sample response: Over that many days, it should almost even out. If you think about 375 numbers generated all together with each number from 1 to 35 having an equal chance of showing up each time, then each number should be in the overall set about 10 or 11 times. I generated 75 random samples of numbers from 1 to 35 and looked at how the numbers showed up. Every number from 1 to 35 showed up at least three times, and most of the numbers showed up about 10 or 11 times.
Question 3.
Think back to earlier lessons in which you chose a random sample. Describe how you could have used a random number generator to select a random sample in each case.
a. A random sample of the words in the poem “Casey at the Bat”
Answer:
Sample response: You could have generated the random numbers from 1 to 26 for the block of words and the random numbers 1 to 20 to choose a word in the block. Or you could number all of the words from 1 to 520 and then generate random numbers between 1 and 520 to choose the words.
b. A random sample of the grocery prices on a weekly flyer
Answer:
Sample response: Instead of cutting out all of the prices and putting them in a bag, you could just number them on the flyer and use the random number generator to select numbers to identify the items in the sample and use the price of those items.
Question 4.
Sofia decided to use a different plan for selecting a random sample of books from the population of 150 top-selling children’s books from Example 2. She generated ten random numbers between 1 and 100,000 to stand for the possible number of pages in any of the books. Then, she found the books that had the number of pages specified in the sample. What would you say to Sofia?
Answer:
Sample response: She would have to reject the numbers in the sample that referred to pages that were not in her list of 150 books. For example, if she gets the random numbers 4 or 720, she would have to generate new numbers because no books on the list had either 4 or 720 pages. She would have to throw out a lot of random numbers that did not match the number of pages in the books in the list.
It would take her a long time. But if there were no two books that had the same total number of words in the population, it would be a random sample if she wanted to do it that way. However, because there are quite a few books that have the same number of words as other books in the population, this method would not work for selecting a random sample of the books.
Question 5.
Find an example from a newspaper, a magazine, or another source that used a sample. Describe the population, the sample, the sample statistic, how you think the sample might have been chosen, and whether or not you think the sample was random.
Answer:
Responses will vary depending on the articles students find. For example, “an estimated 60% of the eligible children in Wisconsin did not attend preschool in 2009.” The population would be all of the children in Wisconsin eligible for preschool in 2009, and the sample would be the ones selected by the study. The sample statistic would be 60%. The article did not tell how the sample was chosen but said the source was from the Census Bureau, so it was probably a random sample.
Eureka Math Grade 7 Module 5 Lesson 16 Exit Ticket Answer Key
Question 1.
Name two things to consider when you are planning how to select a random sample.
Answer:
Answers will vary.
- What it means to be a random sample—that everyone in the population has the same chance to be selected.
- Is there a way to use a random number generator to make it easier to select the sample?
Question 2.
Consider a population consisting of the 200 seventh graders at a particular middle school. Describe how you might select a random sample of 20 students from a list of the students in this population.
Answer:
Answers will vary. Number the students on the list from 001 to 200. Using a random number generator, get 20 different random numbers between 001 and 200, and then select the students corresponding to those numbers on the list. It would also be correct for a student to say that she would write the 200 names on slips of paper, put them in a bag, mix them well, and then select 20 names from the bag.