Engage NY Eureka Math 8th Grade Module 4 Lesson 22 Answer Key
Eureka Math Grade 8 Module 4 Lesson 22 Exercise Answer Key
Exercises
Exercise 1.
Peter paints a wall at a constant rate of 2 square feet per minute. Assume he paints an area y, in square feet, after x minutes.
a. Express this situation as a linear equation in two variables.
Answer:
\(\frac{y}{x}\) = \(\frac{2}{1}\)
y = 2x
b. Sketch the graph of the linear equation.
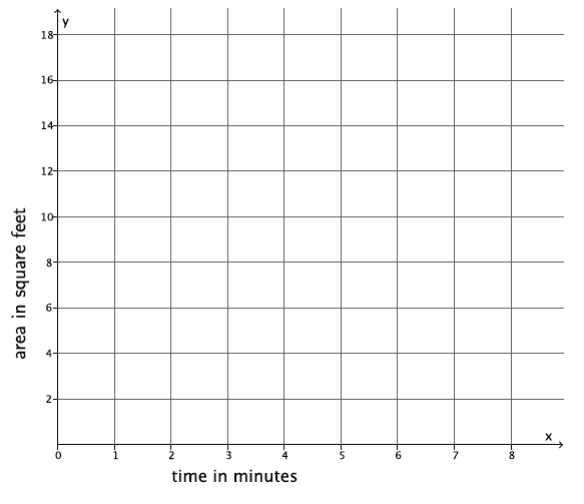
Answer:
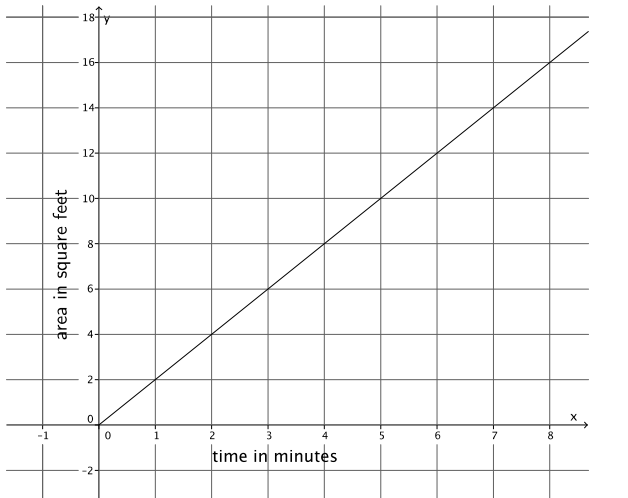
c. Using the graph or the equation, determine the total area he paints after 8 minutes, 1 \(\frac{1}{2}\) hours, and 2 hours. Note that the units are in minutes and hours.
Answer:
In 8 minutes, he paints 16 square feet.
y = 2(90)
= 180
In 1 \(\frac{1}{2}\) hours, he paints 180 square feet.
y = 2(120)
= 240
In 2 hours, he paints 240 square feet.
Exercise 2.
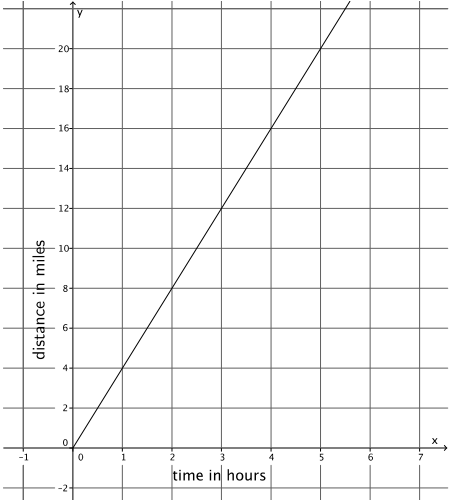
The figure below represents Nathan’s constant rate of walking.
a. Nicole just finished a 5-mile walkathon. It took her 1.4 hours. Assume she walks at a constant rate. Let y represent the distance Nicole walks in x hours. Describe Nicole’s walking at a constant rate as a linear equation in two variables.
Answer:
\(\frac{y}{x}\) = \(\frac{5}{1.4}\)
y = \(\frac{25}{7}\) x
b. Who walks at a greater speed? Explain.
Answer:
Nathan walks at a greater speed. The slope of the graph for Nathan is 4, and the slope or rate for Nicole is \(\frac{25}{7}\). When you compare the slopes, you see that 4 > \(\frac{25}{7}\).
Exercise 3.
a. Susan can type 4 pages of text in 10 minutes. Assuming she types at a constant rate, write the linear equation that represents the situation.
Answer:
Let y represent the total number of pages Susan can type in x minutes. We can write \(\frac{y}{x}\) = \(\frac{4}{10}\) and y = \(\frac{2}{5}\) x.
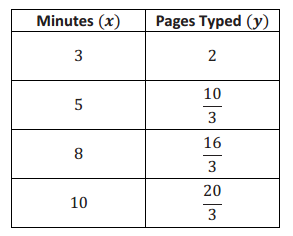
b. The table of values below represents the number of pages that Anne can type, y, in a few selected x minutes. Assume she types at a constant rate.
Answer:
Anne types faster. Using the table, we can determine that the slope that represents Anne’s constant rate of typing is \(\frac{2}{3}\). The slope or rate for Nicole is \(\frac{2}{5}\). When you compare the slopes, you see that \(\frac{2}{3}\) > \(\frac{2}{5}\).
Exercise 4.
a. Phil can build 3 birdhouses in 5 days. Assuming he builds birdhouses at a constant rate, write the linear equation that represents the situation.
Answer:
Let y represent the total number of birdhouses Phil can build in x days. We can write \(\frac{y}{x}\) = \(\frac{3}{5}\) and y = \(\frac{3}{5}\) x.
b. The figure represents Karl’s constant rate of building the same kind of birdhouses.
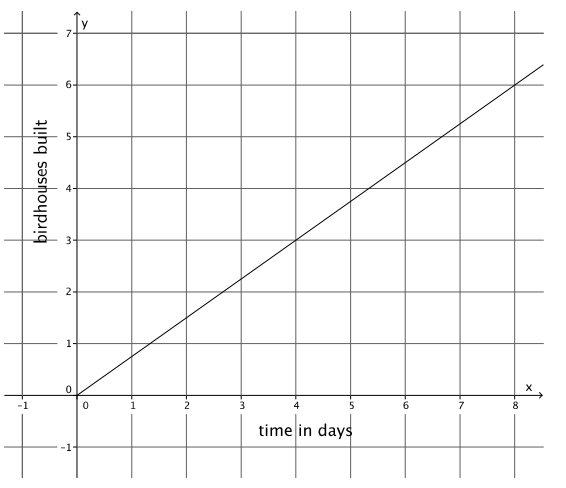
Who builds birdhouses faster? Explain.
Answer:
Karl can build birdhouses faster. The slope of the graph for Karl is \(\frac{3}{4}\), and the slope or rate of change for Phil is \(\frac{3}{5}\). When you compare the slopes, \(\frac{3}{4}\) > \(\frac{3}{5}\).
Exercise 5.
Explain your general strategy for comparing proportional relationships.
Answer:
When comparing proportional relationships, we look specifically at the rate of change for each situation. The relationship with the greater rate of change will end up producing more, painting a greater area, or walking faster when compared to the same amount of time with the other proportional relationship.
Eureka Math Grade 8 Module 4 Lesson 22 Problem Set Answer Key
Question 1.
a. Train A can travel a distance of 500 miles in 8 hours. Assuming the train travels at a constant rate, write the linear equation that represents the situation.
Answer:
Let y represent the total number of miles Train A travels in x minutes. We can write \(\frac{y}{x}\) = \(\frac{500}{8}\) and y = \(\frac{125}{2}\) x.
b. The figure represents the constant rate of travel for Train B.
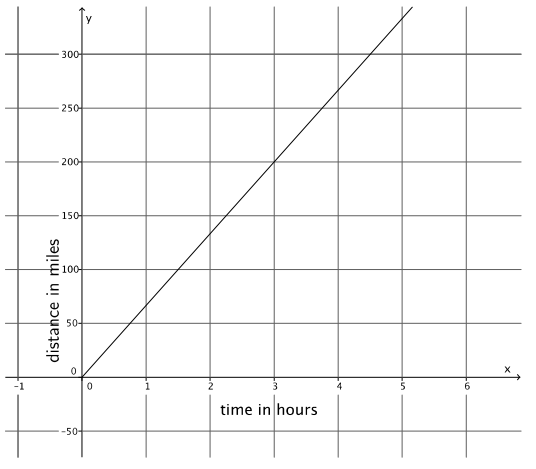
Which train is faster? Explain.
Answer:
Train B is faster than Train A. The slope or rate for Train A is \(\frac{125}{2}\), and the slope of the line for Train B is \(\frac{200}{3}\). When you compare the slopes, you see that \(\frac{200}{3}\) > \(\frac{125}{2}\).
Question 2.
a. Natalie can paint 40 square feet in 9 minutes. Assuming she paints at a constant rate, write the linear equation that represents the situation.
Answer:
Let y represent the total square feet Natalie can paint in x minutes. We can write \(\frac{y}{x}\) = \(\frac{40}{9}\), and y = \(\frac{40}{9}\) x.
b. The table of values below represents the area painted by Steven for a few selected time intervals. Assume Steven is painting at a constant rate.
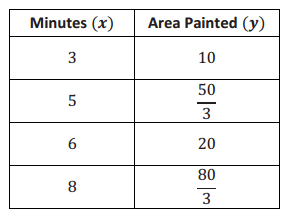
Answer:
Who paints faster? Explain.
Natalie paints faster. Using the table of values, I can find the slope that represents Steven’s constant rate of painting: \(\frac{10}{3}\). The slope or rate for Natalie is \(\frac{40}{9}\). When you compare the slopes, you see that \(\frac{40}{9}\) > \(\frac{10}{3}\).
Question 3.
a. Bianca can run 5 miles in 41 minutes. Assuming she runs at a constant rate, write the linear equation that represents the situation.
Answer:
Let y represent the total number of miles Bianca can run in x minutes. We can write \(\frac{y}{x}\) = \(\frac{5}{41}\), and y = \(\frac{5}{41}\) x.
b. The figure below represents Cynthia’s constant rate of running.
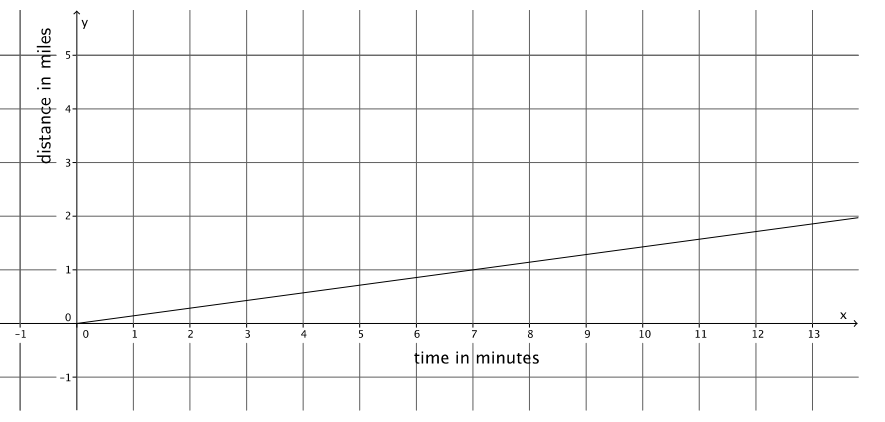
Who runs faster? Explain.
Answer:
Cynthia runs faster. The slope of the graph for Cynthia is \(\frac{1}{7}\), and the slope or rate for Nicole is \(\frac{5}{41}\). When you compare the slopes, you see that \(\frac{1}{7}\) > \(\frac{5}{41}\).
Question 4.
a. Geoff can mow an entire lawn of 450 square feet in 30 minutes. Assuming he mows at a constant rate, write the linear equation that represents the situation.
Answer:
Let y represent the total number of square feet Geoff can mow in x minutes. We can write \(\frac{y}{x}\) = \(\frac{450}{30}\), and y = 15x.
b. The figure represents Mark’s constant rate of mowing a lawn.
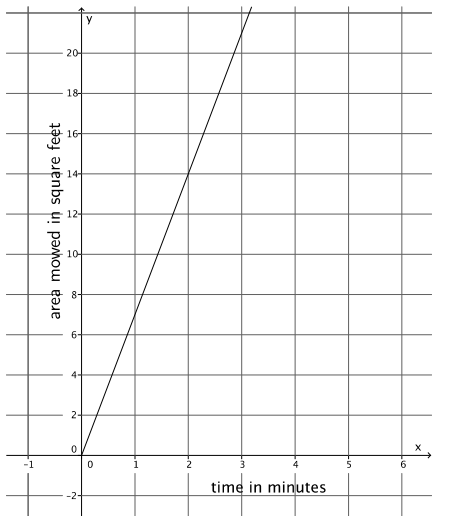
Who mows faster? Explain.
Answer:
Geoff mows faster. The slope of the graph for Mark is \(\frac{14}{2}\) = 7, and the slope or rate for Geoff is \(\frac{450}{30}\) = 15. When you compare the slopes, you see that 15 > 7.
Question 5.
a. Juan can walk to school, a distance of 0.75 mile, in 8 minutes. Assuming he walks at a constant rate, write the linear equation that represents the situation.
Answer:
Let y represent the total distance in miles that Juan can walk in x minutes. We can write \(\frac{y}{x}\) = \(\frac{0.75}{8}\), and y = \(\frac{3}{32}\) x.
b. The figure below represents Lena’s constant rate of walking.
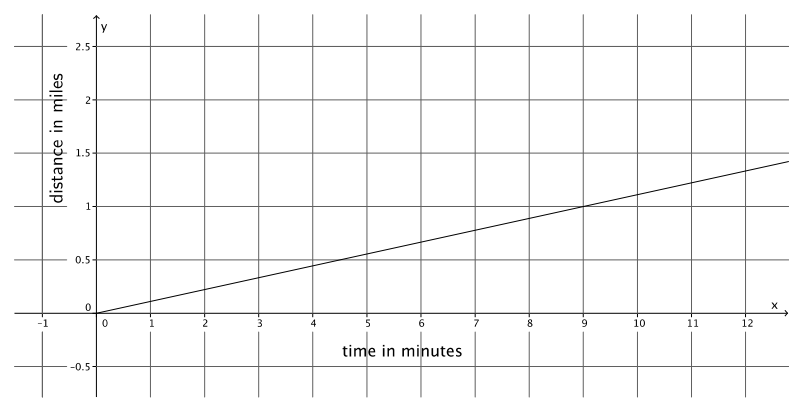
Who walks faster? Explain.
Answer:
Lena walks faster. The slope of the graph for Lena is \(\frac{1}{9}\), and the slope of the equation for Juan is \(\frac{0.75}{8}\), or \(\frac{3}{32}\). When you compare the slopes, you see that \(\frac{1}{9}\) > \(\frac{3}{32}\).
Eureka Math Grade 8 Module 4 Lesson 22 Exit Ticket Answer Key
Question 1.
Water flows out of Pipe A at a constant rate. Pipe A can fill 3 buckets of the same size in 14 minutes. Write a linear equation that represents the situation.
Answer:
Let y represent the total number of buckets that Pipe A can fill in x minutes. We can write \(\frac{y}{x}\) = \(\frac{3}{14}\) and y = \(\frac{3}{14}\) x.
Question 2.
The figure below represents the rate at which Pipe B can fill the same-sized buckets.
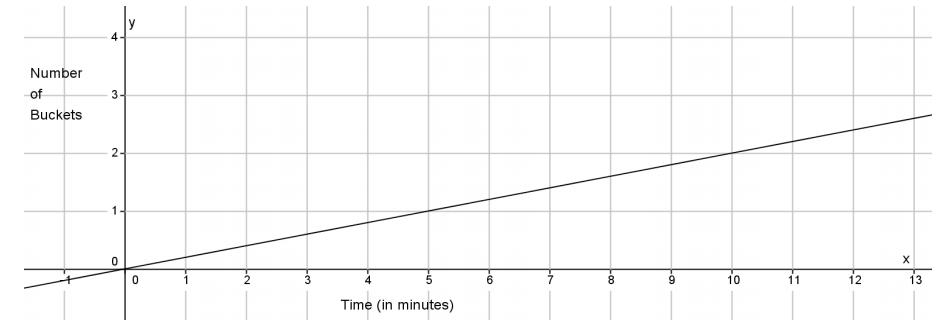
Which pipe fills buckets faster? Explain.
Answer:
Pipe A fills the same-sized buckets faster than Pipe B. The slope of the graph for Pipe B is \(\frac{1}{5}\), and the slope or rate for Pipe A is \(\frac{3}{14}\). When you compare the slopes, you see that \(\frac{3}{14}\) > \(\frac{1}{5}\).