Estimating Products | How to Estimate Products by Rounding? | Estimation in Multiplication Examples

Estimating Products

Products of numbers can be found by multiplying one number with other numbers. Estimating products can be found by rounding numbers to the nearest ten, hundred, thousand, etc., The multiplication will give you the exact value of the product of two numbers. Estimating products will give you the approximate value of the product of two numbers. Let us get into deep to learn Estimating Products. Estimation of products is happened by rounding the given factors to the required place value. You can get the near value of the product of numbers with an estimation of products.

Do Check: Estimating the Quotient

How to Round the Factors to Estimate Products?

Follow the below steps to find out any given numbers of products using Estimation of products.

1. Firstly, take the given numbers.
2. Round off the multiplier and the multiplicand to the nearest tens, hundreds, or thousands.
3. In the last step, multiply the rounded numbers and get the output.

Estimating Products Examples

Example 1.

Estimate the products of 33 and 87.

Solution:
Given numbers are 33 and 87.
Round off the given numbers to the nearest tens, hundreds, or thousands.
33 – 33 is in between 30 and 40. But the 33 is near to 30 compared to 40. Therefore, 33 is rounded down to 30.
87 – 87 is in between 80 and 90. But the 87 is near to 90 compared to 80. Therefore, 87 is rounded up to 90.
Multiply 30 and 90.
30 × 90 = 2700.

Therefore, the estimated product is 2700.

Example 2.

Estimate the products of 332 and 268 by rounding to the nearest hundred.

Solution:
Given numbers are 332 and 268.
Round off the given numbers to the nearest tens, hundreds, or thousands.
332 – 332 is in between 300 and 400. But the 332 is near to 300 compared to 400. Therefore, 332 is rounded down to 300.
268 – 268 is in between 200 and 300. But the 268 is near to 300 compared to 200. Therefore, 268 is rounded up to 300.
Multiply 300 and 300.
300 × 300 = 90,000.

Therefore, the estimated product is 90,000.

Example 3.

Estimate the products of 41 and 72.

Solution:
Given numbers are 41 and 72.
Round off the given numbers to the nearest tens, hundreds, or thousands.
41 – 41 is in between 40 and 50. But the 41 is near to 40 compared to 50. Therefore, 41 is rounded down to 40.
72 – 72 is in between 70 and 80. But the 72 is near to 70 compared to 80. Therefore, 72 is rounded down to 70.
Multiply 40 and 70.
40 × 70 = 2800.

Therefore, the estimated product is 2800.

Example 4.

Estimate the products of 221 and 157 by rounding to the nearest hundred.

Solution:
Given numbers are 221 and 157.
Round off the given numbers to the nearest tens, hundreds, or thousands.
221 – 221 is in between 200 and 300. But the 221 is near to 200 compared to 300. Therefore, 221 is rounded down to 200.
157 – 157 is in between 100 and 200. But the 157 is near to 100 compared to 200. Therefore, 157 is rounded down to 100.
Multiply 200 and 100.
200 × 100 = 20,000.

Therefore, the estimated product is 20,000.

Estimating Products Problems with Answers

Problem 1.

Estimate the product: 41 × 58

Solution:
Given numbers are 41 and 58.
Round off the given numbers to the nearest tens, hundreds, or thousands.
41 – 41 is in between 40 and 50. But the 41 is near to 40 compared to 50. Therefore, 41 is rounded down to 40.
58 – 58 is in between 50 and 60. But the 58 is near to 50 compared to 60. Therefore, 58 is rounded up to 60.
Multiply 40 and 60.
40 × 60 = 2400.

Therefore, the estimated product is 2400.

Problem 2.

Estimate the product: 48 × 83

Solution:
Given numbers are 48 and 83.
Round off the given numbers to the nearest tens, hundreds, or thousands.
48 – 48 is in between 40 and 50. But the 48 is near to 50 compared to 40. Therefore, 48 is rounded up to 50.
83 – 83 is in between 80 and 90. But the 83 is near to 80 compared to 90. Therefore, 83 is rounded down to 80.
Multiply 50 and 80.
50 × 80 = 4000.

Therefore, the estimated product is 4000.

Problem 3.

Estimate the product: 73 × 86

Solution:
Given numbers are 73 and 86.
Round off the given numbers to the nearest tens, hundreds, or thousands.
73 – 73 is in between 70 and 80. But the 73 is near to 70 compared to 80. Therefore, 73 is rounded down to 70.
86 – 86 is in between 80 and 90. But the 86 is near to 90 compared to 80. Therefore, 86 is rounded up to 90.
Multiply 70 and 90.
70 × 90 = 6300.

Therefore, the estimated product is 6300.

Problem 4.

Estimate the product: 357 × 327 by rounding to the nearest hundred.

Solution:
Given numbers are 357 and 327.
Round off the given numbers to the nearest tens, hundreds, or thousands.
357 – 357 is in between 300 and 400. But the 357 is near to 400 compared to 300. Therefore, 357 is rounded up to 400.
327 – 327 is in between 300 and 400. But the 327 is near to 300 compared to 400. Therefore, 327 is rounded down to 300.
Multiply 400 and 300.
400 × 300 = 120,000.

Therefore, the estimated product is 120,000.

Problem 5.

Estimate the following product by rounding numbers to the nearest
(i) Hundred
(ii) Ten ‘342 × 268

Solution:
(i) The given numbers are 342 and 268.
Round off the given numbers to the nearest hundreds.
342 – 342 is in between 300 and 400. But the 342 is near to 300 compared to 400. Therefore, 342 is rounded down to 300.
268 – 268 is in between 200 and 300. But the 268 is near to 300 compared to 200. Therefore, 268 is rounded up to 300.
Multiply 300 and 300.
300 × 300 = 90,000.
Therefore, the estimated product is 90,000.
(i) The given numbers are 342 and 268.
Round off the given numbers to the nearest tens.
342 – 342 is in between 340 and 350. But the 342 is near to 340 compared to 350. Therefore, 342 is rounded down to 340.
268 – 268 is in between 260 and 270. But the 268 is near to 270 compared to 260. Therefore, 268 is rounded up to 270.
Multiply 340 and 270.
340 × 270 = 91,800.
Therefore, the estimated product is 91,800.

Estimation in Multiplication Problems

Example 1.

Estimate the following product by rounding numbers to the nearest Hundred
(a) 148 and 156
(b) 215 and 394
(c) 387 and 412
(d) 411 and 513
(e) 558 and 677
(f) 697 and 702
(g) 777 and 887
(h) 825 and 930

Solution:
(a) Given numbers are 148 and 156.
Round off the given numbers to the nearest hundreds.
148 – 148 is in between 100 and 200. But the 148 is near to 100 compared to 200. Therefore, 148 is rounded down to 100.
156 – 156 is in between 100 and 200. But the 156 is near to 200 compared to 100. Therefore, 156 is rounded up to 200.
Multiply 100 and 200.
100 × 200 = 20,000.

Therefore, the estimated product is 20,000.

(b) Given numbers are 215 and 394.
Round off the given numbers to the nearest hundreds.
215 – 215 is in between 200 and 300. But the 215 is near to 200 compared to 300. Therefore, 215 is rounded down to 200.
394 – 394 is in between 300 and 400. But the 394 is near to 400 compared to 300. Therefore, 394 is rounded up to 400.
Multiply 200 and 400.
200 × 400 = 80,000.

Therefore, the estimated product is 80,000.

(c) Given numbers are 387 and 412.
Round off the given numbers to the nearest hundreds.
387 – 387 is in between 300 and 400. But the 387 is near to 400 compared to 300. Therefore, 387 is rounded up to 400.
412 – 412 is in between 400 and 500. But the 412 is near to 400 compared to 500. Therefore, 412 is rounded down to 400.
Multiply 400 and 400.
400 × 400 = 160,000.

Therefore, the estimated product is 160,000.

(d) Given numbers are 411 and 513.
Round off the given numbers to the nearest hundreds.
411 – 411 is in between 400 and 500. But the 411 is near to 400 compared to 500. Therefore, 411 is rounded down to 400.
513 – 513 is in between 500 and 600. But the 513 is near to 500 compared to 600. Therefore, 513 is rounded down to 500.
Multiply 400 and 500.
400 × 500 = 200,000.

Therefore, the estimated product is 200,000.

(e) Given numbers are 558 and 677.
Round off the given numbers to the nearest hundreds.
558 – 558 is in between 500 and 600. But the 558 is near to 600 compared to 500. Therefore, 558 is rounded up to 600.
677 – 677 is in between 600 and 700. But the 677 is near to 700 compared to 600. Therefore, 677 is rounded up to 700.
Multiply 600 and 700.
600 × 700 = 420,000.

Therefore, the estimated product is 420,000.

(f) Given numbers are 697 and 702.
Round off the given numbers to the nearest hundreds.
697 – 697 is in between 600 and 700. But the 697 is near to 700 compared to 600. Therefore, 697 is rounded up to 700.
702 – 702 is in between 700 and 800. But the 702 is near to 700 compared to 800. Therefore, 702 is rounded down to 700.
Multiply 700 and 700.
700 × 700 = 490,000.

Therefore, the estimated product is 490,000.

(g) Given numbers are 777 and 887.
Round off the given numbers to the nearest hundreds.
777 – 777 is in between 700 and 800. But the 777 is near to 800 compared to 700. Therefore, 777 is rounded up to 800.
887 – 887 is in between 800 and 900. But the 887 is near to 900 compared to 700. Therefore, 887 is rounded up to 900.
Multiply 800 and 900.
800 × 900 = 720,000.

Therefore, the estimated product is 720,000.

(h) Given numbers are 825 and 930.
Round off the given numbers to the nearest hundreds.
825 – 825 is in between 800 and 900. But the 825 is near to 800 compared to 900. Therefore, 825 is rounded down to 800.
930 – 930 is in between 900 and 1000. But the 930 is near to 900 compared to 1000. Therefore, 930 is rounded down to 900.
Multiply 800 and 900.
800 × 900 = 720,000.

Therefore, the estimated product is 720,000.

Example 2.

Choose the best estimate and tick the right answer.

I. A shopkeeper has 91 packets of chocolates. If each packet has 38 chocolates, then how many chocolates are there in the shop.
(i) 3600 (ii) 4000

Solution:
Given numbers are 91 and 38.
Round off the given numbers to the nearest tens, hundreds, or thousands.
91 – 91 is in between 90 and 100. But the 91 is near to 90 compared to 100. Therefore, 91 is rounded down to 90.
38 – 38 is in between 30 and 40. But the 38 is near to 40 compared to 30. Therefore, 38 is rounded up to 40.
Multiply 90 and 40.
90 × 40 = 3600.
Therefore, the estimated product is 3600.

The answer (i) 3600 is correct.

II. A museum has 218 marble jars. Each jar has 179 marbles. What is the total number of marbles in the museum?
(i) 40000 (ii) 50000

Solution:
Given numbers are 218 and 179.
Round off the given numbers to the nearest tens, hundreds, or thousands.
218 – 218 is in between 200 and 300. But the 218 is near to 200 compared to 300. Therefore, 218 is rounded down to 200.
179 – 179 is in between 100 and 200. But the 179 is near to 200 compared to 100. Therefore, 179 is rounded up to 200.
Multiply 200 and 200.
200 × 200 = 40,000.
Therefore, the estimated product is 40,000.

The answer (i) 40000 is correct.

III. There are 77 houses in a locality. Each house uses 279 units of electricity each day. How many units of electricity is used each day in the locality?
(i) 24000 (ii) 30000

Solution:
Given numbers are 77 and 279.
Round off the given numbers to the nearest tens, hundreds, or thousands.
77 – 77 is in between 70 and 80. But the 77 is near to 80 compared to 70. Therefore, 77 is rounded up to 80.
279 – 279 is in between 200 and 300. But the 279 is near to 300 compared to 200. Therefore, 279 is rounded up to 300.
Multiply 200 and 200.
80 × 300 = 24,000.
Therefore, the estimated product is 24,000.

The answer (i) 24000 is correct.

IV. A hotel has 19 water tanks and each tank has the capacity of 4088 liters of water. What is the total quantity of water that can be stored by the hotel?
(i) 80000 (ii) 16000

Solution:
Given numbers are 19 and 4088.
Round off the given numbers to the nearest tens, hundreds, or thousands.
19 – 19 is in between 10 and 20. But the 19 is near to 20 compared to 10. Therefore, 19 is rounded up to 20.
4088 – 4088 is in between 4000 and 5000. But the 4088 is near to 4000 compared to 5000. Therefore, 4088 is rounded down to 4000.
Multiply 20 and 4000.
20 × 4000 = 80,000.
Therefore, the estimated product is 80,000.

The answer (i) 80000 is correct.

Find the Area of the Shaded Region – Simple and Easy Method

Find the Area of Shaded Region

The area of the shaded region is the difference between two geometrical shapes which are combined together. By subtracting the area of the smaller geometrical shape from the area of the larger geometrical shape, we will get the area of the shaded region. Or subtract the area of the unshaded region from the area of the entire region that is also called an area of the shaded region.

Area of the shaded region = Area of the large geometrical shape (entire region) – area of the small geometrical shape (shaded region).

Do Refer:

How to Find the Area of a Shaded Region?

Follow the below steps and know the process to find out the Area of the Shaded Region. We have given clear details along with the solved examples below.

  • Firstly, find out the area of the large geometrical shape or outer region.
  • Then, find the area of the small geometrical shape or inner region of the image.
  • Finally, subtract an area of the small geometrical shape (entire region) from the large area of the small geometrical shape (shaded region).
  • The resultant value is considered as the area of the shaded region.

Area of the Shaded Region Examples

Problem 1.

A regular hexagon is inscribed in a circle with a radius of 21cm. Find out the area of the shaded region?

Regular Hexagon Inscribed in a Circle Shaded Region

Solution:
As per the given information,
Hexagon is inscribed in a circle.
Radius of the circle = 21cm.
Area of the circle = A=πr².
Substituting the radius (r) value in the above equation, we will get
A = π(21)².
A = 22 / 7(21 * 21).
A = 22(3*21).
A = 1386.
Area of the circle (A) = 1386 cm².
Area of the hexagon = 3√3/ 2 r².
Substitute the radius value in the above equation, we will get
A = 3√3/ 2 (21)².
A = 3√3/ 2 (441).
A = 1145.75
The area of the hexagon is equal to 1145 cm².
Area of the shaded region = Area of the large geometrical shape – Area of the small geometrical shape.
Area of the shaded region = 1386 – 1145 = 241 cm².
Therefore, the area of the shaded region is equal to 241 cm².

Problem 2.

The square is inscribed in a rectangle. The side of the square is 2cm. The length and breadth of the rectangle is 4cm and 5cm. Find out the area of the shaded region?

Shadded Region for a Square Inscribed in a Rectangle

Solution:

As per the given details,
The Square is inscribed in a rectangle.
Side of the square a = 2cm.
Length of the rectangle (l) = 4cm and breadth of the rectangle (b) =5cm.
Area of the square (A) = a²
Substitute the ‘a’ value in the above equation, we will get
Area of the square (A) = (2)² = 4cm².
Area of the rectangle (A) = l * b
Substitute the length and breadth values in the above equation, we will get
Area of the rectangle (A) = 4cm * 5cm = 20 cm².
Area of the shaded region = Area of the large geometrical shape – area of the small geometrical shape.
Area of the shaded region = 20 – 4 = 16 cm².

Therefore, the Area of the shaded region is equal to 16cm².

Problem 3.

A Triangle is inscribed in a Square. The side of the square is 20cm and the radius of the triangle is 7cm. Calculate the area of the shaded region?

Shaded Region for a Triangle Inscribed in a Square

Solution:

As per the given information,
A triangle is inscribed in a square.
Side of the square (a) = 20cm.
Radius of the triangle (r) = 7cm.
Area of the square (A) = a².
Substitute the ‘a’ value in the above equation, we will get
Area of the square (A) = (20)² = 400cm².
Area of the triangle (A)=πr².
Substitute the radius value in the above equation. Then we will get,
A = 22 / 7 (7)².
A = 22 * 7 =154.
The area of the triangle is equal to 154 cm².
Area of the shaded region = Area of the large geometrical shape – area of the small geometrical shape.
Area of the shaded region = 400 – 154 = 246 cm².

Therefore, the Area of the shaded region is equal to 246 cm².

Problem 4.

A semi-circle is inscribed in a square with a radius of 14cm. The side of the square is 25cm. Calculate the area of the shaded region?

Semi Circle inscribed in a Square Shaded Region

Solution:

As per the given details,
A semi-circle is inscribed in a square.
Radius of the semi-circle (r) = 14cm.
Side of the square (a) = 25cm.
Area of the square (A) = a².
Substitute the ‘a’ value in the above equation, we will get
Area of the square (A) = (25)² = 625 cm².
Area of the Semi – circle (A) = πr² / 2.
Substitute the radius of the semi-circle in the above equation, we will get
A = 22 / 7 (14)² / 2.
A = 22 / 7 (14 * 14) / 2.
A = 22 (2 * 14) / 2.
A = 22 * 14 = 308.
The area of the semi-circle is equal to 308 cm².
Area of the shaded region = Area of the large geometrical shape – Area of the small geometrical shape.
Area of the shaded region = 625 – 308 = 317 cm².

So, the Area of the shaded region is equal to 317 cm².

FAQs on finding the Area of a Shaded Region

1. What is the Area of the Shaded Region?

It is the difference between the area of the outer region and the inner region.

2. How to find the Area of the Shaded Region?

There are three steps to find the area of the shaded region. They are
i. Calculate the area of the outer region.
ii. Calculate the area of the inner region.
iii. Subtract the area of the inner region from the outer region.

3. What is the Formula for the Area of the Shaded Region?

The formula for the area of the shaded region is
Area of the shaded region = Area of the large geometrical shape (entire region) – area of the small geometrical shape (shaded region).

Simple Closed Curves – Definition, Types, Facts, Examples

Simple Closed Curves

The images or shapes that are closed by the line or line-segment are called simple closed curves. A Closed curve’s starting point and ending points are the same and a closed curve doesn’t cross its path. Triangle, quadrilateral, circle, pentagon, …etc. are an example of the simple closed curves.

Simple closed curves are
simple closed curves. image 1

Generally, curves are generated with the line only. By using the line or line segments only, we can draw the number of curves.

Types of Curves

Different types of curves are there. They are
1. Simple Open Curves
2. Closed curves
3. Non – Simple Curve
4. Upward curve
5. Downward curve

1. Simple Open Curves

Simple open curves are created with the line-segment but there is no intersection itself. That means, there is no joining point between the starting point and ending point.

simple closed curves. image 2

2. Closed Curves

Closed curves are opposite to open curves. In closed curves, line intersection will be done. That means the starting and ending points are joined at the same point.

simple closed curves. image 3

Also, See:

3. Non-Simple Curves

A Non-simple curve is a little bit typical compared to simple curves and it crosses its path while joining the ending point of the curve with the starting point. Again non-simple curves are divided into two types. They are
1. Non-simple closed curves
2. Non-simple open curves

simple closed curves. image 4

4. Upward Curve

Every curve is designed with a starting point and ending point. Where the two points starting and ending points are located in the upward direction is called as ‘Upward Curve’.

simple closed curves. image 5

5.Downward Curve

The Downward curve is opposite to the Upward curve. The two points of the curve, starting and ending points are located in the downward direction are called as ‘Downward Curve’.

simple closed curves. image 6

Simple Closed Curves Examples

Find which of the following are simple closed curves?

simple closed curves. image 7

From the above diagram, we have four images.
Closed curves intersect themselves and there is no intersection point in open curves. In the above diagram, Figure a and d are closed curves.

Real Life Statistics – Definition, Types, Advantages, Applications, Examples

Real Life Statistics

Statistics is more important because nowadays we live in the information world and much of this information is determined mathematically by statistics. It helps to use the proper methods to collect the data, employ the correct analyses, and effectively present the results. Basically, statistics is a mathematical discipline to collect data and summarize the data. The study of statistics is the collection, analysis, interpretation, presentation, and organization of data. Check out Statistics Definition, Types, Advantages, Applications, and Examples in the later sections.

Statistics Definition

The main purpose of statistics is to plan the collected data in terms of the experimental designs and statistical surveys. The study of the collection, analysis, interpretation, presentation, and organization of data is called statistics. It will be collecting the data and summarizing the data. If it is studying the population of the country or its economy statistics are used for all such data analysis. Statistics has many applications from small scale to large scale.

Statistics basics including the measure of central tendency and the measure of dispersion. Mean, Median and Mode are central tendencies whereas dispersion comprises variance and standard deviation. Statistics used in many sectors such as psychology, geology, sociology, weather forecasting, probability, and much more. The scope of statistics helps in economic planning, business management, administrations, and research.

Characteristics of Statistics

  • Statistics are aggregate facts.
  • Statistics are numerically expressed.
  • Statistics are collected in a systematic manner.
  • Statistics for a predefined purpose.
  • Statistics are enumerated or estimated according to reasonable standards of Accuracy.
  • Statistics are capable of being placed in relation to each other.

Types of Statistics

Statistics are of two types

  1. Descriptive Statistics
  2. Inferential Statistics

Descriptive Statistics: It provides the tool to define our data in a most understandable and appropriate way, the collection of data is described in summary. Descriptive statistics are used on a large scale.

Inferential Statistics: It is about using the data from the sample and then making inferences about the larger population from which the sample is drawn. Inferential statistics are used to explain the descriptive one, it will also be used on a large scale.

Descriptive statistics are transitioned into inferential statistics, it is one more type of statistics.

Representation of Statistics Data

Bar charts, histograms, pie charts, and box plots (box and whiskers plots). Two common types of graphic displays are bar charts and histograms. Both bar charts and histograms use vertical or horizontal bars to represent the number of data points in each category or interval.

Some of the methods involve collecting, summarizing, analyzing, interpreting variables of numerical data. The methods are provided below for representing statistics data.

  • Data Collection
  • Data Summarization
  • Statistical Analysis

In this, the data is a collection of facts, such as numbers, words, measurements, observations, etc. Data are two types is Qualitative data and the second one is Quantitative data. Descriptive data is called Qualitative data whereas Numerical data is Quantitative data, again it has two types.

  1. Discrete data
  2. Continuous data.

Discrete data is in form of digital that means zero’s and ones, it has a particular fixed value. so, discrete data can be counted whereas continuous data is not counted because it won’t have a particular fixed value but continuous data has a range of data, so it can be measured.

The representation of statistics data as follow :

Pie Chart: Pie charts are used in data handling and are circular charts divided up into segments that each represent a value. Pie charts are divided into sections or slices to represent a value of different sizes. The pie chart has different parts are Title, Legend, Source, and data. The title offers a short explanation of what is in your graph and legend tells what each slice represents, source explains where you found the information that is in your graph.

Pie Chart

Bar Graph: A bar graph is a chart that plots data using rectangular bars or columns called bins, that represents the total amount of observations in the data for that category. Bar graphs are commonly used in financial analysis for displaying data. In other words, Bar graphs are used to compare things between different groups or to track changes over time.

Bar Graphs are three types :

  1. Horizontal Bar Graphs
  2. Vertical Bar Graphs
  3. Line Graph

Bar Graphs have different parts such as Title, Source, X-Axis, Y-Axis, Data, and Legend.

Line Graph: Line graphs or line charts are used to track variations over time, which may be long-term or short-term. We can also use line graphs to compare changes over the same period for more than one group. There are 3 main types of line graphs in statistics namely, a simple line graph, multiple line graph, and a compound line graph. Each of these graph types has different uses depending on the kind of data that is being evaluated.


Line Graph Data RepresentationPictogram:  A Pictogram is one of the simplest and most popular forms of data visualization out there. Also known as “pictographs”, “icon charts”, “picture charts”, and “pictorial unit charts”, pictograms use a series of repeated icons to visualize simple data.

Pictograms 
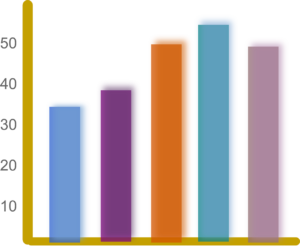
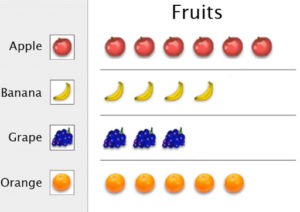
Histogram: A histogram is a display that indicates the frequency of specified ranges of continuous data values on a graph in the form of immediately adjacent bars. Interval is a range of data in a data set. The different types of a histogram are uniform histogram, symmetric histogram, bimodal histogram, probability histogram.


Histogram

Frequency Distribution: Frequency distribution in statistics is a graph or data set organized to show the frequency of occurrence of each possible outcome of a repeatable event observed many times. The frequency of a data value is represented by ‘f’. There are three types of frequency distributions:

  1. Grouped Frequency distribution.
  2. Ungrouped Frequency distribution.
  3. Cumulative Frequency distribution.
  4. Relative Frequency distribution.
  5. Relative cumulative Frequency distribution.

FAQ’s on Real Life Statistics

1. What are the applications of Statistics?

A. Some of the applications of Statistic are listed below :

  1. Statistics applied to Theoretical Statistics and Mathematical Statistics
  2. Statistics in society
  3. Statistical computing
  4. Machine learning and data mining.

2. How many types of Statistics, namely?

Statistics are two types, namely

  1. Descriptive Statistics
  2. Inferential Statistics

3. What is Statistics?

The study of the collection, analysis, interpretation, presentation, and organization of data is called statistics.

4. What are the types of Bar Graphs?

Bar graphs are commonly used in financial analysis for displaying data. Bar graphs are used to compare things between different groups or to track changes over time. There are 3 types of bar graphs namely:

  1. Horizontal Bar Graphs
  2. Vertical Bar Graphs
  3. Line Graph

5. How to represent data on Statistics?

In Statistics, the data can be represented by using pie charts, bar graphs, histograms, pictograms, line graph,s and frequency distribution. Data will be two types one is qualitative and another one is quantitative. Descriptive data is called Qualitative data whereas Numerical data is Quantitative data. Again quantitative data has two types those are discrete and continuous.

8 Times Table Multiplication Chart | Learn Table of 8 | Tips & Tricks to Memorize Multiplication Table of 8

8 Times Multiplication Table

If we want to learn a Multiplication Chart of 8 with whole numbers, this is the right place to learn because you will get complete knowledge on 8 Times Table with whole numbers. Some students may feel the 8 Times Multiplication Chart difficult. To help such students we have mentioned the Table of 8 up to 20 both in the image and tabular format for your convenience. Math Tables are necessary at the time of primary schooling, it develops memory skills at your learning stages.

8 Times Table Multiplication Chart

If we want to practice daily the Multiplication Chart of 8 Times Table, you can download an image format, here we will have the image of 8 Times Table. Learn Tips & Tricks to memorize the Table of 8 and here know how to read and write the Table of Eight. You can download the Multiplication Table of Eight images for free and prepare, then you can easily and fastly solve more basic multiplications, division problems.

8 Times Table

How to Read Multiplication of 8?

One time Eight is 8.

Two times Eight is 16.

Three times Eight is 24.

Four times Eight is 32.

Fives times Eight is 40.

Six times Eight is 48.

Seven times Eight is 56.

Eight times Eight is 64.

Nine times Eight is 72.

Ten times Eight is 80.

Table of 8 | Multiplication Table of 8 up to 20

Get the 8 Times Table Multiplication Chart in the tabular form is shown in the below sections and now you get the idea of how to write the 8 table or Multiplication Table of 8. We have given the first 20 multiples of 8 here. This Multiplication Table of 8 Chart is used to perform the arithmetic operations quickly.

8×1=8
8×2=16
8×3=24
8×4=32
8×5=40
8×6=48
8×7=56
8×8=64
8×9=72
8×10=80
8×11=88
8×12=96
8×13=104
8×14=112
8×15=120
8×16=128
8×17=136
8×18=144
8×19=152
8×20=160

Why should learn Multiplication Table of 8?

Learning a Multiplication Chart of Eight will help to enhance skills and do the calculation quickly. Solving the mathematical problems will increase the mental arithmetic skills. The Multiplication Tables are the basics or fundamentals in learning Maths.

  • 8 Times Table Multiplication Chart helps to understand the patterns easily.
  • Table of 8 makes you perfect in performing the quick calculations.
  • Learning the Multiplication Table of 8, you can easily solve all the mathematical problems like Multiplications, Divisions.

Get More Math Table Multiplication Charts

1 Times Table Multiplication Chart2 Times Table Multiplication Chart3 Times Table Multiplication Chart
4 Times Table Multiplication Chart5 Times Table Multiplication Chart6 Times Table Multiplication Chart
7 Times Table Multiplication Chart9 Times Table Multiplication Chart10 Times Table Multiplication Chart
11 Times Table Multiplication Chart12 Times Table Multiplication Chart13 Times Table Multiplication Chart
14 Times Table Multiplication Chart15 Times Table Multiplication Chart16 Times Table Multiplication Chart
17 Times Table Multiplication Chart18 Times Table Multiplication Chart19 Times Table Multiplication Chart
20 Times Table Multiplication Chart21 Times Table Multiplication Chart22 Times Table Multiplication Chart
23 Times Table Multiplication Chart24 Times Table Multiplication Chart25 Times Table Multiplication Chart

Tips & Tricks to memorize Table of Eight

The below tips and tricks are memorize Multiplication of 8 Times Table, mentioned here

  • Multiplication of 8 Times Table is simple and easy to memorize. However, there is a pattern for every five multiples of 8 i.e., 8, 16, 24, 32, 40, 48, 56, 64, 72, 80.
  • You can identify the multiplication sequence being followed by successive multiples of 8.
  • Multiplying any two numbers, the order does not matter the answer should be always the same (if we multiply the first number with a second number or the second number with the first number). Example, 3 x 4 = 12 or 4 x 3 = 12
  • The patterns will help to remember the product of two numbers.
  • Learning the Table of 8 helps you solve mathematical problems easily.
  • Multiples of 8 are multiples of both 2 and 4.
  • If you multiply an even number with 8 the result will be the same even number in the unit digit i.e 8 x 2 = 16, 8 x 6 = 48, 8 x 8 = 64 and so on.

Solved Examples on 8 Times Table

Example 1:

What does 8 x 7 mean?

Solution:

8 x 7 means multiply 8 with 7 or 8 times 7

8 x 7 = 56

In other words, Seven times Eight is 56.

Therefore, 56 is equal to 8 times 7.

Example 2:

A person eats 3 mangoes per day. How many Mangoes will he eat in 8 days?

Solution:

Given that,

The number of mangoes A person eats in a day is 3

The number of mangoes A person eats in 8days is,

8 days = 8 x 3 = 24 ( three times eight is 24)

Therefore, A person eats 24 mangoes in 8 days.

Example 3:

Sunny planned to attend 8 hours of online classes for 4 days. Unfortunately, he wasn’t able to attend one session for 3hours on one particular day. Using the table of 8 find how many hours of sessions has he attended in total classes?

Solution:

Given that,

Plan to attending classes is 8 hours for 4days

Not attended session hours is 3

now, write  the given statement in the form of a mathematical expression, that is

= 8 x 4 =32

Next, 32 – 3 = 29

Therefore, sunny totally attended online classes is 29 hours.

Example 4:

Find the value of 8 times 6 minus 4 plus 3?

Solution:

Given that, the finding value is 8 times 6 minus 4 plus 3

now, finding

= 8 x 6 = 48

next, minus 4 into the above value

48 – 4 = 44

next, add 3 to the above value

44 + 3 = 47

Therefore the value is 47.

FAQ’s on 8 Times Multiplication Table

1. What is Multiplication Table?

Multiplication tables are the list of multiples of the number. In other words, it defines the multiplication operation of the two given numbers.

2. How to remember the maths tables up to 20?

Create a maths tables chart from 2 to 20 and read the chart every day and practice from basic to remember it.

3. What is the trick for multiplying by 8?

First, identify the pattern and then product the first number with the second number or the second number with the first number. You just read it and remember, otherwise there are no other special tricks for 8 Times Table Multiplication. If the multiplying number is an even number then the unit digit of the remains the same that is even number.

4. What is the importance of the Multiplication Table?

The Multiplication Table helps to keep the information at the fingertips to use it whenever required. It helps to enhance skills and increases memory power and calculation speed.

5. What are the factors of 8?

The number which divides the original number evenly is called a factor of 8. When a pair of numbers are multiplied together to produce 8, then they are called pair factors. When 8 is divided by its factor, it results in zero remainders. The factors are 1, 2, 4, and 8.

3 Times Table Multiplication Chart | Tips & Tricks to remember Table of 3 | How to Read and Write Multiplication Table of Three?

3 Times Table Multiplication Chart

Learning the 3 Times Table Multiplication Chart helps you to keep a track of odd numbers, knowing the table helps students to save a lot of time, mainly in the time-based examination it will be easy to solve any type of mathematical problems. Multiplication Table of 3 is important for the students to memorize the table, it will helps to do a fast and quick calculation. Math Tables have a strong foundation for learning such as Multiplication, Division and Fractions, etc. In this article, you will learn how to read and write the Multiplication Table of Three, Tips & Tricks to memorize the table.

3 Times Table Multiplication Chart

If we learn the 3 Times Table Multiplication Chart simply and easily, you can download the Table of 3 in image format with free pay for a better understanding of students and solving the basic mathematical problems like multiplication, divisions, LCM, etc, so here we can easily download the 3 Times Table Multiplication Chart and try to memorize it, it helps in competitive exams for doing fast calculations.

3 Times Table
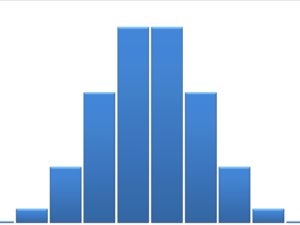
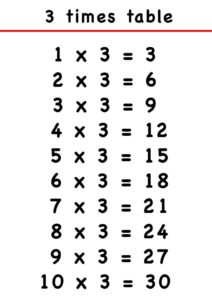
Multiplication Table of 3 up to 20 | How to write Table of 3?

Here given the first 20 multiples of 3 for your comfort. You can remember the 3 Times Table Multiplication Chart output to make your math problems solving easily. You can improve your math skills to gave speed answering the math problems in exams. The below section is a tabular form of a 3 Times Table Multiplication Chart, it will help to perform the arithmetic operations quickly.

3x1=3
3x2=6
3x3=9
3x4=12
3x5=15
3x6=18
3x7=21
3x8=24
3x9=27
3x10=30
3x11=33
3x12=36
3x13=39
3x14=42
3x15=45
3x16=48
3x17=51
3x18=54
3x19=57
3x20=60

How to read Table of 3 in words?

One time three is 3

Two times three is 6

Three times three is 9

Four times three is 12

Five times three is 15

Six times three is 18

Seven times three is 21

Nine times three is 27

Ten times three is 30

Eleven times three is 33

Twelve times three is 36

Thirteen times three is 39

Fourteen times three is 42

Fifteen times three is 45

Sixteen times three is 48

seventeen times three is 51

Eighteen times three is 54

Nineteen times three is 57

Twenty times three is 60

Why should one learn a 3 Times Multiplication Table?

Learning of 3 Times Table is very important and has some advantages also for doing mathematical problems. There are many aspects of mathematics that require time tables to spend less time for solving.

  • Multiplication Table Chart saves your time while performing multiplications, divisions, LCM, Fractions etc.
  • Learning tables helps to solve the mathematical problems easily and quickly.
  • The pattern will be easily understands for learning 3 Times Table Multiplication Chart.
  • 3 Times Multiplication Table makes you perfect in performing the quick calculations.

Get More Multiplication Tables

1 Times Table Multiplication Chart2 Times Table Multiplication Chart4 Times Table Multiplication Chart
5 Times Table Multiplication Chart6 Times Table Multiplication Chart7 Times Table Multiplication Chart
8 Times Table Multiplication Chart9 Times Table Multiplication Chart10 Times Table Multiplication Chart
11 Times Table Multiplication Chart12 Times Table Multiplication Chart13 Times Table Multiplication Chart
14 Times Table Multiplication Chart15 Times Table Multiplication Chart16 Times Table Multiplication Chart
17 Times Table Multiplication Chart18 Times Table Multiplication Chart19 Times Table Multiplication Chart
20 Times Table Multiplication Chart21 Times Table Multiplication Chart22 Times Table Multiplication Chart
23 Times Table Multiplication Chart24 Times Table Multiplication Chart25 Times Table Multiplication Chart

Tips & Tricks to remember Table of 3

Memorize of 3 Times Table Multiplication Chart Tips & Tricks are listed below.

  1. To Remembering the 3 Times Multiplication Table, first you have to know how many numbers are increased to get each resultant.
  2. Learning the 3 Times Table Multiplication Chart using skip counting process.
  3. The patterns will help to remember the product of two numbers.
  4. Learning the Table of 3 Times helps to solve mathematical problems easily
  5. Practice each table until you get perfect on it and also practice the number of multiplication facts.
  6. The last digit of these 3 multiples will always repeat. You can remember these digits to memorize the multiples of 3 easily.

Solved Examples on 3 Times Table

Example 1:

Calculate the value of 3 plus 3 times of 7 minus 4, using the 3 Times Table?

Solution:

Given, calculate the value using 3 Times Table

First, we have to write down the given statement 3 plus 3 times of 7 minus 4

Now, solving the above expression by using 3 Times Table Multiplication Chart,

3 plus 3 times 7 minus 4 = 3 + 3 x 7 – 4

= 3 + 21 – 4

= 3 + 17

= 20

Therefore the value of 3 plus 3 times of 7 minus 4 is 20.

Example 2:

There are 3 dogs, each dog has 15 biscuits. How many biscuits are there in total?

Solution:

Given that,

The number of dogs is 3

Number of biscuits per each dog has 15 biscuits.

Now, find the total number of biscuits

According to law of multiplication ,we can finding the total number of biscuits

By using 3 times table,

The total number of biscuits = 3 x 15 = 45

so , all the dogs have totally 45 biscuits.

Therefore, the total biscuits are 45.

Example 3:

John has 6 cards with numbers 7, 13, 15, 18 ,20, 24, 28 written on them. Take help from the table of 3, and assist john in identifying the cards which are 3 times any number?

Solution:

Given 8 cards numbers are 7, 13, 15, 18, 20, 24, 28

From the table of 3 multiples, the first 10 multiples of whole numbers are 3, 6, 9, 12, 15, 18, 21, 24, 27, 30.

Therefore, among the 7 cards only 3 multiple cards are 15, 18, 24. These 3 card numbers are the only table of 3 multiples, so john has 3 card numbers of 3 multiples.

Example 4:

By using the 3 Times Table find the (i) 3 times 12 (ii) 3 times 3 plus 7 (iii) 3 times 4 minus 3 (iv) 3 times 2 multiple of 5?

Solution:

(i) Given, find the value of 3 times 12

By using the 3 times table, to solve the given expression

3 Times 12 in mathematical expression is equal to 3 X 12 = 36.

So, the value of  3 times 12 is equal to 36.

(ii) Given, to find the value of  3 times 3 plus 7

By using the 3 Times table, to solve the given expression

3 times 3 plus 7 can be written in mathematical expression as,

3 x 3 +7

9+ 7 = 16

so, the value of 3 x 3 + 7 is equal to 16.

(iii) Given, finding the value of 3 times 4 minus 3

By using the 3 times table, to solve the given expression

We can write the given expression in mathematical form as 3 x 4 – 3

3 x 4 -3 = 12 – 3 = 9

so, the value of 3 x 4 – 3 is 9.

(iv) Given, finding the value of 3 times 2 multiple of 5

By using the 3 times table, to solve the given expression

We can write the given expression in mathematical form as,

3 x 2 x 5 = 6 x 5 = 30

So,the value of 3 times 2 multiples of 5 is equal to 30.

International Numbering System – Definition, Examples | How to Write Numbers in International Number System?

International Numbering System

Numbers were invented for the purpose of counting. The number system is defined as a writing system to express the number in a consistent manner. The place values of digits express in the sequence of ones, tens, hundreds, thousands, ten thousand, hundred thousand, millions, ten million, and so on in the international number system. Students can also know more about the international numbering system with example questions in the following sections.

International Numbering System Definition

The international numbering system is followed by most of the countries in the world. In this system, a number is split into groups or periods. In the international number system, we use ones (1), tens (10), hundreds (100), thousands (1000), ten thousands (10,000), hundred thousand’s (100,000), one millions (1,000,000), ten millions (10,000,000), hundreds millions (100,000,000), etc. We place the numbers according to their place value. We place a comma after each period to differentiate the periods.

How to Express Numbers in International System?

Based on the number of digits in the number, it is divided into periods.

  • The first period is known as one’s period, formed with the first 3 digits of the number.
  • The second period is called the thousands period, formed with the next 3 digits of the number.
  • The third period is called the millions period, formed with the digits after thousands.

Also, Read

International Numbering System Examples

Question 1:

Write the following figures in the international system.

(i) Six hundred thousand

(ii) Fifty million

(iii) Six hundred million

Solution:

To represent the given figures in the international numbering system, we must identify the period.

(i) The given figure is six hundred thousand

The hundred thousand means 100,000

six hundred thousand is 600,000.

(ii) The given figure is fifty million

Million means the third period formed after three digits of the thousands period. One million is 1,000,000

So, fifty million means 50,000,000.

(iii) The given figure is six hundred million

Million means the third period formed after three digits of the thousands period. One million is 1,000,000 and one hundred million is 100,000,000.

So, five hundred million is 500,000,000.

Question 2:

Write the following in figures in the International system:

(i) Six thousand, five hundred and twenty-two.

(ii) Three hundred and twenty-five thousand, four hundred and two

(iii) Three hundred and fifteen million, one hundred and twenty-one thousand, eight hundred and ten

Solution:

To express these word figures into the international numbering system, we need to have a clear idea of the periods.

(i) The given figure is six thousand, five hundred and twenty-two

six thousand means 6,000

five hundred means 500

twenty means 20

two means 2.

So, six thousand, five hundred and twenty-two is 6,522.

(ii) The given figure is Three hundred and twenty-five thousand, four hundred and two

Three hundred and twenty-five thousand means 325,000

four hundred means 400

two means 2

So, Three hundred and twenty-five thousand, four hundred and two is 325,402.

(iii) The given figure is Three hundred and fifteen million, one hundred and twenty-one thousand, eight hundred and ten

Three hundred and fifteen million is 315,000,000

one hundred and twenty-one thousand means 125,000

eight hundred means 800

ten means 10

So, Three hundred and fifteen million, one hundred and twenty-one thousand, eight hundred and ten is 315,125,810.

Question 3:

Write the following figures in the international system.

(i) Five million six hundred and twenty-five thousand seven hundred

(ii) One hundred ninety-six thousand eight hundred sixty-seven

(iii) Four hundred and ten thousand one hundred and six

Solution:

To express these word figures into the international numbering system, we need to have a clear idea of the periods.

(i) The given figure is Five million six hundred and twenty-five thousand seven hundred

Five million six hundred means 560,000,000

twenty-five thousand means 25,000

seven hundred means 700.

So, Five million six hundred and twenty-five thousand seven hundred is 560,025,700.

(ii) The given figure is One hundred ninety-six thousand eight hundred sixty-seven

One hundred ninety-six thousand means 196,000

eight hundred sixty-seven means 867.

So, One hundred ninety-six thousand eight hundred sixty-seven is 196,867.

(iii) The given figure is Four hundred and ten thousand one hundred and six

Four hundred and ten thousand means 410,000

one hundred and six means 106

So, Four hundred and ten thousand one hundred and six is 410,106.

Question 4:

(i) 25,896

(ii) 185,200,604

(iii) 568,952

Solution:

Write the following figures in the international system.

(i) The given figure is 25,896

25,000 is twenty-five thousand.

896 is eight hundred and ninety-six.

So, 25,896 is twenty-five thousand eight hundred and ninety-six

(ii) The given figure is 185,200,604

185,000,000 is one hundred and eighty-five million

200,000 is two hundred thousand

604 is six hundred and four.

So, 185,200,604 is eighty-five million and two hundred thousand six hundred and four..

(iii) The given figure is 568,952

568,000 is five hundred and sixty-eight thousand

952 is nine hundred fifty-two.

So, 568,952 is five hundred and sixty-eight thousand nine hundred and fifty-two.

FAQs on International Numbering System

1. Compare Indian and International Number System?

The major difference between the Indian and international number systems is the placement of the separators and nomenclature of different place values. In the international system, nine places are grouped into three periods ones, thousands, and millions.

In the Indian system, nine places are grouped into four periods. The place values of the Indian system are ones, tens, hundreds, thousands, ten thousand, lakhs, ten lakhs, crores, and ten crores. The international system place values are ones, tens, hundreds, thousands, ten thousand, hundred thousand, millions, ten million, and hundred million.

2. How do you write 6 digit numbers in the international system?

The 1st digit is ones, 2nd is tens, 3rd is hundreds, fourth is thousand, the fifth digit is ten thousand and six-digit is hundred thousand. The six digits have 2 periods.

3. How many periods are there in an international number system?

The international number system has 3 periods. They are ones, thousands, and millions. One period has ones, tens, and hundreds.

Conversion of Seconds into Minutes – Definitions, Formula, Examples | How to Convert Seconds to Minutes?

Conversion of Seconds into Minutes

Do you want to know one second is how many minutes? Then read this complete page. Here, you can learn about the seconds to minutes conversion with a detailed explanation. You will also learn the steps of converting seconds into minutes. Get to know more about what is a second, minute, and what are different units of time, and others. Refer to Seconds to Minutes Conversion Formula, Step by Step Procedure on how to convert seconds into minutes, solved examples, here.

Minutes and Seconds – Definitions

Minute, second are the different units of time. In general, hours is the highest unit, next minutes and then seconds. Minute is a period of time which is equal to sixty seconds or sixtieth of an hour. Actually, a second is the duration of 9,192,631,770 periods of the radiation corresponding to the transition between the two hyperfine levels of the ground state of the cesium-133 atom. And it is a small division of an hour.

Also, Check:

Seconds to Minutes Conversion Formula

The simple formula to convert minutes into seconds is as follows:

1 Minute = 60 Seconds

So, 1 Second = \(\frac { 1 }{ 60 } \) Minute

Number of minutes = \(\frac { 1 }{ 60 } \) x number of seconds

How to Convert Seconds to Minutes?

Check out the simple and detailed steps to convert the seconds into minutes. They are in the following fashion

  • Let us take the number of seconds you want to convert into minutes.
  • In general, 1 second = \(\frac { 1 }{ 60 } \) minute
  • Multiply the given number of seconds by \(\frac { 1 }{ 60 } \).
  • The result is called the minutes.

Also, Read

Seconds to Minutes Conversion Examples

Example 1: 

Convert 150 seconds into minutes?

Solution:

The given number of seconds = 150

Multiply 150 by (\(\frac { 1 }{ 60 } \))

So, 150 seconds = \(\frac { 150 }{ 60 } \)

Conversion of Seconds into Minutes 1

Therefore, 150 seconds = 2.5 Minutes

Example 2:

Convert 215 seconds into minutes.

Solution:

The given number of seconds = 215

Multiply 215 by \(\frac { 1 }{ 60 } \)

So, 215 seconds = \(\frac { 215 }{ 60 } \)

Conversion of Seconds into Minutes 2

Therefore, 215 seconds = 3.583 minutes.

Example 3:

Convert 180 seconds into minutes.

Solution:

The given number of seconds = 180

Multiply 180 by \(\frac { 1 }{ 60 } \)

So, 180 seconds = \(\frac { 180 }{ 60 } \) minutes

Conversion of Seconds into Minutes 3

Therefore, 180 seconds = 3 minutes

Example 4:

Convert 516 seconds into minutes.

Solution:

The given number of seconds = 516

Multiply 516 by \(\frac { 1 }{ 60 } \)

So, 516 seconds = \(\frac { 516 }{ 60 } \) minutes

Conversion of Seconds into Minutes 4

Therefore, 516 seconds = 8.6 minutes.

Example 5:

Convert 1020 seconds into minutes.

Solution:

The given number of seconds = 1020

Multiply 1020 by \(\frac { 1 }{ 60 } \)

So, 1020 seconds = \(\frac { 1020 }{ 60 } \) minutes

Conversion of Seconds into Minutes 5

Therefore, 1020 seconds = 17 minutes.

Common Conversions Facts About Time

Below are a few easy & quick conversion facts about the unit of time.

1 Hour = 60 Minutes

1 Minute = 60 seconds

1 Second = \(\frac { 1 }{ 60 } \) Minute

1 Minute = \(\frac { 1 }{ 3600 } \) Hour

1 Hour = 3600 seconds

12 hours = 1 day

12 hours = 43,200 seconds

1 day = 24 hours = 1440 minutes

1 day = 24 hours = 86,400 seconds

Seconds to Minutes Conversion Table

Here is the conversion table of Seconds (sec) to Minutes (min):

SecondsMinutes
1 Second\(\frac { 1 }{ 60 } \) Minute
2 Seconds\(\frac { 2 }{ 60 } \) Minute
10 Seconds\(\frac { 1 }{ 6 } \) Minute
25 Seconds\(\frac { 25 }{ 60 } \) Minute
50 Seconds\(\frac { 5 }{ 6 } \) Minute
60 Seconds1 Minute
120 Seconds2 Minutes
180 Seconds3 Minutes
240 Seconds4 Minutes
300 Seconds5 Minutes

FAQ’s on Conversion of Seconds into Minutes

1. How do you convert seconds to minutes?

To convert seconds into minutes, multiply the number of seconds by \(\frac { 1 }{ 60 } \). The obtained product is the converted minutes.

2. How many minutes is 540 seconds?

540 seconds = \(\frac { 540 }{ 60 } \) = \(\frac { 54 }{ 6 } \)

540 seconds = 9 minutes.

3. How do you convert minutes into seconds?

Generally, we know that 1 minute = 60 seconds. To convert minutes into seconds, multiply the number of minutes by 60 to get the number of seconds.

Worksheet on 18 Times Table | Printable 18 Times Table Worksheet with Answers

Worksheet on 18 Times Table

Worksheet on Multiplication Table of 18 is provided here. Check out the important questions involved in the 18 Times Table Multiplication Chart. Have a look at the various methods, rules, formulas that helps to solve the questions of the 18 Times Table. After reading this page, you will be able to understand and importance of the 18 tables along with their applications. Solved example questions on the Worksheet on 18 Times Table will help you to get a piece of detailed information and also helps you to score good marks in the exam.

18 Times Multiplication Table Chart up to 25

Check out the multiplication table of 18 and remember the output to make your math-solving problems easy.

18x0=0
18x1=18
18x2=36
18x3=54
18x4=72
18x5=90
18x6=108
18x7=126
18x8=144
18x9=162
18x10=180
18x11=198
18x12=216
18x13=234
18x14=252
18x15=270
18x16=288
18x17=306
18x18=324
18x19=342
18x20=360
18x21=378
18x22=396
18x23=414
18x24=432
18x25=450

Problem 1:

Find each product using the multiplication table of 18

(i) 16 x 18

(ii) 21 x 18

(iii) 8 x 18

(iv) 5 x 18

(v) 9 x 18

Solution:

(i) The given two numbers are 16, 18

16 x 18 = 288

The product of 16 and 18 is 288.

(ii) The given two numbers are 21, 18

21 x 18 = 378

The product of 21 and 18 is 378.

(iii) The given two numbers are 8, 18

8 x 18 = 144

The product of 8 and 18 is 144.

(iv) The given two numbers are 5, 18

5 x 18 = 90

The product of 5 and 18 is 90.

(v) The given two numbers are 9, 18

9 x 18 = 162

The product of 9 and 18 is 162.


Problem 2:

Name the number just after:

(i) 7 x 18

(ii) 18 x 18

(iii) 15 x 18

(iv) 10 x 18

Solution:

(i) The given numbers are 7, 18

7 x 18 = 126

The number just after is 126 + 1 = 127.

(ii) The given numbers are 18, 18

18 x 18 = 324

The number just after is 324 + 1 = 325.

(iii) The given numbers are 15, 18

15 x 18 = 270

The number just after is 270 + 1 = 271.

(iv) The given numbers are 10, 18

10 x 18 = 180

The number just after is 180 + 1 = 181.


Problem 3:

Name the number just before:

(i) 18 x 12

(ii) 18 x 24

(iii) 18 x 17

(iv) 18 x 4

Solution:

(i) The given numbers are 18, 12

18 x 12 = 216

The number just before 216 is 216 – 1 = 215.

(ii) The given numbers are 18, 24

18 x 24 = 432

The number just before 432 is 432 – 1 = 431.

(iii) The given numbers are 18, 17

18 x 17 = 306

The number just before 306 is 306 – 1 = 305.

(iv) The given numbers are 18, 4

18 x 4 = 72

he number just before 72 is 72 – 1 = 71.


Problem 4:

The cost of a cricket bat is $18. How much will 50 such cricket bats cost?

Solution:

Given that,

The cost of one cricket bat = $18

The cost of 50 such cricket bats is obtained by multiplying one cricket bat by 50.

So, the cost of 50 cricket bats = 18 x 50 = 900

Worksheet on 18 Times Table 1

Therefore, the cost of 50 cricket bats is $900.


Problem 5:

A doll costs $15. How much will 18 such dolls cost?

Solution:

Given that,

The cost of a doll = $15

The cost for 18 dolls = 18 x 15 = 270

Worksheet on 18 Times Table 2

Therefore, $270 is the cost for 18 dolls.


Problem 6:

Complete the chart by multiplying the numbers by 18.

(i) 1, 2, 3, 4, 5, 6, 7, 8, 9, 10 (ii) 52, 85, 96, 152, 638, 452

Solution:

The 18 table multiplication chart is along the lines.

(i) 18 x 1 = 18

18 x 2 = 36

18 x 3 = 54

18 x 4 = 72

18 x 5 = 90

18 x 6 = 108

18 x 7 = 126

18 x 8 = 144

18 x 9 = 162

18 x 10 = 180

(ii) 18 x 52 = 936

Worksheet on 18 Times Table 3

18 x 85 = 1530

Worksheet on 18 Times Table 4

18 x 96 = 1728

Worksheet on 18 Times Table 5

18 x 152 = 2736

Worksheet on 18 Times Table 6

18 x 638 = 11,484

Worksheet on 18 Times Table 7

16 x 452 = 8136

Worksheet on 18 Times Table 8


Problem 7:

(i) What are 18 elevens?

(ii) 18 times 9?

(iii) 12 eighteen’s?

(iv) Eighteen times 9?

(v) What are 6 times 18?

(vi) Eighteen’s 4?

(vii) 18 times 11?

(viii) Eighteen’s 7?

(ix) What is 18 multiplied by 8?

(x) 5 multiplied by 18?

Solution:

(i) 18 elevens mean the product of 18 and 11

18 x 11 = 198

So, 18 elevens is 198.

(ii) 18 times 9 means the product of 18 and 9

18 x 9 = 162

So, 18 times 9 is 162.

(iii) 12 eighteen’s means the product of 12 and 18

12 x 18 = 216

So, 12 eighteen’s is 216.

(iv) Eighteen times 9 means the product of 18 and 9

18 x 9 = 162

So, Eighteen times 9 is 162.

(v) 6 times 18 means the product of

6 x 18 = 108

So, 6 times 18 is 108

(vi) Eighteen’s 4 means the product of 18 and 4

18 x 4 = 72

So, Eighteen’s 4 is 72.

(vii) 18 times 11 means the product of 18 and 11

18 x 11 = 198

So, 18 times 11 is 198.

(viii) Eighteen’s 7 means the product of 18 and 7

18 x 7 = 126

So, eighteen’s 7 is 126.

(ix) 18 multiplied by 8 means the product of 18 and 8

18 x 8 = 144

So, 18 multiplied by 8 is 144.

(x) 5 multiplied by 18 means the product of 5 and 18

5 x 18 = 90

So, 5 multiplied by 18 is 90.


Problem 8:

The cost of a pocket Radio set is 18 dollars. What will be the cost of 7 such Radio sets?

Solution:

Given that,

The cost of a pocket Radio set = 18 dollars

The cost of 7 such Radio sets = The cost of one pocket radio set x 7

= 18 x 7

= 126

Therefore, the cost of 7 such Radio sets is 126 dollars.


Problem 9:

What does 18 × 82 mean? What number is it equal to?

Solution:

18 x 82 means the product of 18 and 82

Worksheet on 18 Times Table 9

18 x 82 = 1476

So, 18 x 82 is equal to 1476 and 18 x 82 means 1476.


Problem 10:

Solve the following using the 18 times table.

(i) How many eighteen’s in 198?

(ii) 18 times 6 minus 4

(iii) How many eighteen’s in 972?

(iv) How many eighteen’s in 1728?

(v) 18 times 16 minus 45

(vi) How many eighteen’s in 1134?

(vii) 18 times 2 plus 6

(viii) How many eighteen’s in 108?

(ix) How many eighteen’s in 1170?

(x) How many eighteen’s in 1332?

Solution:

(i) How many eighteen’s in 198 means divide 198 by 18.

Worksheet on 18 Times Table 10

198 ÷ 18 = 11

There are 11 eighteen’s in 198.

(ii) 18 times 6 minus 4

18 times 6 means the product of 18 and 6

18 x 6 = 108

108 – 4 = 104

18 times 6 minus 4 is 104.

(iii) How many eighteen’s in 972 means divide 972 by 18

Worksheet on 18 Times Table 11

972 ÷ 18 = 54

So, there are 54 eighteen’s in 972.

(iv) How many eighteen’s in 1728 means divide 1728 by 18

Worksheet on 18 Times Table 12

1728 ÷ 18 = 96

So, there are 96 eighteen’s in 1728.

(v) 18 times 16 minues 45

18 times 16 means the product of 18 and 16

18 x 16 = 288

18 times 16 minues 45 = 288 + 45 = 333

So, 18 times 16 minues 45 is 333.

(vi) How many eighteen’s in 1134 means divide 1134 by 18

Worksheet on 18 Times Table 13

1134 ÷ 18 = 63

So, there are 63 eighteen’s in 1134

(vii) 18 times 2 plus 6

18 times 2 means the product of 18 and 2

18 x 2 = 36

18 times 2 plus 6 = 36 + 6 = 42

So, 18 times 2 plus 6 is 42

(viii) How many eighteen’s in 108 means divide 108 by 18

Worksheet on 18 Times Table 14

108 ÷ 18 = 6

So, there are 6 eighteen’s in 108.

(ix) How many eighteen’s in 1170 means divide 1170 by 18

Worksheet on 18 Times Table 15

1170 ÷ 18 = 65

So, there are 65 eighteen’s in 1170

(x) How many eighteen’s in 1332 means divide1332 by 18

Worksheet on 18 Times Table 16

1332 ÷ 18 = 74

So, there are 74 eighteen’s in 1332


Logarithms

Mathematics Logarithm

  • Mathematics Logarithms
  • Convert Exponentials and Logarithms
  • Logarithm Rules or Log Rules
  • Solved Problems on Logarithm
  • Common Logarithm and Natural Logarithm
  • Antilogarithm

Statistics

Statistics

  • Real-Life Statistics
  • Terms Related to Statistics
  • Frequency Distribution of Ungrouped and Grouped Data
  • Use of Tally Marks
  • Class Limits in Exclusive and Inclusive Form
  • Construction of Bar Graphs
  • Mean
  • Mean of the Tabulated Data
  • Mode
  • Median
  • Construction of Pie Chart
  • How to Construct a Line Graph?

Probability

Probability

  • Probability
  • Definition of Probability
  • Random Experiments
  • Experimental Probability
  • Events in Probability
  • Empirical Probability
  • Coin Toss Probability
  • Probability of Tossing Two Coins
  • Probability of Tossing Three Coins
  • Complimentary Events
  • Mutually Exclusive Events
  • Mutually Non-Exclusive Events
  • Conditional Probability
  • Theoretical Probability
  • Odds and Probability
  • Playing Cards Probability
  • Probability and Playing Cards
  • Probability Rolling a Die
  • Probability for Rolling Two Dice
  • Probability for Rolling Three Dice
  • Solved Probability Problems
  • Probability Questions Answers
  • Coin Toss Probability Worksheet
  • Worksheet on Playing Cards
  • 10th Grade Worksheet on Probability

Matrix

Matrix

  • Definition of a Matrix
  • Order of a Matrix
  • Position of an Element in a Matrix
  • Classification of Matrices
  • Problems on Classification of Matrices
  • Square Matrix
  • Row Matrix
  • Column Matrix
  • Null Matrix
  • Equal Matrices
  • Identity (or Unit) Matrix
  • Triangular Matrix
  • Addition of Matrices
  • Addition of Two Matrices
  • Properties of Addition of Matrices
  • Negative of a Matrix
  • Subtraction of Matrices
  • Subtraction of Two Matrices
  • Scalar Multiplication of a Matrix
  • Multiplication of a Matrix by a Number
  • Properties of Scalar Multiplication of a Matrix
  • Multiplication of Matrices
  • Multiplication of Two Matrices
  • Problems on Understanding Matrices
  • Worksheet on Understanding Matrix
  • Worksheet on Addition of Matrices
  • Worksheet on Matrix Multiplication
  • Worksheet on Matrix

Basic Concepts of Sets

  • Sets
  • Sets Theory
  • Objects Form a Set
  • Elements of a Set
  • Properties of Sets
  • Representation of a Set
  • Different Notations in Sets
  • Standard Sets of Numbers
  • Types of Sets
  • Pairs of Sets
  • Subset
  • Subsets of a Given Set
  • Finite Sets and Infinite Sets
  • Power Set
  • Operations on Sets
  • Union of Sets
  • Problems on Union of Sets
  • Intersection of Sets
  • Problems on Intersection of Sets
  • Difference of two Sets
  • Complement of a Set
  • Problems on Complement of a Set
  • Problems on Operation on Sets
  • Cardinal number of a set
  • Cardinal Properties of Sets
  • Word Problems on Sets
  • Venn Diagrams
  • Venn Diagrams in Different Situations
  • Relationship in Sets using Venn Diagram
  • Union of Sets using Venn Diagram
  • Intersection of Sets using Venn Diagram
  • Disjoint of Sets using Venn Diagram
  • Difference of Sets using Venn Diagram
  • Symmetric Difference using Venn Diagram
  • Complement of a Set using Venn Diagram
  • Examples on Venn Diagram
  • Laws of Algebra of Sets
  • Proof of De Morgan’s Law
  • Properties of Elements in Sets
  • Reflexive Relation on Set
  • Symmetric Relation on Set
  • Anti-symmetric Relation on Set
  • Transitive Relation on Set
  • Equivalence Relation on Set

Algebra 1

Algebra 1 Math Lessons – Table of Contents

Variables and Expressions

Powers and Exponents

Order of Operations

Open Sentences:

Identity and Equality Properties:

The Distributive Property:

Commutative and Associative Properties:

Logical Reasoning and Counterexamples:

Number Systems:

Functions and Graphs: