Eureka Math Grade 6 Module 6 Lesson 3 Answer Key

Engage NY Eureka Math Grade 6 Module 6 Lesson 3 Answer Key

Eureka Math Grade 6 Module 6 Lesson 3 Example Answer Key

Robert, a sixth-grader at Roosevelt Middle School, usually goes to bed around 10:00 p.m. and gets up around 6:00 a.m. to get ready for school. That means he gets about 8 hours of sleep on a school night. He decided to investigate the statistical question: How many hours per night do sixth graders usually sleep when they have school the next day?
Robert took a survey of 29 sixth graders and collected the following data to answer the question.

7 8 5 9 9 9 7 7 10 10 11 9 8 8 8 12 6 11 10 8 8 9 9 9 8 10 9 9 8

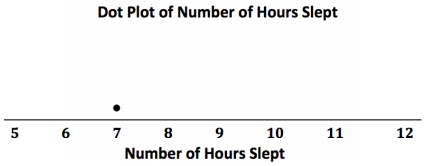
Robert decided to make a dot plot of the data to help him answer his statistical question. Robert first drew a number line and labeled it from 5 to 12 to match the lowest and highest number of hours slept. Robert’s datum is not included.

Eureka Math Grade 6 Module 6 Lesson 3 Example Answer Key 1

He then placed a dot above 7 for the first value in the data set. He continued to place dots above the numbers until each number in the data set was represented by a dot.

Eureka Math Grade 6 Module 6 Lesson 3 Example Answer Key 2

Exercises 1 – 9:

Exercise 1.
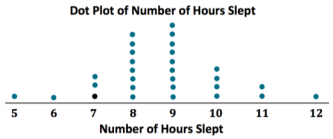
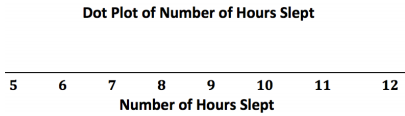
Complete Robert’s dot plot by placing a dot above the corresponding number on the number line for each value in the data set. If there is already a dot above a number, then add another dot above the dot already there. Robert’s datum is not included.
Answer:
Eureka Math Grade 6 Module 6 Lesson 3 Example Answer Key 5

Exercise 2.
What are the least and the most hours of sleep reported In the survey of sixth graders?
Answer:
The least number of hours students slept is 5, and the most number of hours slept is 12.

Exercise 3.
What number of hours slept occurred most often in the data set?
Answer:
9 is the most common number of hours that students slept.

Exercise 4.
What number of hours of sleep would you use to describe the center of the data?
Answer:
The center is around 8 or 9. (Answers may vary, but students’ responses should be around the center of the data
distribution.)

Exercise 5.
Think about how many hours of sleep you usually get on a school night. How does your number compare with the number of hours of sleep from the survey of sixth graders?
Answer:
Answers will vary. For example, a student might say that the number of hours she sleeps is similar to what these students reported, or she might say that she generally gets less (or more) sleep than the sixth graders who were
surveyed.

Here are the data for the number of hours the sixth graders usually sleep when they do not have school the next day.
7 8 10 11 5 6 12 13 13 7 9 8 10 12 11 12 8 9 10 11 10 12 11 11 11 12 11 11 10

Exercise 6.
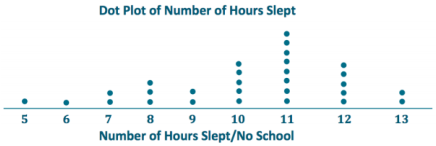
Make a dot plot of the number of hours slept when there is no school the next day.
Answer:
Eureka Math Grade 6 Module 6 Lesson 3 Example Answer Key 6

Exercise 7.
When there is no school the next day, what number of hours of sleep would you use to describe the center of the
data?
Answer:
The center of the data is around 11 hours. (Answers may vary, but student responses should be around the center of the data distribution.)

Exercise 8.
What are the least and most number of hours slept with no school the next day reported in the survey?
Answer:
The least number of hours students sleep is 5, and the most number of hours students sleep is 13.

Exercise 9.
Do students tend to sleep longer when they do not have school the next day than when they do have school the next day? Explain your answer using the data in both dot plots.
Answer:
Yes, because more of the data points are in the 10, 11, 12, and 13 categories in the no school dot plot than in the have school dot plot.

Example 2: Building and Interpreting a Frequency Table

A group of sixth-graders investigated the statistical question, “How many hours per week do sixth graders spend playing a sport or an outdoor game?”

Here are the data students collected from a sample of 26 sixth graders showing the number of hours per week spent playing a sport or a game outdoors.

3 2 0 6 3 3 3 1 1 2 2 8 12 4 4 4 3 3 1 1 0 0 6 2 3 2

To help organize the data, students summarized the data in a frequency table. A frequency table lists possible data values and how often each value occurs.

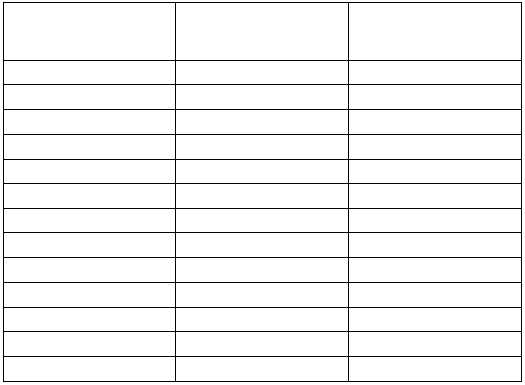
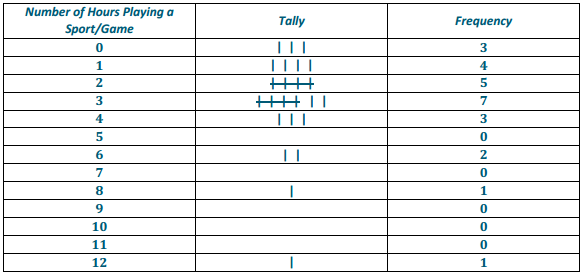
To build a frequency table, first make three columns. Label one column “Number of Hours Playing a Sport/Game,” label the second column “Tally,” and label the third column “Frequency.” Since the least number of hours was 0 and the most was 12, list the numbers from 0 to 12 in the “Number of Hours” column.

Eureka Math Grade 6 Module 6 Lesson 3 Example Answer Key 3

Exercises 10 – 15:

Exercise 10.
Complete the tally mark column in the table created in Example 2.
Answer:
Eureka Math Grade 6 Module 6 Lesson 3 Example Answer Key 4

Exercise 11.
For each number of hours, find the total number of tally marks, and place this in the frequency column in the table created in Example 2.
Answer:
Eureka Math Grade 6 Module 6 Lesson 3 Example Answer Key 4

Exercise 12.
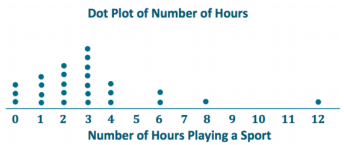
Make a dot plot of the number of hours playing a sport or playing outdoors.
Answer:
Eureka Math Grade 6 Module 6 Lesson 3 Example Answer Key 7

Exercise 13.
What number of hours describes the center of the data?
Answer:
The center of data is around 3. (Answers may vary, but student responses should be around the center of the data distribution.)

Exercise 14.
How many of the sixth graders reported that they spend eight or more hours a week playing a sport or playing
outdoors?
Answer:
Only 2 sixth graders reported they spent 8 or more hours a week playing a sport or playing outdoors.

Exercise 15.
The sixth graders wanted to answer the question, “How many hours do sixth graders spend per week playing a sport or playing an outdoor game?” Using the frequency table and the dot plot, how would you answer the sixth graders’ question?
Answer:
Most sixth graders spend about Z to 4 hours per week playing a sport or playing outdoors.

Eureka Math Grade 6 Module 6 Lesson 3 Problem Set Answer Key

Question 1.
The data below are the number of goals scored by a professional indoor soccer team over its last 23 games.
8 16 10 9 11 11 10 15 16 11 15 13 8 9 11 9 8 11 16 15 10 9 12

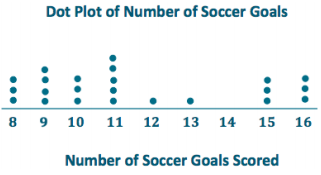
a. Make a dot plot of the number of goals scored.
Answer:
Eureka Math Grade 6 Module 6 Lesson 3 Problem Set Answer Key 8

b. What number of goals describes the center of the data?
Answer:
The center of the data is around 11 or 12. (Answers may vary, but student responses should be around the center of the data distribution.)

c. What is the least and most number of goals scored by the team?
Answer:
The least number of goals scored is 8, and 16 is the most.

d. Over the 23 games played, the team lost 10 games. Circle the dots on the plot that you think represent the games that the team lost. Explain your answer.
Answer:
Students will most likely circle the lowest 10 scores, but answers may vary. Students need to supply on explanation in order to defend their answers.

Question 2.
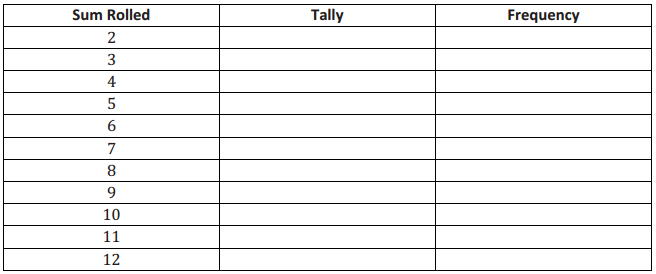
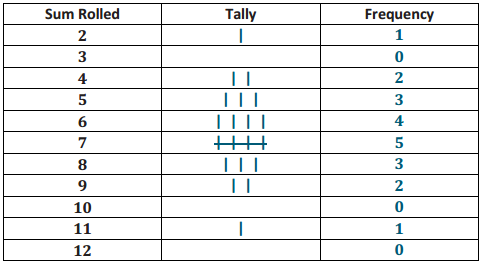
A sixth grader rolled two number cubes 21 times. The student found the sum of the two numbers that he rolled each time. The following are the sums for the 21 rolls of the two number cubes.
9 2 4 6 5 7 8 11 9 4 6 5 7 7 8 8 7 5 7 6 6

a. Complete the frequency table.
Eureka Math Grade 6 Module 6 Lesson 3 Problem Set Answer Key 9
Answer:
Eureka Math Grade 6 Module 6 Lesson 3 Problem Set Answer Key 10

b. What sum describes the center of the data?
Answer:
7

c. What sum occurred most often for these 21 rolls of the number cubes?
Answer:
7

Question 3.
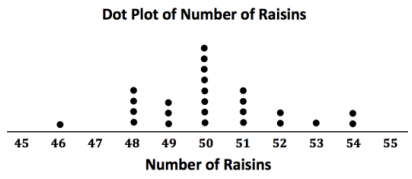
The dot plot below shows the number of raisins in 25 small boxes of raisins.
Eureka Math Grade 6 Module 6 Lesson 3 Problem Set Answer Key 11

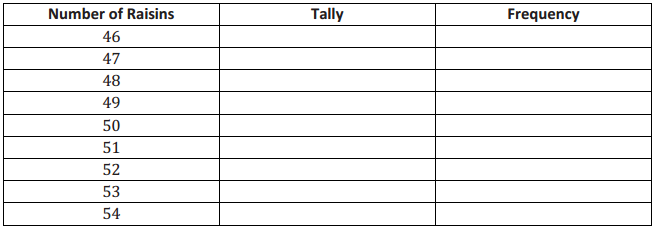
a. Complete the frequency table.
Eureka Math Grade 6 Module 6 Lesson 3 Problem Set Answer Key 13
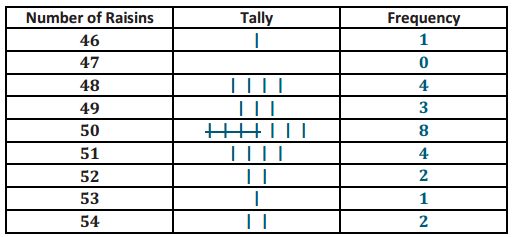
Answer:
Eureka Math Grade 6 Module 6 Lesson 3 Problem Set Answer Key 12

b. Another student opened up a box of raisins and reported that It had 63 raisins. Do you think that this student had the same size box of raisins? Why or why not?
Answer:
I think the student did not have the same size box because the 21 small boxes opened had at most 54 raisins, and 63 is too high.

Eureka Math Grade 6 Module 6 Lesson 3 Exit Ticket Answer Key

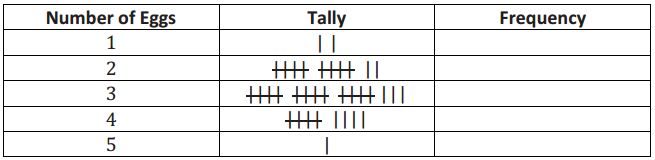
A biologist collected data to answer the question, “How many eggs do robins lay?”

The following is a frequency table of the data she collected:
Eureka Math Grade 6 Module 6 Lesson 3 Exit Ticket Answer Key 14

Question 1.
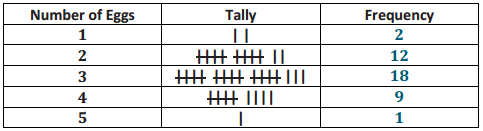
Complete the frequency column.
Answer:
Eureka Math Grade 6 Module 6 Lesson 3 Exit Ticket Answer Key 15

Question 2.
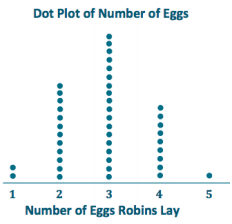
Draw a dot plot of the data on the number of eggs a robin lays.
Answer:
Eureka Math Grade 6 Module 6 Lesson 3 Exit Ticket Answer Key 16

Question 3.
What number of eggs describe the center of the data?
Answer:
The center of the data is around 3. (Answer may vary, but student responses should be around the center of the data distribution.)

Eureka Math Grade 6 Module 6 Lesson 2 Answer Key

Engage NY Eureka Math Grade 6 Module 6 Lesson 2 Answer Key

Eureka Math Grade 6 Module 6 Lesson 2 Example Answer Key

Example 1: Heart Rate

Mia, a sixth-grader at Roosevelt Middle School, was thinking about joining the middle school track team. She read that Olympic athletes have lower resting heart rates than most people. She wondered about her own heart rate and how it would compare to other students. Mia was interested in investigating the statistical question: What are the heart rates of students in my sixth-grade class?

Heart rates are expressed as beats per minute (or bpm). Mia knew her resting heart rate was 80 beats per minute. She asked her teacher if she could collect the heart rates of the other students in her class. With the teacher’s help, the other sixth graders in her class found their heart rates and reported them to Mia. The following numbers are the resting heart rates (in beats per minute) for the 22 other students in Mia’s class.
89 87 85 84 90 79 83 85 86 88 84 81 88 85 83 83 86 82 83 86 82 84.

Exercises 1 – 10:

Exercise 1.
What was the heart rate for the student with the lowest heart rate?
Answer:
79 bpm

Exercise 2.
What was the heart rate for the student with the highest heart rate?
Answer:
90 bpm

Exercise 3.
How many students had a heart rate greater than 86 bpm?
Answer:
5

Exercise 4.
What fraction of students had a heart rate less than 82 bpm?
Answer:
\(\frac{2}{22}\) or \(\frac{1}{11}\)

Exercise 5.
What heart rate occurred most often?
Answer:
83 bpm

Exercise 6.
What heart rate describes the center of the data?
Answer:
85 bpm (Answers will vary, but student responses should be around 84 bpm or 85 bpm.)

Exercise 7.
Some students had heart rates that were unusual in that they were quite a bit higher or quite a bit lower than most other students’ heart rates. What heart rates would you consider unusual?
Answer:
Answers will vary and could include 79 bpm. 81 bpm. 87 bpm, 88 bpm,. 89 bpm. and/or 90 bpm.

Exercise 8.
If Mia’s teacher asked what the typical heart rate is for sixth graders in the class, what would you tell Mia’s teacher?
Answer:
Answers will vary, but expect answers between 82 bpm and 86 bpm.

Exercise 9.
Remember that Mia’s heart rate was 80 bpm. Add a dot for Mia’s heart rate to the dot plot in Example 1.
Answer:
Add o dot above 80 bpm on the number line.

Exercise 10.
How does Mia’s heart rate compare with the heart rates of the other students in the class?
Answer:
Her heart rate ¡s lower than all but one of the students.

Example 2: Seeing the Spread in Dot Plots.

Mia’s class collected data to answer several other questions about her class. After collecting the data, they drew dot
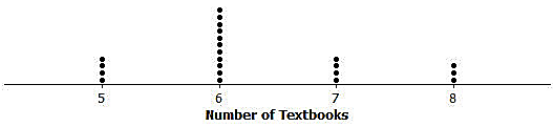
plots of their findings. One student collected data to answer the question: How many textbooks are in the desks or lockers of sixth graders? She made the following dot plot, not including her data.

Dot Plot of Number of Textbooks
Eureka Math Grade 6 Module 6 Lesson 2 Example Answer Key 1

Another student in Mia’s class wanted to ask the question: How tall are the sixth graders in our class?
This dot plot shows the heights of the sixth graders in Mia’s class, not including the datum for the student conducting the
survey.
Dot Plot of Height
Eureka Math Grade 6 Module 6 Lesson 2 Example Answer Key 2

Exercises 11 – 14:

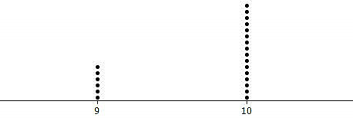
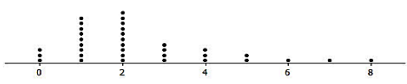
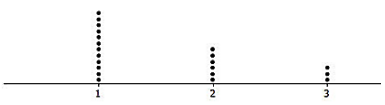
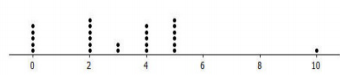
Below are four statistical questions and four different dot plots of data collected to answer these questions. Match each statistical question with the appropriate dot plot, and explain each choice.

Statistical Questions:

Exercise 11.
What are the ages of fourth-graders in our school?
Answer:
Dot plot A because most fourth-graders are around 9 or 10 years old.

Exercise 12.
What are the heights of the players on the eighth-grade boys’ basketball team?
Answer:
Dot plot D because the players on an eighth-grade basketball team can vary in height. Generally, there ¡s a tall
player (73 inches), while most others are between 5 feet, or 60 inches, and 5 feet 4 inches, or 64 inches.

Exercise 13.
How many hours of W do sixth graders in our class watch on a school night?
Answer:
Dot plot B; explanations will vary. For example, a student might say, “I think a few of the students may watch a lot
of W. Most students watch two hours or less.”

Exercise 14.
How many different languages do students ¡n our class speak?

Eureka Math Grade 6 Module 6 Lesson 2 Example Answer Key 3

Eureka Math Grade 6 Module 6 Lesson 2 Example Answer Key 4

Eureka Math Grade 6 Module 6 Lesson 2 Example Answer Key 5

Eureka Math Grade 6 Module 6 Lesson 2 Example Answer Key 6

Answer:
Dot plot C because most students know one language, English. Many students in our class also study another language or live in an environment where their families speak another language.

Eureka Math Grade 6 Module 6 Lesson 2 Problem Set Answer Key

Question 1.
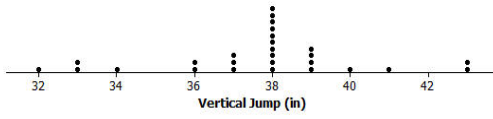
The dot plot below shows the vertical jump height (in inches) of some NBA players. A vertical jump height is how high a player can jump from a standstill.

Dot Plot of Vertical Jump
Eureka Math Grade 6 Module 6 Lesson 2 Problem Set Answer Key 7

a. What statistical question do you think could be answered using these data?
Answer:
What are the vertical jump heights of NBA players?

b. What was the highest vertical jump by a player?
Answer:
43 inches

c. What was the lowest vertical jump by a player?
Answer:
32 inches

d. What is the most common vertical jump height (the height that occurred most often)?
Answer:
38 inches

e. How many players jumped the most common vertical jump height?
Answer:
10

f. How many players jumped higher than 40 inches?
Answer:
3

g. Another NBA player jumped 33 inches. Add a dot for this player on the dot plot. How does this player compare with the other players?
Answer:
Add another dot above 33. This player jumped the same os two other players and jumped higher than only
one player.

Question 2.
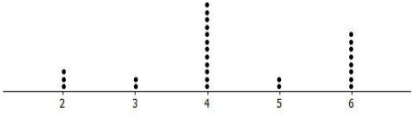
Below are two statistical questions and two different dot plots of data collected to answer these questions. Match each statistical question with its dot plot, and explain each choice.
Statistical Questions:

a. What is the number of fish (if any) that students in a class have in an aquarium at their homes?
Answer:
A; some students may not have any fish (O from the dot plot), while another student has 10 fish.

b. How many days out of the week do the children on my street go to the playground?
Dot Plot A
Eureka Math Grade 6 Module 6 Lesson 2 Problem Set Answer Key 8

Dot Plot B
Eureka Math Grade 6 Module 6 Lesson 2 Problem Set Answer Key 9
Answer:
B; the dot plot displays the values 2, 3, 4, 5, and 6, which are all reasonable within the context of the question.

Question 3.
Read each of the following statistical questions. Write a description of what the dot plot of the data collected to
answer the question might look like. Your description should include a description of the spread of the data and the center of the data.

a. What is the number of hours sixth graders are in school during a typical school day?
Answer:
Most students are in school for the same number of hours, so the spread would be smalL Differences may exist for those students who might have doctor’s appointments or who participate in a club or an afterschool activity. Student responses vary based on their estimates of the number of hours students spend in schooL

b. What is the number of video games owned by the sixth graders in our class?
Answer:
These data would have a very big spread. Some students might have no video games, while others could have a large number of games. A typical value of 5 (or something similar) would identify a center. In this case, the center is based on the number most commonly reported by students.

Eureka Math Grade 6 Module 6 Lesson 2 Exit Ticket Answer Key

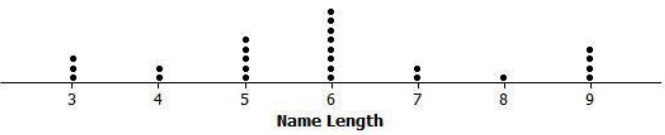
A sixth-grade class collected data on the number of letters in the first names (name lengths) of all the students in class. Here is the dot plot of the data they collected:
Eureka Math Grade 6 Module 6 Lesson 2 Exit Ticket Answer Key 10

Question 1.
How many students are in the class?
Answer:
There are 25 students in the class.

Question 2.
What is the shortest name length?
Answer:
The shortest name length is 3 letters.

Question 3.
What is the longest name length?
Answer:
The longest name length is 9 letters.

Question 4.
What name length occurs most often?
Answer:
The most common name length is 6 letters.

Question 5.
What name length describes the center of the data?
Answer:
The name length that describes the center of the data is 6 letters. (Answers may vary, but student responses should be around 6.)

Eureka Math Grade 6 Module 1 Lesson 23 Answer Key

Engage NY Eureka Math 6th Grade Module 1 Lesson 23 Answer Key

Eureka Math Grade 6 Module 1 Lesson 23 Example Answer Key

Example 1: Fresh-Cut Grass
Suppose that on a Saturday morning you can cut 3 lawns in 5 hours, and your friend can cut 5 lawns in 8 hours. Who is cutting lawns at a faster rate?
Eureka Math Grade 6 Module 1 Lesson 23 Example Answer Key 1
Answer:
\(\frac{24}{40}<\frac{25}{40}\) My friend is a little faster but only \(\frac{1}{40}\) of a lawn per hour, so it is very close. The unit rates have corresponding decimals 0.6 and 0.625.

Example 2: Restaurant Advertising
Eureka Math Grade 6 Module 1 Lesson 23 Example Answer Key 2
Answer:
Eureka Math Grade 6 Module 1 Lesson 23 Example Answer Key 3

Example 3: Survival of the Fittest
Eureka Math Grade 6 Module 1 Lesson 23 Example Answer Key 4
Answer:
Eureka Math Grade 6 Module 1 Lesson 23 Example Answer Key 5
The cheetah runs faster.

Example 4: Flying Fingers
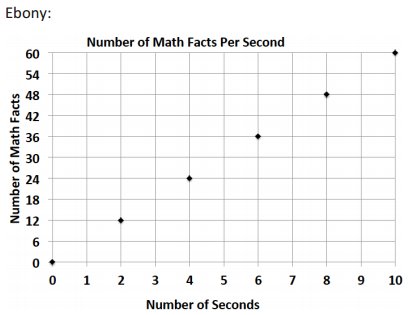
Eureka Math Grade 6 Module 1 Lesson 23 Example Answer Key 6
Answer:
Eureka Math Grade 6 Module 1 Lesson 23 Example Answer Key 7

Eureka Math Grade 6 Module 1 Lesson 23 Problem Set Answer Key

Question 1.
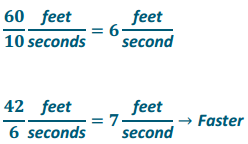
Who walks at a faster rate: someone who walks 60 feet in 10 seconds or someone who walks 42 feet in 6 seconds?
Answer:
Eureka Math Grade 6 Module 1 Lesson 23 Problem Set Answer Key 8

Question 2.
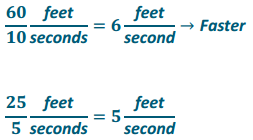
Who walks at a faster rate: someone who walks 60 feet in 10 seconds or someone who takes 5 seconds to walk 25 feet? Review the lesson summary before answering.
Answer:
Eureka Math Grade 6 Module 1 Lesson 23 Problem Set Answer Key 9

Question 3.
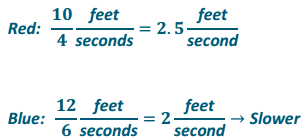
Which parachute has a slower decent: a red parachute that falls 10 feet in 4 seconds or a blue parachute that falls 12 feet in 6 seconds?
Answer:
Eureka Math Grade 6 Module 1 Lesson 23 Problem Set Answer Key 10

Question 4.
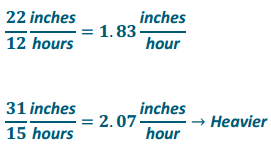
During the winter of 2012 – 2013, Buffalo, New York received 22 inches of snow in 12 hours. Oswego, New York received 31 inches of snow over a 15-hour period. Which city had a heavier snowfall rate? Round your answers to the nearest hundredth.
Answer:
Eureka Math Grade 6 Module 1 Lesson 23 Problem Set Answer Key 11

Question 5.
A striped marlin can swim at a rate of 70 miles per hour. Is this a faster or slower rate than a sailfish, which takes 30 minutes to swim 40 miles?
Answer:
Marlin: 70 mph → Slower

Salfish:
Eureka Math Grade 6 Module 1 Lesson 23 Problem Set Answer Key 12

Question 6.
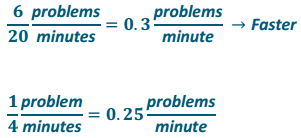
One math student, John, can solve 6 math problems in 20 minutes while another student, Juaquine, can solve the same 6 math problems at a rate of 1 problem per 4 minutes. Who works faster?
Answer:
Eureka Math Grade 6 Module 1 Lesson 23 Problem Set Answer Key 13

Eureka Math Grade 6 Module 1 Lesson 23 Exit Ticket Answer Key

Question 1.
A sixth-grade math teacher can grade 25 homework assignments in 20 minutes.
Is he working at a faster rate or slower rate than grading 36 homework assignments in 30 minutes?
Answer:
Eureka Math Grade 6 Module 1 Lesson 23 Exit Ticket Answer Key 14
It is faster to grade 25 assignments in 20 minutes.

Eureka Math Grade 6 Module 6 Lesson 1 Answer Key

Engage NY Eureka Math Grade 6 Module 6 Lesson 1 Answer Key

Eureka Math Grade 6 Module 6 Lesson 1 Example Answer Key

Example 1: Using Data to Answer Questions

Honeybees are important because they produce honey and pollinate plants. Since 2007, there has been a decline in the honeybee population in the United States. Honeybees live in hives, and a beekeeper in Wisconsin notices that this year, he has 5 fewer hives of bees than last year. He wonders if other beekeepers in Wisconsin are also losing hives.

He decides to survey other beekeepers and ask them if they have fewer hives this year than last year, and if so, how many fewer. He then uses the data to conclude that most beekeepers have fewer hives this year than last and that a typical decrease is about 4 hives.

Statistics is about using data to answer questions. In this module, you will use the following four steps in your work with data:

Step 1: Pose a question that can be answered by data.
Step 2: Determine a plan to collect the data.
Step 3: Summarize the data with graphs and numerical summaries.
Step 4: Answer the question posed in Step 1 using the data and summaries.

You will be guided through this process as you study these lessons. This first lesson is about the first step: What is a
statistical question, and what does it mean that a question can be answered by data?

Question 1.
What questions was the beekeeper trying to answer?
Answer:
The beekeeper wanted to know if beekeepers have fewer hives this year than last year. The beekeeper also wanted to know about how many fewer hives beekeepers have this year.

Question 2.
Did the beekeeper collect data to answer his questions?
Yes. He collected data on whether there were fewer hives this year and on how many fewer hives there were.

Question 3.
What did the beekeeper conclude?
Answer:
The beekeeper concluded that most beekeepers had fewer hives this year and that a typical decrease was about 4 hives.

Example 2: What is a Statistical Question?

Jerome, a sixth grader at Roosevelt Middle School, is a huge baseball fan. He loves to collect baseball cards. He has
cards of current players and of players from past baseball seasons. With his teacher’s permission, Jerome brought his baseball card collection to school. Each card has a picture of a current or past major league baseball player, along with information about the player. When he placed his cards out for the other students to see, they asked Jerome all sorts of questions about his cards. Some asked:

1. What is Jerome’s favorite card?
2. What is the typical cost of a card in Jerome’s collection? For example, what is the average cost of a card?
3. Are more of Jerome’s cards for current players or for past players?
4. Which card is the newest card in Jerome’s collection?

Then, consider the questions posed in Example 2, and ask students the following:

Question 1.
Which of these questions do you think might be statistical questions?
Answer:
Answers will vary. Some students do not know how to answer this question, but some may go back to
the definition of Step 1 in the process described earlier to look for questions that can be answered by
data. Even so, they still might think at this point that all of the questions are statistical questions.

Question 2.
What do you think I mean when I say a statistical question?
Answer:
Answers will vary. If no one relates the idea oía statistical question to the need for data, consider asking students to go back and look at the four-step process described earlier in this lesson.

Students do not yet understand what a statistical question is. Allow them to discuss and make conjectures about what it might mean before guiding them to the following:

1. A statistical question is one that can be answered with data and for which it is anticipated that the data
(information) collected to answer the question will vary.
2. The second and third questions are statistical questions because the data collected to answer the questions
would vary. To decide on a typical value (i.e., to describe what is typical for values in a data set using a single
number) for the cost of a card, you would collect data on what each card cost.

You would expect variability in the costs because some cards probably cost more than others. For the third question, you would need to collect data on whether or not each card was for a current player or for a past player. There would be variability in the data collected because some cards would be for current players, and some would be for past players.

The first question —”What is Jerome’s favorite card?”— is not a statistical question because there is no variability in the data collected to answer this question. There is only one data value and no variability. The same is true for the fourth question.

Convey the main idea that a question is statistical if it can be answered with data that vary. Point out that the concept of variability in the data means that not all data values have the same value.

The question “How old am I?” is not a statistical question because it is not answered by collecting data that
vary. The question “How old are the students in my school? is a statistical question because to answer it, you would collect data on the ages of students at the school, and the ages will vary—not all students are the same
age.

Would the following questions be answered by collecting data that vary?

Question 1.
How tall is your sixth-grade math teacher?
Answer:
This question would not be answered by collecting dato that vary because my sixth-grade moth teacher can only be one height.

Question 2.
What is your handspan (measured from the tip of the thumb to the tip of the small finger)?
Answer:
This question is not a statistical question because I would just measure my handspon. It would not be answered by collecting dota that vary.

Question 3.
Which of these data sets would have the most variability?
Answer:
The number of minutes students in your class spend getting ready for school or the number of pockets on the
clothes of students in your class.

The number of minutes students spend getting ready for school would vary the most because some students take a long time to get ready, and some students only require o short time to get ready for school. The number of pockets will vary from student to student, but most values will be 0, 1, or 2.

After arriving at this understanding as a class, write the informal definition of statistical question on the board so that students may refer to it for the remainder of the class.

Example 3: Types of Data

We use two types of data to answer statistical questions: numerical data and categorical data. If you recorded the ages of 25 baseball cards, we would have numerical data. Each value in a numerical data set is a number. If we recorded the team of the featured player for each of 25 baseball cards, you would have categorical data. Although you still have 25 data values, the data values are not numbers. They would be team names, which you can think of as categories.

Question 1.
What are other examples of categorical data?
Answer:
Answers will vary. Eye color, the month in which you were born, and your favorite subject are examples of categorical data.

Question 2.
What are other examples of numerical data?
Answer:
Answers will vary. Height, number of pets, and minutes to get to school are all examples of numerical data.

To help students distinguish between the two data types, encourage them to think of possible data values. If the
possible data values are words or categories, then the variable is categorical.

Suppose that you collected data on the following. What are some of the possible values that you might get?
1. Eye color
2. Favorite TV show
3. Amount of rain thotfell dunng each of 20 storms
4. High temperatures for each of 12 days

Eureka Math Grade 6 Module 6 Lesson 1 Exercise Answer Key

Exercise 1.
For each of the following, determine whether or not the question is a statistical question. Give a reason for your
answer.

a. Who is my favorite movie star?
Answer:
This is not a statistical question because I only have one age at the time the question is asked.

b. What are the favorite colors of sixth graders in my school?
Answer:
This is a statistical question because to answer this question, you would collect data by asking students about their favorite colors, and there would be variability in the data. The favorite color would not be the same for every student.

c. How many years have students in my school’s band or orchestra played an instrument?
Answer:
This is a statistical question because to answer this question, you would collect data by asking students in the band about how many years they have played an instrument, and there would be variability in the data. The number of years would not be the same for every student.

d. What is the favorite subject of sixth graders at my school?
Answer:
This is a statistical question because to answer this question, you would collect data by asking students about their favorite subjects, and there would be variability in the data. The favorite subject would not be the same for every student.

e. How many brothers and sisters does my best friend have?
Answer:
This is not a statistical question because it is not answered by collecting data that vary.

Exercise 2.
Explain why each of the following questions is not a statistical question.

a. How old am I?
Answer:
This is not a statistical question because I only have one age at the time the question is asked.

b. What’s my favorite color?
Answer:
This is not a statistical question because it is not answered by data that vary. I only have one favorite color.

c. How old is the principal at our school?
Answer:
This is not a statistical question because the principal has just one age at the time I ask the principal’s age. Therefore, the question is not answered by data that vary.

Exercise 3.
Ronnie, a sixth grader, wanted to find out if he lived the farthest from school. Write a statistical question that would help Ronnie find the answer.
Answer:
Answers will vary. One possible answer is, “What is a typical distance from home to school (in miles) for students at my school?”

Exercise 4.
Write a statistical question that can be answered by collecting data from students in your class.
Answer:
Answers will vary. For example, “What is the typical number of pets owned by students in my class?” or “How many hours each day do students in my class play video games?”

Exercise 5.
Change the following question to make it a statistical question: How old is my math teacher?
Answer:
What is a typical age for teachers at my school?

Exercises 6-7:

Exercise 6.
Identify each of the following data sets as categorical (C) or numerical (N).

a. Heights of 20 sixth graders.
Answer:
N

b. Favorite flavor of ice cream for each of 10 sixth graders.
Answer:
C
c. Hours of sleep on a school night for each of 30 sixth graders.
Answer:
N

d. Type of beverage drunk at lunch for each of 15 sixth graders.
Answer:
C

e. Eye color for each of 30 sixth graders.
Answer:
C

f. Number of pencils in the desk of each of 15 sixth graders.
Answer:
N

Exercise 7.
For each of the following statistical questions, identify whether the data Jerome would collect to answer the question would be numerical or categorical. Explain your answer, and list four possible data values.

a. How old are the cards in the collection?
Answer:
The data are numerical data, as I anticipate the data will be numbers.
Possible data values: 2 years, 2\(\frac{1}{2}\) years, 4 years, 20 years

b. How much did the cards in the collection cost?
Answer:
The data are numerical data, as anticipate the data will be numbers.
Possible data values: $0.20, $1.50, $10.00, $35.00

c. Where did Jerome get the cards in the collection?
Answer:
The data are categorical, as I anticipate the dato will represent the names of places or people.
Possible data values: a store, a garage sale, from my brother, from a friend.

Eureka Math Grade 6 Module 6 Lesson 1 Problem Set Answer Key

Question 1.
For each of the following, determine whether the question is a statistical question. Give a reason for your answer.

a. How many letters are in my last name?
Answer:
This is not a statistical question because this question is not answered by collecting data that vary.

b. How many letters are in the last names of the students in my sixth-grade class?
Answer:
This is a statistical question because it would be answered by collecting data on name lengths, and there is variability in the lengths of the last names.

c. What are the colors of the shoes worn by students in my school?
Answer:
This is a statistical question because it would be answered by collecting data on shoe colors, and we expect variability in the colors.

d. What is the maximum number of feet that roller coasters drop during a ride?
Answer:
This is a statistical question because it would be answered by collecting data on the drop of roller coasters, and we expect variability in how many feet different roller coasters drop. They will not all be the same.

e. What are the heart rates of students in a sixth-grade class?
Answer:
This is a statistical question because it would be answered by collecting data on heart rates, and we expect variability. Not all sixth graders have exactly the same heart rate.

f. How many hours of sleep per night do sixth graders usually get when they have school the next day?
Answer:
This is a statistical question because it would be answered by collecting data on hours of sleep, and we do not expect that all sixth graders sleep the same number of hours

g. How many miles per gallon do compact cars get?
Answer:
This is a statistical question because it would be answered by collecting data on fuel efficiency, and we expect variability in miles per gallon from one car to another.

Question 2.
Identify each of the following data sets as categorical (C) or numerical (N). Explain your answer.

a. Arm spans of 12 sixth graders.
Answer:
N; the arm span can be measured as number of inches, for example, so the data set is numerical.

b. Number of languages spoken by each of 20 adults
Answer:
N; number of languages is clearly numerical

c. Favorite sport of each person in a group of 20 adults
Answer:
C; a sport falls into a category, such as “soccer” or “hockey.” Favorite sport is not measured numerically.

d. Number of pets for each of 40 third graders
Answer:
N; number of pets is clearly numerical.

e. Number of hours a week spent reading a book for a group of middle school students.
Answer:
N; number of hours is clearly numerical.

Question 3.
Rewrite each of the following questions as a statistical question.

a. How many pets does your teacher have?
Answer:
How many pets do teachers in our school have?

b. How many points did the high school soccer team score in its last game?
Answer:
What is a typical number of points scored by the high school soccer team in its games this season?

c. How many pages are in our math book?
Answer:
What is a typical number of pages for the books in the school library?

d. Can I do a handstand?
Answer:
Can most sixth graders do a handstand?

Question 4.
Write a statistical question that would be answered by collecting data from the sixth graders in your classroom.
Answer:
Answers will vary. Check to make sure the question would be answered by collecting data that vary.

Question 5.
Are the data you would collect to answer the question you wrote in Problem 2 categorical or numerical? Explain
your answer.
Answer:
Answers will vary. Check to make sure that the answer here is consistent with the statistical question from Problem 4. If the possible values for the data collected would be numerical, students should answer numerical here, but if the possible data values are categories rather than numbers, students should answer categorical.

Eureka Math Grade 6 Module 6 Lesson 1 Exit Ticket Answer Key

Question 1.
Indicate whether each of the following two questions is a statistical question. Explain why or why not.

a. How much does Susan’s dog weigh?
Answer:
This is not a statistical question. This question is not answered by collecting data that vary.

b. How much do the dogs belonging to students at our school weigh?
Answer:
This is a statistical question. This question would be answered by collecting data on weights of dogs. There is variability in these weights.

Question 2.
If you collected data on the weights of dogs, would the data be numerical or categorical? Explain how you know the data are numerical or categorical.
Answer:
The data collected would be numerical data because the weight values are numbers.

Eureka Math Grade 7 Module 3 Lesson 3 Answer Key

Engage NY Eureka Math 7th Grade Module 3 Lesson 3 Answer Key

Eureka Math Grade 7 Module 3 Lesson 3 Example Answer Key

Example 1.
Represent 3+2 using a tape diagram.
Answer:
Engage NY Math 7th Grade Module 3 Lesson 3 Example Answer Key 4

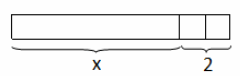
→ Now, let’s represent another expression, x+2. Make sure the units are the same size when you are drawing the known 2 units.

Represent x+2 using a tape diagram.
Engage NY Math 7th Grade Module 3 Lesson 3 Example Answer Key 5

→ Note the size of the units that represent 2 in the expression x+2. Using the size of these units, can you predict what value x represents?
→ Approximately six units

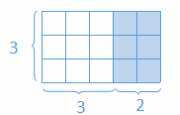
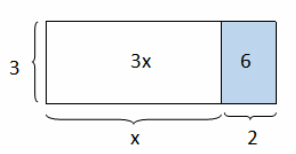
Draw a rectangular array for 3(3+2).
Engage NY Math 7th Grade Module 3 Lesson 3 Example Answer Key 6

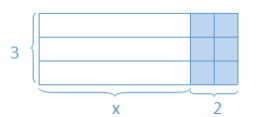
Then, have students draw a similar array for 3(x+2).

Draw an array for 3(x+2).
Answer:
Engage NY Math 7th Grade Module 3 Lesson 3 Example Answer Key 7

→ Determine the area of the shaded region.
→ 6
→ Determine the area of the unshaded region.
→ 3x
Record the areas of each region:
Engage NY Math 7th Grade Module 3 Lesson 3 Example Answer Key 8

Example 2.
Draw a tape diagram to represent each expression.
a. (x+y)+(x+y)+(x+y)
Answer:
Engage NY Math 7th Grade Module 3 Lesson 3 Example Answer Key 57

b. (x+x+x)+(y+y+y)
Answer:
Engage NY Math 7th Grade Module 3 Lesson 3 Example Answer Key 58

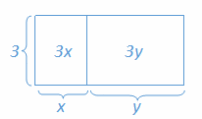
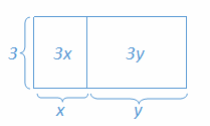
c. 3x+3y
Answer:
Engage NY Math 7th Grade Module 3 Lesson 3 Example Answer Key 59

d. 3(x+y)
Answer:
Engage NY Math 7th Grade Module 3 Lesson 3 Example Answer Key 60

Ask students to explain to their neighbors why all of these expressions are equivalent.
Discuss how to rearrange the units representing x and y into each of the configurations on the previous page.
→ What can we conclude about all of these expressions?
→ They are all equivalent.
→ How does 3(x+y)=3x+3y?
→ Three groups of (x+y) is the same as multiplying 3 with the x and the y.
→ How do you know the three representations of the expressions are equivalent?
→ The arithmetic, algebraic, and graphic representations are equivalent. Problem (c) is the standard form of problems (b) and (d). Problem (a) is the equivalent of problems (b) and (c) before the distributive property is applied. Problem (b) is the expanded form before collecting like terms.
→ Under which conditions would each representation be most useful?
→ Either 3(x+y) or 3x+3y because it is clear to see that there are 3 groups of (x+y), which is the product of the sum of x and y, or that the second expression is the sum of 3x and 3y.
→ Which model best represents the distributive property?
Engage NY Math 7th Grade Module 3 Lesson 3 Example Answer Key 601
Summarize the distributive property.

Example 3.
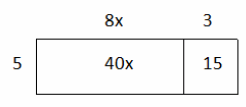
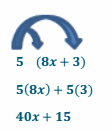
Find an equivalent expression by modeling with a rectangular array and applying the distributive property to the expression 5(8x+3).
Engage NY Math 7th Grade Module 3 Lesson 3 Example Answer Key 62
Answer:
Engage NY Math 7th Grade Module 3 Lesson 3 Example Answer Key 63
Substitute given numerical value to demonstrate equivalency. Let x=2
5(8x+3)=5 (8(2)+3)=5(16+3)=5(19)=95
40x+15=40(2)+15=80+15=95
Both equal 95, so the expressions are equal.

Example 4.
Rewrite the expression (6x+15)÷3 in standard form using the distributive property.
Answer:
(6x+15)×\(\frac{1}{3}\)
(6x) \(\frac{1}{3}\)+(15) \(\frac{1}{3}\)
2x+5

→ How can we rewrite the expression so that the distributive property can be used?
→ We can change from dividing by 3 to multiplying by \(\frac{1}{3}\).

Example 5.
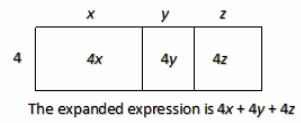
Expand the expression 4(x+y+z).
Answer:
Engage NY Math 7th Grade Module 3 Lesson 3 Example Answer Key 68

Example 6.
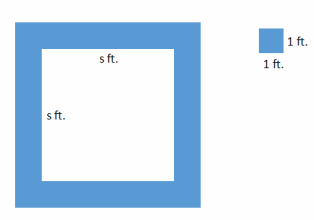
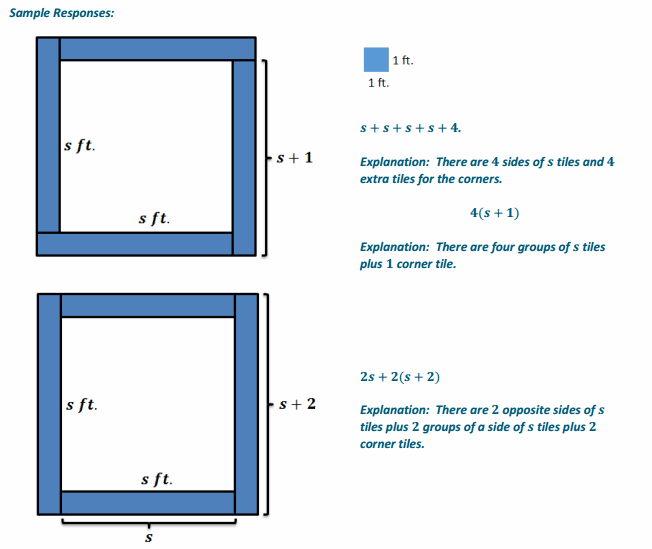
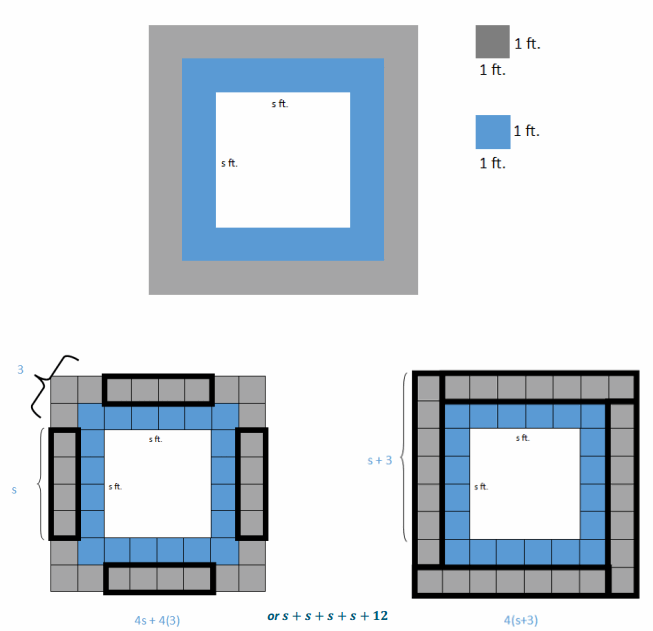
A square fountain area with side length s ft. is bordered by a single row of square tiles as shown. Express the total number of tiles needed in terms of s three different ways.
Engage NY Math 7th Grade Module 3 Lesson 3 Example Answer Key 69
Answer:
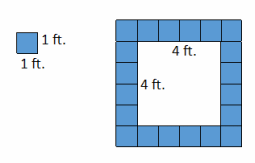
→ What if s=4? How many tiles would you need to border the fountain?
→ I would need 20 tiles to border the fountain—four for each side and one for each corner.
Engage NY Math 7th Grade Module 3 Lesson 3 Example Answer Key 70
→ What if s=2? How many tiles would you need to border the fountain?
→ I would need 12 tiles to border the fountain—two for each side and one for each corner.
→ What pattern or generalization do you notice?
→ Answers may vary. Sample response: There is one tile for each corner and four times the number of tiles to fit one side length.
After using numerical values, allow students two minutes to create as many expressions as they can think of to find the total number of tiles in the border in terms of s. Reconvene by asking students to share their expressions with the class from their seat.
→ Which expressions would you use and why?
→ Although all the expressions are equivalent, 4(s+1), or 4s+4, is useful because it is the most simplified, concise form. It is in standard form with all like terms collected.
Engage NY Math 7th Grade Module 3 Lesson 3 Example Answer Key 71

Eureka Math Grade 7 Module 3 Lesson 3 Opening Exercise Answer Key

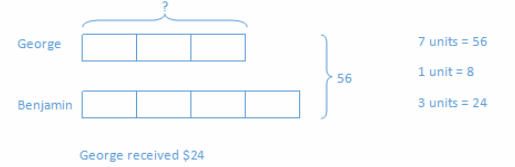
Solve the problem using a tape diagram. A sum of money was shared between George and Benjamin in a ratio of 3∶4.
If the sum of money was $56.00, how much did George get?
Answer:
Have students label one unit as x in the diagram.
Eureka Math Grade 7 Module 3 Lesson 3 Opening Exercise Answer Key 2
→ What does the rectangle labeled x represent?
→ $8.00

Eureka Math Grade 7 Module 3 Lesson 3 Exercise Answer Key

Exercise 1
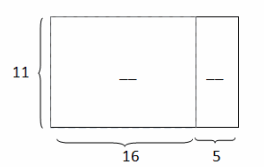
Determine the area of each region using the distributive property.
Eureka Math Grade 7 Module 3 Lesson 3 Exercise Answer Key 9
Answer:
176, 55

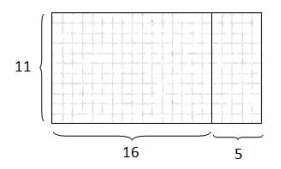
Draw in the units in the diagram for students.
Eureka Math Grade 7 Module 3 Lesson 3 Exercise Answer Key 56

→ Is it easier to just imagine the 176 and 55 square units?
→ Yes

Exercise 2.
For parts (a) and (b), draw an array for each expression and apply the distributive property to expand each expression. Substitute the given numerical values to demonstrate equivalency.
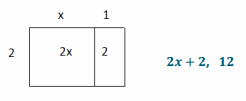
a. 2(x+1), x=5
Answer:
Eureka Math Grade 7 Module 3 Lesson 3 Exercise Answer Key 64

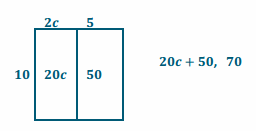
b. 10(2c+5), c=1
Answer:
Eureka Math Grade 7 Module 3 Lesson 3 Exercise Answer Key 67

For parts (c) and (d), apply the distributive property. Substitute the given numerical values to demonstrate equivalency.

c. 3(4f-1), f=2
Answer:
12f-3, 21

d. 9(-3r-11), r=10
Answer:
-27r-99, -369

Exercise 3.
Rewrite the expressions in standard form.
a. (2b+12)÷2
Answer:
\(\frac{1}{2}\) (2b+12)
\(\frac{1}{2}\) (2b)+\(\frac{1}{2}\)(12)
b+6

b. (20r-8)÷4
\(\frac{1}{4}\) (20r-8)
\(\frac{1}{4}\) (20r)-\(\frac{1}{4}\)(8)
5r-2

c. (49g-7)÷7
\(\frac{1}{7}\) (49g-7)
\(\frac{1}{7}\) (49g)-\(\frac{1}{7}\)(7)
7g-1

Exercise 4.
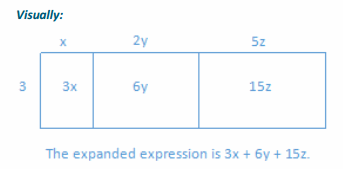
Expand the expression from a product to a sum by removing grouping symbols using an area model and the repeated use of the distributive property: 3(x+2y+5z).
Answer:
Repeated use of the distributive property: Visually:
3(x+2y+5z)
3∙x+3∙2y+3∙5z
3x+3∙2∙y+3∙5∙z
3x+6y+15z
Eureka Math Grade 7 Module 3 Lesson 3 Exercise Answer Key 72

Eureka Math Grade 7 Module 3 Lesson 3 Problem Set Answer Key

Question 1.
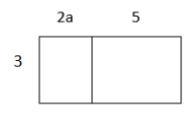
a. Write two equivalent expressions that represent the rectangular array below.
Eureka Math Grade 7 Module 3 Lesson 3 Problem Set Answer Key 80
Answer:
3(2a+5) or 6a+15

b. Verify informally that the two expressions are equivalent using substitution.
Answer:
Let a=4.
3(2a+5)
3(2(4)+5)
3(8+5)
3(13)
39
6a+15
6(4)+15
24+15
39

Question 2.
You and your friend made up a basketball shooting game. Every shot made from the free throw line is worth 3 points, and every shot made from the half-court mark is worth 6 points. Write an equation that represents the total number of points, P, if f represents the number of shots made from the free throw line, and h represents the number of shots made from half-court. Explain the equation in words.
Answer:
P=3f+6h or P=3(f+2h)
The total number of points can be determined by multiplying each free throw shot by 3 and then adding that to the product of each half-court shot multiplied by 6.
The total number of points can also be determined by adding the number of free throw shots to twice the number of half-court shots and then multiplying the sum by three.

Question 3.
Use a rectangular array to write the products in standard form.
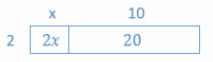
a. 2(x+10)
Answer:
Eureka Math Grade 7 Module 3 Lesson 3 Problem Set Answer Key 81
2x+20

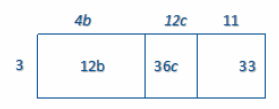
b. 3(4b+12c+11)
Answer:
Eureka Math Grade 7 Module 3 Lesson 3 Problem Set Answer Key 42
12b+36c+33

Question 4.
Use the distributive property to write the products in standard form.
a. 3(2x-1)
Answer:
6x-3

b. 10(b+4c)
Answer:
10b+40c

c. 9(g-5h)
Answer:
9g-45h

d. 7(4n-5m-2)
Answer:
28n-35m-14

e. a(b+c+1)
Answer:
ab+ac+a

f. (8j-3l+9)6
Answer:
48j-18l+54

g. (40s+100t)÷10
Answer:
4s+10t

h. (48p+24)÷6
Answer:
8p+4

i. (2b+12)÷2
Answer:
b+6

j. (20r-8)÷4
Answer:
5r-2

k. (49g-7)÷7
Answer:
7g-1

l. (14g+22h)÷\(\frac{1}{2}\)
Answer:
28g+44h

Question 5.
Write the expression in standard form by expanding and collecting like terms.
a. 4(8m-7n)+6(3n-4m)
Answer:
8m-10n

b. 9(r-s)+5(2r-2s)
Answer:
19r-19s

c. 12(1-3g)+8(g+f)
Answer:
-28g+8f+12

Eureka Math Grade 7 Module 3 Lesson 3 Exit Ticket Answer Key

A square fountain area with side length s ft. is bordered by two rows of square tiles along its perimeter as shown. Express the total number of grey tiles (the second border of tiles) needed in terms of s three different ways.
Answer:
Engage NY Math 7th Grade Module 3 Lesson 3 Exit Ticket Answer Key 73

Eureka Math Grade 6 Module 1 Lesson 28 Answer Key

Engage NY Eureka Math 6th Grade Module 1 Lesson 28 Answer Key

Eureka Math Grade 6 Module 1 Lesson 28 Example Answer Key

Example 1.
If an item is discounted 20%, the sale price is what percent of the original price?
Answer:
100 – 20 = 80
80%

If the original price of the item is $400, what is the dollar amount of the discount?
Answer:
20% = \(\frac{20}{100}=\frac{2}{10}\)
400 × \(\frac{2}{10}=\frac{800}{10}\) = $80
$80 discount

How much is the sale price?
Answer:
80% = \(\frac{80}{100}=\frac{8}{10}\)
400 × \(\frac{8}{10}=\frac{3200}{10}\) = $320, or 400 – 80 = $320
$320 sale price

Eureka Math Grade 6 Module 1 Lesson 28 Exercise Answer Key

Exercise 1.
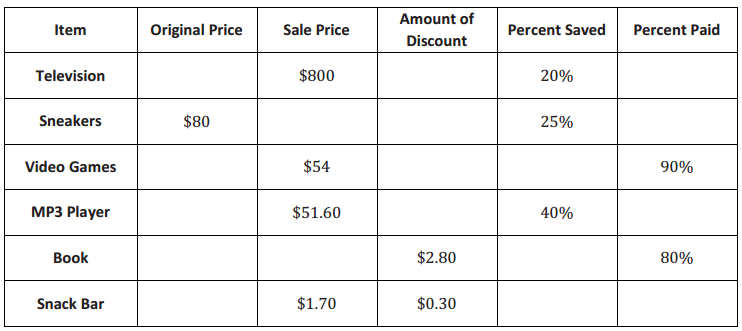
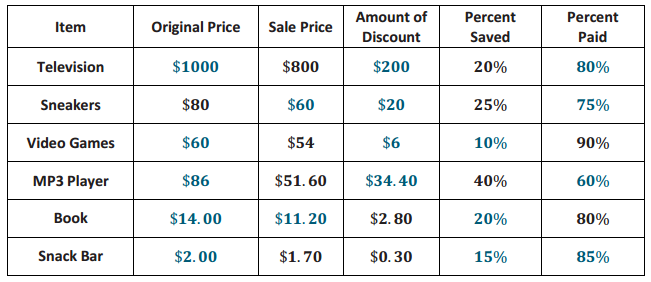
The following items were bought on sale. Complete the missing information in the table.
Eureka Math Grade 6 Module 1 Lesson 28 Exercise Answer Key 2
Answer:
Eureka Math Grade 6 Module 1 Lesson 28 Exercise Answer Key 2

Eureka Math Grade 6 Module 1 Lesson 28 Problem Set Answer Key

Question 1.
The Sparkling House Cleaning Company has cleaned 28 houses this week. If this number represents 40% of the total number of houses the company is contracted to clean, how many total houses will the company clean by the end of the week?
Answer:
70 houses

Question 2.
Joshua delivered 30 hives to the local fruit farm. If the farmer has paid to use 5% of the total number of Joshua’s hives, how many hives does Joshua have in all?
Answer:
600 hives

Eureka Math Grade 6 Module 1 Lesson 28 Exit Ticket Answer Key

Question 1.
Write one problem using a dollar amount of $420 and a percent of 40%. Provide the solution to your problem.
Answer:
Answers will vary.
Problems that include $420 as the sale price should include $700 as the original. Because 40% is saved, 60% is paid of the original. Therefore, the original price is $700.

Problems that include $420 as the original price and a 40% discount should include $252 as a sale price. Below is an example of a tape diagram that could be included In the solution.
Eureka Math Grade 6 Module 1 Lesson 28 Exit Ticket Answer Key 3

Question 2.
The sale price of an item is $160 after a 20% off discount. What was the original price of the item?
Answer:
Because the discount was 20%, the purchase price was 80% of the original.
80% = \(\frac{80}{100}=\frac{160}{200}\)
The original price was $200

Eureka Math Grade 6 Module 1 Lesson 27 Answer Key

Engage NY Eureka Math 6th Grade Module 1 Lesson 27 Answer Key

Eureka Math Grade 6 Module 1 Lesson 27 Example Answer Key

Example 1.
Solve the following three problems.
Write the words PERCENT, WHOLE, or PART under each problem to show which piece you were solving for.
60% of 300 = ____________            60% of ____________ = 300           60 out of 300 = ____________ %

____________________                       ____________________                      ____________________
Answer:
Eureka Math Grade 6 Module 1 Lesson 27 Example Answer Key 1

How did your solving method differ with each problem?
Answer:
Solutions will vary. A possible answer may include: When solving for the part, I need to find the missing number in the numerator. When solving for the whole, I solve for the denominator. When I solve for the percent, I need to find the numerator when the denominator is 100.

Eureka Math Grade 6 Module 1 Lesson 27 Exercise Answer Key

Exercise 1.
Use models, such as 10 × 10 grids, ratio tables, tape diagrams, or double number line diagrams, to solve the following situation.
Priya is doing her back-to-school shopping. Calculate all of the missing values in the table below, rounding to the nearest penny, and calculate the total amount Priya will spend on her outfit after she receives the indicated discounts.
Eureka Math Grade 6 Module 1 Lesson 27 Exercise Answer Key 2
Answer:
Eureka Math Grade 6 Module 1 Lesson 27 Exercise Answer Key 3

What is the total cost of Priya’s outfit?
Answer:
Shirt 25% = \(\frac{25}{100}=\frac{1}{4}=\frac{11}{44}\) The discount is $11. The cost of the shirt is $33 because $44 – $11 = $33.

Pants 30% = \(\frac{30}{100}=\frac{15}{50}\) The original price is $50. The price of the pants is $35 because $50 – $15 = $35.

Shoes 15% = \(\frac{15}{100}=\frac{3}{20}=\frac{9}{60}\) The original price is $60. The cost of the shoes is $51 because $60 – $9 = $51.

Necklace 10% = \(\frac{1}{10}=\frac{2}{20}\) The discount is $2. The cost of the necklace is $18 because $20 – $2 = $18.

Sweater 20% = \(\frac{20}{100}=\frac{1}{5}=\frac{7}{35}\) The original price is $35. The cost of the sweater is $28 because $35 – $7 = $28.
The total outfit would cost the following: $33 + $35 + $51 + $18 + $28 = $165.

Eureka Math Grade 6 Module 1 Lesson 27 Problem Set Answer Key

Question 1.
Mr. Yoshi has 75 papers. He graded 60 papers, and he had a student teacher grade the rest. What percent of the papers did each person grade?
Answer:
Mr. Yoshi graded 80% of the papers, and the student teacher graded 20%.

Question 2.
Mrs. Bennett has graded 20% of her 150 student’s papers. How many papers does she still need to finish grading?
Answer:
Mrs. Bennett has graded 30 papers. 150 – 30 = 120. Mrs. Bennett has 120 papers left to grade.


Eureka Math Grade 6 Module 1 Lesson 27 Exit Ticket Answer Key

Jane paid $40 for an item after she received a 20% discount. Jane’s friend says this means that the original price of the item was $48.

a. How do you think Jane’s friend arrived at this amount?
Answer:
Jane’s friend found that 20% of 40 is 8. Then she added $8 to the sale price: 40 + 8 = 48. Then she determined that the original amount was $48.

b. Is her friend correct? Why or why not?
Answer:
Jane’s friend was incorrect. Because Jane saved 20%, she paid 80% of the original amount, so that means that 40 is 80% of the original amount.
Eureka Math Grade 6 Module 1 Lesson 27 Exit Ticket Answer Key 4
The original amount of the item was $50.

Eureka Math Grade 6 Module 1 Lesson 26 Answer Key

Engage NY Eureka Math 6th Grade Module 1 Lesson 26 Answer Key

Eureka Math Grade 6 Module 1 Lesson 26 Example Answer Key

Example 1.
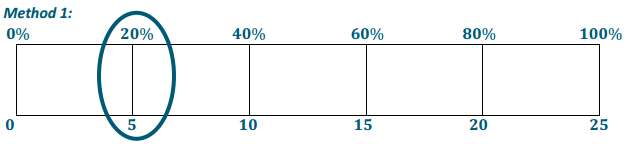
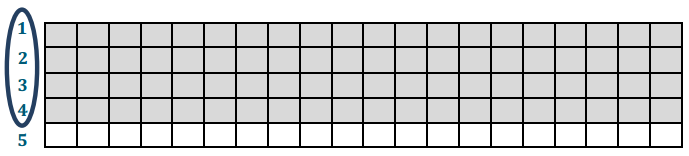
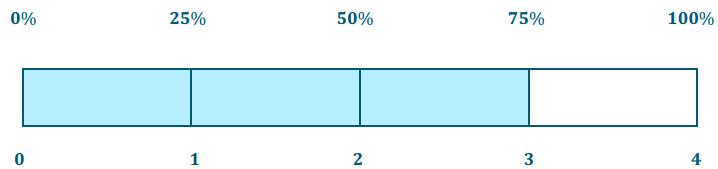
Five of the 25 girls on Alden Middle School’s soccer team are seventh-grade students. Find the percentage of seventh graders on the team. Show two different ways of solving for the answer. One of the methods must include a diagram or picture model.
Answer:
Eureka Math Grade 6 Module 1 Lesson 26 Example Answer Key 1

Method 2:
\(\frac{5}{25}=\frac{1}{5}=\frac{20}{100}\) = 20%

Example 2.
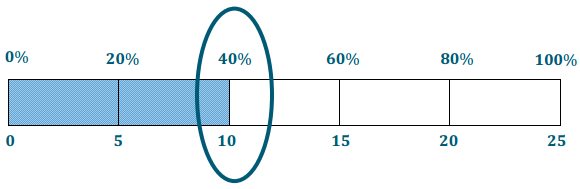
Of the 25 girls on the Alden Middle School soccer team, 40% also play on a travel team. How many of the girls on the middle school team also play on a travel team?
Answer:
One method: 40% = \(\frac{40}{100}=\frac{10}{25}\). Therefore, 10 of the 25 girls are also on the travel team.
Another method: Use of tape diagram shown below.
Eureka Math Grade 6 Module 1 Lesson 26 Example Answer Key 2
10 of the girls also play on a travel team.

Example 3
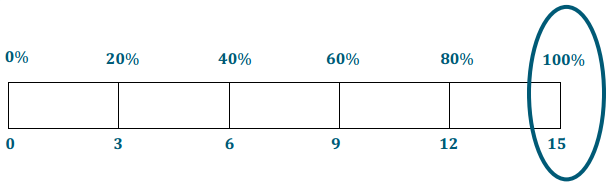
The Alden Middle School girls’ soccer team won 80% of its games this season. If the team won 12 games, how many names did it play? Solve the problem using at least two different methods.
Answer:
Method 1:
80% = \(\frac{80}{100}=\frac{8}{10}=\frac{4}{5}\)
\(\frac{4 \times 3 \rightarrow}{5 \times 3 \rightarrow}=\frac{12}{15}\)
15 total games

Method 2:
Eureka Math Grade 6 Module 1 Lesson 26 Example Answer Key 3
The girls played a total of 15 games.

Eureka Math Grade 6 Module 1 Lesson 26 Exercise Answer Key

Exercise 1.
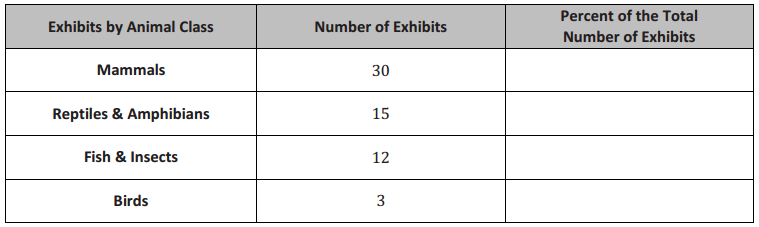
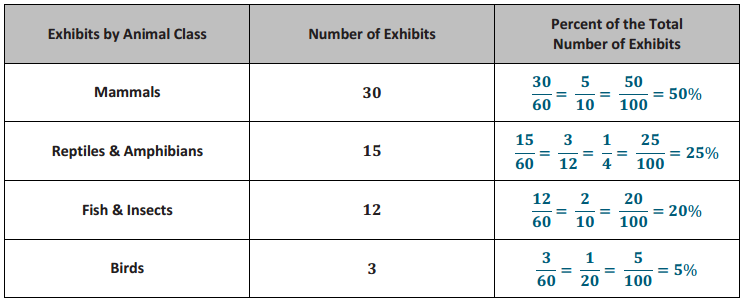
There are 60 animal exhibits at the local zoo. What percent of the zoo’s exhibits does each animal class represent?
Eureka Math Grade 6 Module 1 Lesson 26 Exercise Answer Key 4
Answer:
Eureka Math Grade 6 Module 1 Lesson 26 Exercise Answer Key 5

Exercise 2.
A sweater is regularly $32. It is 25% off the original price this week.
a. Would the amount the shopper saved be considered the part, whole, or percent?
Answer:
It would be the part because the $32 is the whole amount of the sweater, and we want to know the part that was saved.

b. How much would a shopper save by buying the sweater this week? Show two methods for finding your answer.
Answer:
Method 1:
25% = \(\frac{25}{100}=\frac{1}{4}\)
32 × \(\frac{1}{4}\) = $8 saved

Method 2:
Eureka Math Grade 6 Module 1 Lesson 26 Exercise Answer Key 6
The shopper would save $8.

Exercise 3.
A pair of jeans was 30% off the original price. The sale resulted in a $24 discount.
a. Is the original price of the jeans considered the whole, part, or percent?
Answer:
The original price is the whole.

b. What was the original cost of the jeans before the sale? Show two methods for finding your answer.
Answer:
Method 1:
30% = \(\frac{30}{100}=\frac{3}{10}\)
\(\frac{3 \times 8}{10 \times 8}=\frac{24}{80}\)
The original cost was $80.

Method 2:
Eureka Math Grade 6 Module 1 Lesson 26 Exercise Answer Key 7

Exercise 4.
Purchasing a TV that is 20% off will save $180.
a. Name the different parts with the words: PART, WHOLE, PERCENT.
Eureka Math Grade 6 Module 1 Lesson 26 Exercise Answer Key 8
Answer:
Eureka Math Grade 6 Module 1 Lesson 26 Exercise Answer Key 9

b. What was the original price of the TV? Show two methods for finding your answer.
Answer:
Method 1:
Eureka Math Grade 6 Module 1 Lesson 26 Exercise Answer Key 10

Method 2:
20% = \(\frac{20}{100}\)
\(\frac{20 \times 9}{100 \times 9}=\frac{180}{900}\)
The original price was $900.

Eureka Math Grade 6 Module 1 Lesson 26 Problem Set Answer Key

Question 1.
What is 15% of 60? Create a model to prove your answer.
Answer:
9

Question 2.
If 40% of a number is 56, what was the original number?
Answer:
140

Question 3.
In a 10 × 10 grid that represents 800, one square represents _____________ .
Answer:
In a 10 × 10 grid that represents 800, one square represents    8    .

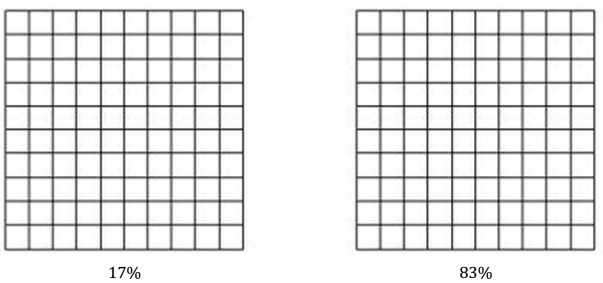
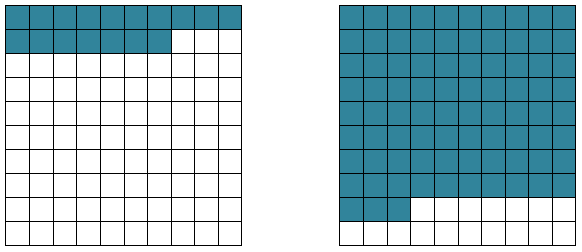
Use the grids below to represent 17% and 83% of 800.
Eureka Math Grade 6 Module 1 Lesson 26 Problem Set Answer Key 11
Answer:
Eureka Math Grade 6 Module 1 Lesson 26 Problem Set Answer Key 12

17% of 800 is _____________ .               83% of 800 is _____________ .
Answer:
17% of 800 is    136    .                       83% of 800 is   664    .

Eureka Math Grade 6 Module 1 Lesson 26 Exit Ticket Answer Key

Question 1.
Find 40% of 60 using two different strategies, one of which must include a pictorial model or diagram.
Answer:
40% of 60 40% = \(\frac{40}{100}=\frac{4}{10}=\frac{24}{60}\) 40% of 60 is 24
Eureka Math Grade 6 Module 1 Lesson 26 Exit Ticket Answer Key 13

Question 2.
15% of an amount is 30. Calculate the whole amount using two different strategies, one of which must include a pictorial model.
Answer:
15% = \(\frac{15}{100}=\frac{30}{200}\)
The whole quantity is 200
Eureka Math Grade 6 Module 1 Lesson 26 Exit Ticket Answer Key 14

Eureka Math Grade 6 Module 1 Lesson 25 Answer Key

Engage NY Eureka Math 6th Grade Module 1 Lesson 25 Answer Key

Eureka Math Grade 6 Module 1 Lesson 25 Example Answer Key

Example 1.
Eureka Math Grade 6 Module 1 Lesson 25 Example Answer Key 1
Sam says 50% of the vehicles are cars. Give three different reasons or models that prove or disprove Sam’s statement. Models can include tape diagrams, 10 × 10 grids, double number lines, etc.
Answer:
1. \(\frac{3}{5}=\frac{60}{100}\) → 60% are cars.
2. Eureka Math Grade 6 Module 1 Lesson 25 Example Answer Key 2
3. 50% = \(\frac{50}{100}=\frac{1}{2}\) 5 × \(\frac{1}{2}=\frac{5}{2}=2 \frac{1}{2}\) There are more than 2\(\frac{1}{2}\) cars.

1. How is the fraction of cars related to the percent?
Answer:
\(\frac{3}{5}\) is equal to \(\frac{60}{100}\). Since percents are out of 100, the two are equivalent.

2. Use a model to prove that the fraction and percent are equivalent.
Answer:
Eureka Math Grade 6 Module 1 Lesson 25 Example Answer Key 3

3. What other fractions or decimals also represent 60%?
Answer:
\(\frac{3}{5}=\frac{6}{10}=\frac{9}{15}=\frac{12}{20}=\frac{15}{25}\) = 0.6

Example 2.
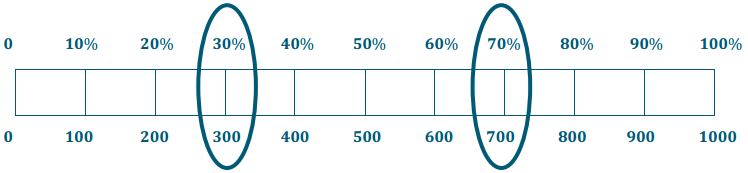
A survey was taken that asked participants whether or not they were happy with their job. An overall score was given. 300 of the participants were unhappy while 700 of the participants were happy with their job. Give a part-to-whole fraction for comparing happy participants to the whole. Then write a part-to-whole fraction of the unhappy participants to the whole. What percent were happy with their job, and what percent were unhappy with their job?

Eureka Math Grade 6 Module 1 Lesson 25 Example Answer Key 4
Answer:
Eureka Math Grade 6 Module 1 Lesson 25 Example Answer Key 5

Create a model to justify your answer.
Answer:
Eureka Math Grade 6 Module 1 Lesson 25 Example Answer Key 6

Eureka Math Grade 6 Module 1 Lesson 25 Exercise Answer Key

Exercise 1.
Renita claims that a score of 80% means that she answered \(\frac{4}{5}\) of the problems correctly. She drew the following picture to support her claim.:
Eureka Math Grade 6 Module 1 Lesson 25 Exercise Answer Key 7
Answer:
Eureka Math Grade 6 Module 1 Lesson 25 Exercise Answer Key 8

Is Renita correct?
Answer:
Yes

Why or why not?
Answer:
\(\frac{4}{5}=\frac{40}{50}=\frac{80}{100}\) → 80%

How could you change Renita’s picture to make it easier for Renita to see why she is correct or incorrect?
Answer:
I could change her picture so that there is a percent scale down the right side showing 20%, 40%, etc. I could also change the picture so that there are ten strips with eight shaded.

Exercise 2.
Use the diagram to answer the following questions.
Eureka Math Grade 6 Module 1 Lesson 25 Exercise Answer Key 9
80% is what fraction of the whole quantity?
Answer:
\(\frac{4}{5}\)

\(\frac{1}{5}\) is what percent of the whole quantity?
Answer:
20%

50% is what fraction of the whole quantity?
Answer:
\(\frac{2 \frac{1}{2}}{5}\) or \(\frac{2.5}{5}=\frac{25}{50}\)

1 is what percent of the whole quantity?
Answer:
1 = \(\frac{1}{5}\) This would be 100%

Exercise 3.
Maria completed \(\frac{3}{4}\) of her workday. Create a model that represents what percent of the workday Maria has worked.
Answer:
Eureka Math Grade 6 Module 1 Lesson 25 Exercise Answer Key 10
She has completed 75% of the workday.

What percent of her workday does she have left?
Answer:
25%

How does your model prove that your answer is correct?
Answer:
My model shows that \(\frac{3}{4}\) = 75% and that the \(\frac{1}{4}\) she has left is the same as 25%.

Exercise 4.
Matthew completed \(\frac{5}{8}\) of his workday. What decimal would also describe the portion of the workday he has finished?
Answer:
5 ÷ 8 = 0.625 or \(\frac{5}{8}\) of 100% = 62.5%

How can you use the decimal to get the percent of the workday Matthew has completed?
Answer:
\(\frac{5}{8}\) is the same as 0.625. This is 625 thousandths or \(\frac{625}{1,000}\). If I divide both the numerator and denominator by ten, I can see that \(\frac{625}{1000}=\frac{62.5}{100}\).

Exercise 5.
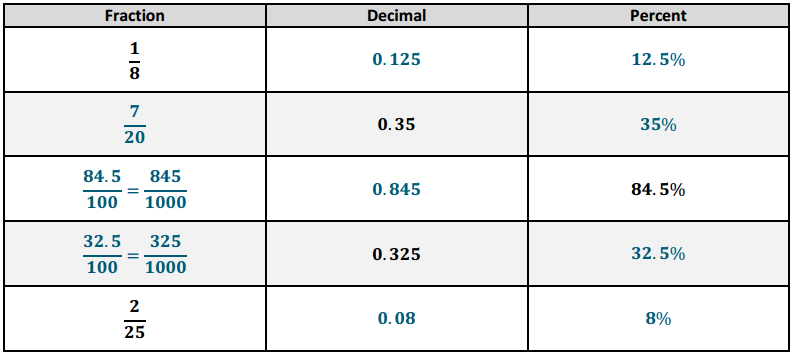
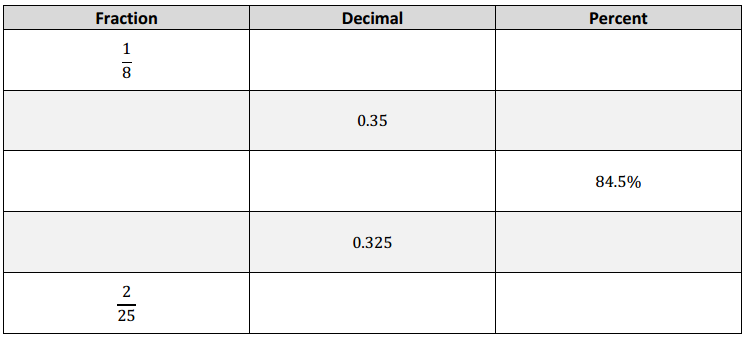
Complete the conversions from fraction to decimal to percent.
Eureka Math Grade 6 Module 1 Lesson 25 Exercise Answer Key 11
Answer:
Eureka Math Grade 6 Module 1 Lesson 25 Exercise Answer Key 12

Exercise 6.
Choose one of the rows from the conversion table in Exercise 5, and use models to prove your answers. (Models could include a 10 × 10 grid, a tape diagram, a double number line, etc.)
Answer:
Answers willl vary. One possible solution is shown:
Eureka Math Grade 6 Module 1 Lesson 25 Exercise Answer Key 13

Eureka Math Grade 6 Module 1 Lesson 25 Problem Set Answer Key

Question 1.
Use the 10 × 10 grid to express the fraction \(\frac{11}{20}\) as a percent.
Eureka Math Grade 6 Module 1 Lesson 25 Problem Set Answer Key 14
Answer:
Students should shade 55 of the squares in the grid. They might divide it into 5 sections of 20 each and shade in 11 of the 20.

Question 2.
Use a tape diagram to relate the fraction \(\frac{11}{20}\) to a percent.
Answer:
Answers will vary.
Eureka Math Grade 6 Module 1 Lesson 25 Problem Set Answer Key 15

Question 3.
How are the diagrams related?
Answer:
Both show that \(\frac{11}{20}\) is the same as \(\frac{55}{100}\).

Question 4.
What decimal is also related to the fraction?
Answer:
0.55

Question 5.
Which diagram is the most helpful for converting the fraction to a decimal? ________________ Explain why.
Answer:
Answers will vary according to student preferences.

Eureka Math Grade 6 Module 1 Lesson 25 Exit Ticket Answer Key

Show all the necessary work to support your answer.

Question 1.
Convert 0.3 to a fraction and a percent.
Answer:
\(\frac{3}{10}=\frac{30}{100}\), 30%

Question 2.
Convert 9% to a fraction and a decimal.
Answer:
\(\frac{9}{100}\), 0.09

Question 3.
Convert \(\frac{3}{8}\) to a decimal and a percent.
Answer:
0.375 = \(\frac{375}{1000}=\frac{37.5}{100}\) = 37.5%

Eureka Math Grade 6 Module 1 Lesson 20 Answer Key

Engage NY Eureka Math 6th Grade Module 1 Lesson 20 Answer Key

Eureka Math Grade 6 Module 1 Lesson 20 Example Answer Key

Example 1.
Notes from Exit Ticket
Take notes from the discussion in the space provided below.
Answer:
Notes:

Eureka Math Grade 6 Module 1 Lesson 20 Problem Set Answer Key

The table below shows the amount of money Gabe earns working at a coffee shop.
Eureka Math Grade 6 Module 1 Lesson 20 Problem Set Answer Key 9

Question 1.
How much does Gabe earn per hour?
Answer:
Gabe earns $13. 50 per hour.

Question 2.
Jordan is another employee at the same coffee shop. He has worked there longer than Gabe and earns $3 more per hour than Gabe. Complete the table below to show how much Jordan earns.
Eureka Math Grade 6 Module 1 Lesson 20 Problem Set Answer Key 10
Answer:
Eureka Math Grade 6 Module 1 Lesson 20 Problem Set Answer Key 11

Question 3.
Serena is the manager of the coffee shop. The amount of money she earns is represented by the equation m = 21 h, where h is the number of hours Serena works, and m is the amount of money she earns. How much more money does Serena make an hour than Gabe? Explain your thinking.
Answer:
21 – 13.5 = 7.50, so Serena makes $7.50 per hour more than Gabe.

Question 4.
Last month, Jordan received a promotion and became a manager. He now earns the same amount as Serena. How much more money does he earn per hour now that he is a manager than he did before his promotion? Explain your thinking.
Answer:
Jordan now makes the same amount as Serena, which is $21 an hour. Jordan previously made $16.50 an hour, so 21 – 16. 50 = 4.50. Therefore, Jordan will make an additional $4.50 an hour now that he is a manager.

Eureka Math Grade 6 Module 1 Lesson 20 Exit Ticket Answer Key

Question 1.
Value Grocery Mart and Market City are both having a sale on the same popular crackers. McKayla is trying to determine which sale is the better deal. Using the given table and equation, determine which store has the better deal on crackers. Explain your reasoning. (Remember to round your answers to the nearest penny.)
Value Grocery Mart:
Eureka Math Grade 6 Module 1 Lesson 20 Exit Ticket Answer Key 12
Market City:
c = 1. 75b, where c represents the cost in dollars, and b represents the number of boxes of crackers.
Answer:
Value Grocery Mart is better because one box of crackers would cost $1. 67. One box of crackers at Market City would cost $1. 75, which is a little more expensive than Value Grocery Mart.

Eureka Math Grade 6 Module 1 Lesson 20 Exploratory Challenge Answer Key

a. Mallory is on a budget and wants to determine which cereal is a better buy. A 10-ounce box of cereal costs $2.79, and a 13-ounce box of the same cereal costs $3. 99.

i. Which box of cereal should Mallory buy?
Answer:
Because the 10-ounce box costs about 28 cents per ounce, and the 13-ounce box costs about 31 cents per ounce, Mallory should buy the 10-ounce box of cereal.

ii. What is the difference between the two unit prices?
Answer:
The 10-ounce box of cereal would be preferred because it is 3 cents cheaper per ounce.

b. Vivian wants to buy a watermelon. Kingston’s Market has 10-pound watermelons for $3. 90, but the Farmer’s Market has 12-pound watermelons for $4. 44.

i. Which market has the best price for watermelon?
Answer:
The Farmer’s Market has the best price for watermelons.

ii. What is the difference between the two unit prices?
Answer:
The 12-pound watermelon is a better deal because it is 2 cents cheaper per pound.

c. Mitch needs to purchase soft drinks for a staff party. He is trying to figure out if it is cheaper to buy the 12- pack of soda or the 20-pack of soda. The 12-pack of soda costs $3. 99, and the 20-pack of soda costs $5. 48.
i. Which pack should Mitch choose?
Answer:
20-pack of soda for $5.48

ii. What is the difference in cost between single cans of soda from each of the two packs?
Answer:
The difference in cost between single cans from each pack is 6 cents.

d. Mr. Steiner needs to purchase 60 AA batteries. A nearby store sells a 20-pack of AA batteries for $12.49 and a 12-pack of the same batteries for $7. 20.
i. Would it be less expensive for Mr. Steiner to purchase the batteries in 20-packs or 12-packs?
Answer:
He should purchase five 12-packs of batteries for $7.20 for a total cost of $36. 00.

e. The table below shows the amount of calories Mike burns as he runs.
Eureka Math Grade 6 Module 1 Lesson 20 Exploratory Challenge Answer Key 1
Fill in the missing part of the table.
Answer:
Eureka Math Grade 6 Module 1 Lesson 20 Exploratory Challenge Answer Key 2

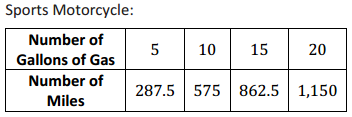
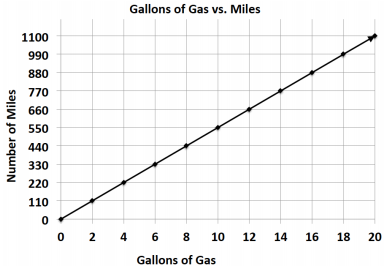
f. Emilio wants to buy a new motorcycle. He wants to compare the gas efficiency for each motorcycle before he makes a purchase. The dealerships presented the data below.
Eureka Math Grade 6 Module 1 Lesson 20 Exploratory Challenge Answer Key 3

Leisure Motorcycle:
Eureka Math Grade 6 Module 1 Lesson 20 Exploratory Challenge Answer Key 4
Which motorcycle is more gas efficient and by how much?
Answer:
The sports motorcycle gets 2.5 more miles per gallon of gas.

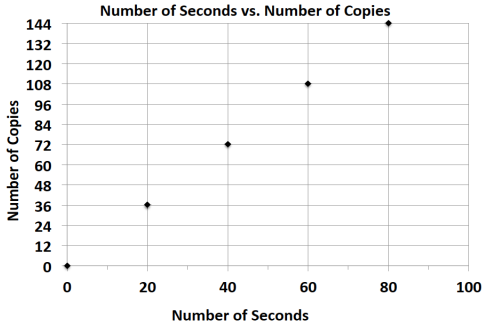
g. Milton Middle School is planning to purchase a new copy machine. The principal has narrowed the choice to two models: SuperFast Deluxe and Quick Copies. He plans to purchase the machine that copies at the fastest rate. Use the information below to determine which copier the principal should choose.
SuperFast Deluxe:
Eureka Math Grade 6 Module 1 Lesson 20 Exploratory Challenge Answer Key 5

Quick Copies:
c = 1.5t
(where t represents the amount of time in seconds, and C represents the number of copies)
Answer:
SuperFast Deluxe

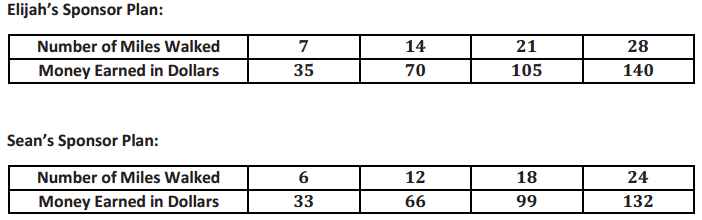
h. Elijah and Sean are participating In a walk-a-thon. Each student wants to calculate how much money he would make from his sponsors at different points of the walk-a-thon. Use the information in the tables below to determine which student would earn more money if they both walked the same distance. How much more money would that student earn per mile?
Eureka Math Grade 6 Module 1 Lesson 20 Exploratory Challenge Answer Key 6
Answer:
Sean earns 50 cents more than Elijah every mile.

i. Gerson is going to buy a new computer to use for his new job and also to download movies. He has to decide between two different computers. How many more kilobytes does the faster computer download in one second?
Choice 1: The rate of download is represented by the following equation: k = 153t, where t represents the amount of time in seconds, and k represents the number of kilobytes.

Choice 2: The rate of download is represented by the following equation: k = 150t, where t represents the amount of time in seconds, and k represents the number of kilobytes.
Answer:
Choice 1 downloads 3 more kilobytes per second than Choice 2.

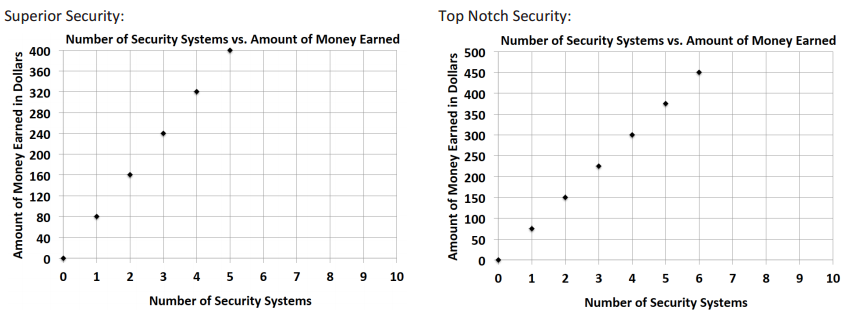
j. Zyearaye is trying to decide which security system company he will make more money working for. Use the graphs below that show Zyearaye’s potential commission rate to determine which company will pay Zyearaye more commission. How much more commission would Zyearaye earn by choosing the company with the better rate?
Eureka Math Grade 6 Module 1 Lesson 20 Exploratory Challenge Answer Key 7
Answer:
Superior Security would pay $5 more per security system sold than Top Notch Security.

k. Emilia and Miranda are sisters, and their mother just signed them up for a new cell phone plan because they send too many text messages. Using the Information below, determine which sister sends the most text messages. How many more text messages does this sister send per week?
Eureka Math Grade 6 Module 1 Lesson 20 Exploratory Challenge Answer Key 8
Miranda: m = 410w, where w represents the number of weeks, and m represents the number of text messages.
Answer:
Miranda sends 10 more text messages per week than Emilia.

Eureka Math Grade 6 Module 1 Lesson 24 Answer Key

Engage NY Eureka Math 6th Grade Module 1 Lesson 24 Answer Key

Eureka Math Grade 6 Module 1 Lesson 24 Exercise Answer Key

Exercise 1
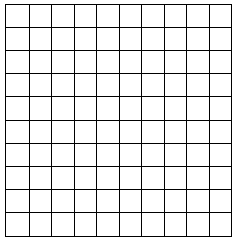
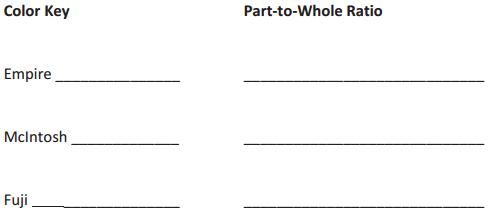
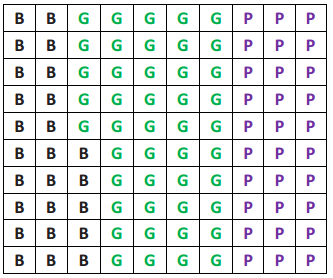
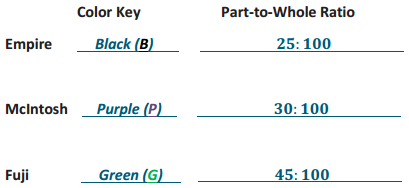
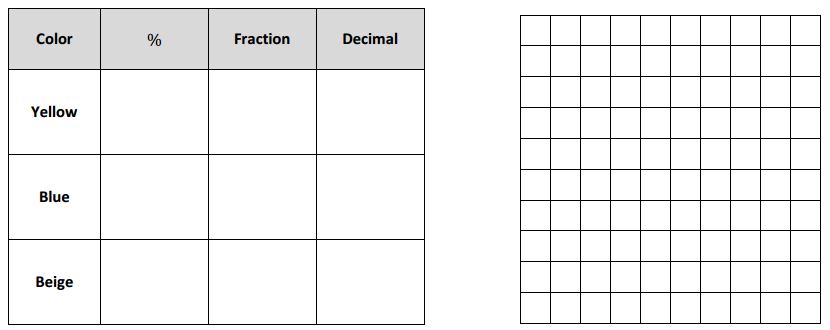
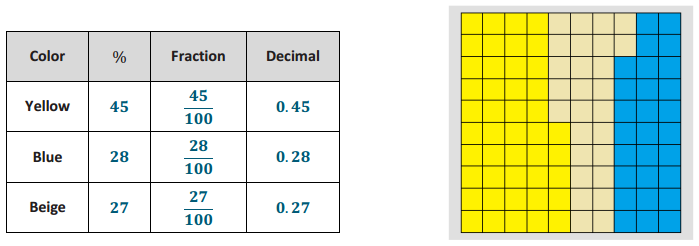
Robb’s Fruit Farm consists of 100 acres on which three different types of apples grow. On 25 acres, the farm grows Empire apples. Mcintosh apples grow on 30% of the farm. The remainder of the farm grows Fuji apples. Shade in the grid below to represent the portion of the farm each type of apple occupies. Use a different color for each type of apple. Create a key to identify which color represents each type of apple.
Eureka Math Grade 6 Module 1 Lesson 24 Exercise Answer Key 1
Eureka Math Grade 6 Module 1 Lesson 24 Exercise Answer Key 2
Answer:
Eureka Math Grade 6 Module 1 Lesson 24 Exercise Answer Key 3
Eureka Math Grade 6 Module 1 Lesson 24 Exercise Answer Key 4

Exercise 2
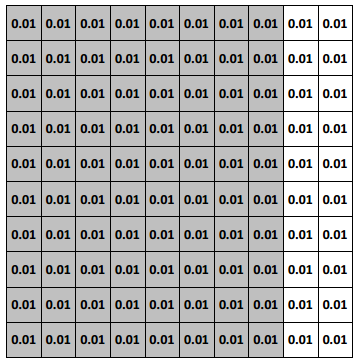
The shaded portion of the grid below represents the portion of a granola bar remaining.
Eureka Math Grade 6 Module 1 Lesson 24 Exercise Answer Key 5
What percent does each block of granola bar represent?
Answer:
1% of the granola bar

What percent of the granola bar remains?
Answer:
80%

What other ways can we represent this percent?
Answer:
\(\frac{80}{100}, \frac{8}{10}, \frac{4}{5}, \frac{16}{20}, \frac{32}{40}, \frac{64}{80}, 0.8\)

Exercise 3.
Eureka Math Grade 6 Module 1 Lesson 24 Exercise Answer Key 6
a. For each figure shown, represent the gray shaded region as a percent of the whole figure. Write your answer as a decimal, fraction, and percent.
Eureka Math Grade 6 Module 1 Lesson 24 Exercise Answer Key 7
Answer:
Eureka Math Grade 6 Module 1 Lesson 24 Exercise Answer Key 8

b. What ratio is being modeled in each picture?
Answer:
Picture (a): Answers will vary. One example is the ratio of darker gray to the total is 20 to 100.
Picture (b): 50 to 100, or a correct answer for whichever description they chose.
Picture (c): The ratio of gray to the total Is 48 to 100.

c. How are the ratios and percents related?
Answer:
Answers will vary.

Exercise 4
Each relationship below compares the shaded portion (the part) to the entire figure (the whole). Complete the table.
Eureka Math Grade 6 Module 1 Lesson 24 Exercise Answer Key 9
Eureka Math Grade 6 Module 1 Lesson 24 Exercise Answer Key 10
Answer:
Eureka Math Grade 6 Module 1 Lesson 24 Exercise Answer Key 11
Eureka Math Grade 6 Module 1 Lesson 24 Exercise Answer Key 12

Exercise 5
Mr. Brown shares with the class that 70% of the students got an A on the English vocabulary quiz. If Mr. Brown has 100 students, create a model to show how many of the students received an A on the quiz.
Answer:
Eureka Math Grade 6 Module 1 Lesson 24 Exercise Answer Key 13
70% → \(\frac{70}{100}=\frac{7}{10}\)

What fraction of the students received an A on the quiz?
Answer:
\(\frac{7}{10}\) or \(\frac{70}{100}\)

How could we represent this amount using a decimal?
Answer:
0.7 or 0.70

How are the decimal, the fraction, and the percent all related?
Answer:
The decimal, fraction, and percent all show 70 out of 100.

Exercise 6
Marty owns a lawn mowing service. His company, which consists of three employees, has 100 lawns to mow this week. Use the 10 × 10 grid to model how the work could have been distributed between the three employees.
Eureka Math Grade 6 Module 1 Lesson 24 Exercise Answer Key 14
Answer:
Students choose how they want to separate the workload. The answers will vary. Below is a sample response.
Eureka Math Grade 6 Module 1 Lesson 24 Exercise Answer Key 15

Eureka Math Grade 6 Module 1 Lesson 24 Problem Set Answer Key

Question 1.
Marissa just bought 100 acres of land. She wants to grow apple, peach, and cherry trees on her land. Color the model to show how the acres could be distributed for each type of tree. Using your model, complete the table.
Eureka Math Grade 6 Module 1 Lesson 24 Problem Set Answer Key 16
Answer:
Eureka Math Grade 6 Module 1 Lesson 24 Problem Set Answer Key 17

Question 2.
After renovations on Kim’s bedroom, only 30 percent of one wall is left without any décor. Shade the grid below to represent the space that is left to decorate.
Eureka Math Grade 6 Module 1 Lesson 24 Problem Set Answer Key 18
Answer:
Eureka Math Grade 6 Module 1 Lesson 24 Problem Set Answer Key 19

a. What does each block represent?
Answer:
Each block represents \(\frac{1}{100}\) of the total wall.

b. What percent of this wall has been decorated?
Answer:
30%

Eureka Math Grade 6 Module 1 Lesson 24 Exit Ticket Answer Key

Question 1.
One hundred offices need to be painted. The workers choose between yellow, blue, or beige paint. They decide that 45% of the offices will be painted yellow; 28% will be painted blue, and the remaining offices will be painted beige. Create a model that shows the percent of offices that will be painted each color. Write the amounts as decimals and fractions.
Eureka Math Grade 6 Module 1 Lesson 24 Exit Ticket Answer Key 20
Answer:
Eureka Math Grade 6 Module 1 Lesson 24 Exit Ticket Answer Key 21

Eureka Math Grade 6 Module 1 Lesson 22 Answer Key

Engage NY Eureka Math 6th Grade Module 1 Lesson 22 Answer Key

Eureka Math Grade 6 Module 1 Lesson 22 Example Answer Key

Example 1
Walker: Substitute the walker’s distance and time into the equation and solve for the rate of speed.
distance = rate . time
d = r . t

Hint: Consider the units that you want to end up with. If you want to end up with the rate (feet/second), then divide the distance (feet) by time (seconds).

Runner: Substitute the runner’s time and distance into the equation to find the rate of speed.
distance = rate . time
d = r . t
Answer:
Here is a sample of student work using 8 seconds as an example:
d = r . t and r = \(\frac{d}{t}\); Distance: 50 feet; TIme: 8 seconds
r = \(\frac{50}{8} \frac{\mathrm{ft}}{\mathrm{sec}}\) = 6.25 \(\frac{\mathrm{ft}}{\mathrm{sec}}\)

Example 2
Part 1: Chris Johnson ran the 40-yard dash in 4.24 seconds. What is the rate of speed? Round any answer to the nearest hundredth.
distance = rate time
d = r.t
Answer:
d = r.t and r = \(\frac{d}{t}\); r = \(\frac{40}{4.24} \frac{y d}{\sec } \approx 9.43 \frac{y d}{\sec }\)

Part 2: In Lesson 21, we converted units of measure using unit rates. If the runner were able to run at a constant rate, how many yards would he run in an hour? This problem can be solved by breaking it down into two steps. Work with a partner, and make a record of your calculations.
a. How many yards would he run in one minute?
Answer:
Eureka Math Grade 6 Module 1 Lesson 22 Example Answer Key 1

b. How many yards would he run in one hour?
Answer:
Eureka Math Grade 6 Module 1 Lesson 22 Example Answer Key 2

We completed that problem in two separate steps, but it is possible to complete this same problem in one step. We can multiply the yards per second by the seconds per minute, then by the minutes per hour.
Eureka Math Grade 6 Module 1 Lesson 22 Example Answer Key 4
Answer:
Eureka Math Grade 6 Module 1 Lesson 22 Example Answer Key 3

Cross out any units that are in both the numerator and denominator in the expression because these cancel each other out.

Part 3: How many miles did the runner travel in that hour? Round your response to the nearest tenth.
Answer:
Eureka Math Grade 6 Module 1 Lesson 22 Example Answer Key 5
Cross out any units that are in both the numerator and denominator in the expression because they cancel out.

Eureka Math Grade 6 Module 1 Lesson 22 Exercise Answer Key

Exercise 1.
I drove my car on cruise control at 65 miles per hour for 3 hours without stopping. How far did I go?
d = r.t
Eureka Math Grade 6 Module 1 Lesson 22 Exercise Answer Key 6
Answer:
Eureka Math Grade 6 Module 1 Lesson 22 Exercise Answer Key 7

Cross out any units that are in both the numerator and denominator in the expression because they cancel out. d = ____ miles
Answer:
d = 195 miles

Exercise 2
On the road trip, the speed limit changed to 50 miles per hour in a construction zone. Traffic moved along at a constant rate (50 mph), and it took me 15 minutes (0.25 hours) to get through the zone. What was the distance of the construction zone? (Round your response to the nearest hundredth of a mile.)
d = r t
Eureka Math Grade 6 Module 1 Lesson 22 Exercise Answer Key 8
Answer:
Eureka Math Grade 6 Module 1 Lesson 22 Exercise Answer Key 9
d = 12.50 miles

Eureka Math Grade 6 Module 1 Lesson 22 Problem Set Answer Key

Question 1.
If Adam’s plane traveled at a constant speed of 375 miles per hour for six hours, how far did the plane travel?
Answer:
d = r . t
Eureka Math Grade 6 Module 1 Lesson 22 Problem Set Answer Key 10

Question 2.
A Salt March Harvest Mouse ran a 360 centimeter straight course race in 9 seconds. How fast did it run?
Answer:
Eureka Math Grade 6 Module 1 Lesson 22 Problem Set Answer Key 11

Question 3.
Another Salt Marsh Harvest Mouse took 7 seconds to run a 350 centimeter race. How fast did it run?
Answer:
Eureka Math Grade 6 Module 1 Lesson 22 Problem Set Answer Key 12

Question 4.
A slow boat to China travels at a constant speed of 17.25 miles per hour for 200 hours. How far was the voyage?
Answer:
d = r . t
Eureka Math Grade 6 Module 1 Lesson 22 Problem Set Answer Key 13

Question 5.
The Sopwith Camel was a British, First World War, single-seat, biplane fighter introduced on the Western Front in 1917. Traveling at its top speed of 110 mph in one direction for 2\(\frac{1}{2}\) hours, how far did the plane travel?
Answer:
d = r . t
Eureka Math Grade 6 Module 1 Lesson 22 Problem Set Answer Key 14

Question 6.
A world-class marathon runner can finish 26.2 miles in 2 hours. What is the rate of speed for the runner?
Answer:
Eureka Math Grade 6 Module 1 Lesson 22 Problem Set Answer Key 15

Question 7.
Banana slugs can move at 17 cm per minute. If a banana slug travels for 5 hours, how far will it travel?
Answer:
d = r . t
Eureka Math Grade 6 Module 1 Lesson 22 Problem Set Answer Key 16

Eureka Math Grade 6 Module 1 Lesson 22 Exit Ticket Answer Key

Question 1.
Franny took a road trip to her grandmother’s house. She drove at a constant speed of 60 miles per hour for 2 hours. She took a break and then finished the rest of her trip driving at a constant speed of 50 miles per hour for 2 hours. What was the total distance of Franny’s trip?
Answer:
Eureka Math Grade 6 Module 1 Lesson 22 Problem Set Answer Key 17

Eureka Math Grade 6 Module 1 Lesson 21 Answer Key

Engage NY Eureka Math 6th Grade Module 1 Lesson 21 Answer Key

Eureka Math Grade 6 Module 1 Lesson 21 Example Answer Key

Example 1.
Work with your partner to find out how many feet are in 48 inches. Make a ratio table that compares feet and inches. Use the conversion rate of 12 inches per foot or \(\frac{1}{12}\) foot per inch.
Answer:
Eureka Math Grade 6 Module 1 Lesson 21 Example Answer Key 1
48 inches equals 4 feet

Example 2.
How many grams are in 6 kilograms? Again, make a record of your work before using the calculator. The rate would be 1,000 grams per kg. The unit rate would be 1,000.
Answer:
Eureka Math Grade 6 Module 1 Lesson 21 Example Answer Key 2
There are 6,000 grams in 6 kilograms.

Eureka Math Grade 6 Module 1 Lesson 21 Exercise Answer Key

Exercise 1.
How many cups are in 5 quarts? As always, make a record of your work before using the calculator. The rate would be 4 cups per quart. The unit rate would be 4.
Answer:
Eureka Math Grade 6 Module 1 Lesson 21 Exercise Answer Key 3
There are 20 cups in 5 quarts.

Exercise 2.
How many quarts are in 10 cups?
Answer:
Eureka Math Grade 6 Module 1 Lesson 21 Exercise Answer Key 4

Eureka Math Grade 6 Module 1 Lesson 21 Problem Set Answer Key

Question 1.
7 ft. = _________ in.
Answer:
7 ft. =   84    in.

Question 2.
100 yd. = __________ ft.
Answer:
100 yd. =   300    ft.

Question 3.
25 m = _________ cm
Answer:
25 m =   2,500    cm

Question 4.
5 km = _________ m
Answer:
5 km =   5,000    m

Question 5.
96 oz. = ____________ Ib.
Answer:
96 oz. =   6    Ib.

Question 6.
2 mi.= ________ ft.
Answer:
2 mi.=   10.560    ft.

Question 7.
2 mi.= _________ yd.
Answer:
2 mi.=   3,520    yd.

Question 8.
32 fI. oz. = __________ c.
Answer:
32 fI. oz. =    4    c.

Question 9.
1,500 mL = _________ L
Answer:
1,500 mL =   1.5    L

Question 10.
6 g = __________ mg
Answer:
6 g =   6000   mg

Question 11.
Beau buys a 3-pound bag of trail mix for a hike. He wants to make one-ounce bags for his friends with whom he is hiking. How many one-ounce bags can he make?
Answer:
48 bags

Question 12.
The maximum weight for a truck on the New York State Thruway is 40 tons. How many pounds is this?
Answer:
80,000 Ib.

Question 13.
Claudia’s skis are 150 centimeters long. How many meters is this?
Answer:
1. 5m

Question 14.
Claudia’s skis are 150 centimeters long. How many millimeters is this?
Answer:
1, 500 mm

Question 15.
Write your own problem, and solve It. Be ready to share the question tomorrow.
Answer:
Answers will vary.

Eureka Math Grade 6 Module 1 Lesson 21 Exit Ticket Answer Key

Question 1.
Jill and Erika made 4 gallons of lemonade for their lemonade stand. How many quarts did they make? If they charge $2.00 per quart, how much money will they make if they sell it all?
Answer:
The conversion rate is 4 quarts per gallon.
Eureka Math Grade 6 Module 1 Lesson 21 Exit Ticket Answer Key 5

Eureka Math Grade 6 Module 1 Lesson 21 Opening Exercise Answer Key

Identify the ratios that are associated with conversions between feet, inches, and yards.

Question 1.
12 inches = _________ foot; the ratio of inches to feet is _________.
Answer:
12 inches =   1    foot; the ratio of inches to feet is   12: 1   .

Question 2.
1 foot = _________ inches; the ratio of feet to inches is _________.
Answer:
1 foot =   12    inches; the ratio of feet to inches is   1: 12    .

Question 3.
3 feet = ________ yard; the ratio of feet to yards is _________.
Answer:
3 feet =   1    yard; the ratio of feet to yards is   3: 1   .

Question 4.
1 yard = ________ feet; the ratio of yards to feet is _________.
Answer:
1 yard =   3   feet; the ratio of yards to feet is  1: 3   .

Eureka Math Grade 7 Module 3 Lesson 20 Answer Key

Engage NY Eureka Math 7th Grade Module 3 Lesson 20 Answer Key

Eureka Math Grade 7 Module 3 Lesson 20 Example Answer Key

Example 1.
Find the composite area of the shaded region. Use 3.14 for π.
Engage NY Math 7th Grade Module 3 Lesson 20 Example Answer Key 1
Answer:
Allow students to look at the problem and find the area independently before solving as a class.
→ What information can we take from the image?
Two circles are on the coordinate plane. The diameter of the larger circle is 6 units, and the diameter of the smaller circle is 4 units.

→ How do we know what the diameters of the circles are?
We can count the units along the diameter of the circles, or we can subtract the coordinate points to find the length of the diameter.

→ What information do we know about circles?
The area of a circle is equal to the radius squared times π. We can approximate π as 3.14 or \(\frac{22}{7}\).

→ After calculating the two areas, what is the next step, and how do you know?
The non – overlapping regions add, meaning that the Area(small disk) + Area(ring) = Area(big disk). Rearranging this results in this: Area(ring) = Area(big disk) – Area(small disk). So, the next step is to take the difference of the disks.
Engage NY Math 7th Grade Module 3 Lesson 20 Example Answer Key 2
→ What is the area of the figure?
9π – 4π = 5π; the area of the figure is approximately 15.7 square units.

Example 2.
Find the area of the figure that consists of a rectangle with a semicircle on top. Use 3.14 for π.
Engage NY Math 7th Grade Module 3 Lesson 20 Example Answer Key 3.1
Answer:
A = 28.28 m2
→ What do we know from reading the problem and looking at the picture?
There is a semicircle and a rectangle.

→ What information do we need to find the areas of the circle and the rectangle?
We need to know the base and height of the rectangle and the radius of the semicircle. For this problem, let the radius for the semicircle be r meters.

→ How do we know where to draw the diameter of the circle?
The diameter is parallel to the bottom base of the rectangle because we know that the figure includes a semicircle.

→ What is the diameter and radius of the circle?
The diameter of the circle is equal to the base of the rectangle, 4 m . The radius is half of 4 m, which is 2 m.

→ What would a circle with a diameter of 4 m look like relative to the figure?
Engage NY Math 7th Grade Module 3 Lesson 20 Example Answer Key 3
→ What is the importance of labeling the known lengths of the figure?
This helps us keep track of the lengths when we need to use them to calculate different parts of the composite figure. It also helps us find unknown lengths because they may be the sum or the difference of known lengths.

→ How do we find the base and height of the rectangle?
The base is labeled 4 m, but the height of the rectangle is combined with the radius of the semicircle. The difference of the height of the figure, 7.5 m, and the radius of the semicircle equals the height of the rectangle. Thus, the height of the rectangle is (7.5 – 2) m, which equals 5.5 m.
Engage NY Math 7th Grade Module 3 Lesson 20 Example Answer Key 4
→ What is the area of the rectangle?
The area of the rectangle is 5.5 m times 4 m. The area is 22.0 m2.

→ What is the area of the semicircle?
The area of the semicircle is half the area of a circle with a radius of 2 m. The area is 4(3.14) m2 divided by 2, which equals 6.28 m2.

→ Do we subtract these areas as we did in Example 1?
No, we combine the two. The figure is the sum of the rectangle and the semicircle.

→ What is the area of the figure?
28.28 m2

Example 3.
Find the area of the shaded region.
Engage NY Math 7th Grade Module 3 Lesson 20 Example Answer Key 5
Redraw the figure separating the triangles; then, label the lengths discussing the calculations.
Answer:
Engage NY Math 7th Grade Module 3 Lesson 20 Example Answer Key 6
→ Do we know any of the lengths of the acute triangle?
No

→ Do we have information about the right triangles?
Yes, because of the given lengths, we can calculate unknown sides.

→ Is the sum or difference of these parts needed to find the area of the shaded region?
Both are needed. The difference of the square and the sum of the three right triangles is the area of the shaded triangle.

→ What is the area of the shaded region?
400 cm2 – ((\(\frac{1}{2}\) × 20 cm × 12 cm)+(\(\frac{1}{2}\) × 20 cm × 14 cm) + (\(\frac{1}{2}\) × 8 cm × 6 cm)) = 116 cm2
The area is 116 cm2.

Eureka Math Grade 7 Module 3 Lesson 20 Exercise Answer Key

Exercise 1.
A yard is shown with the shaded section indicating grassy areas and the unshaded sections indicating paved areas. Find the area of the space covered with grass in units2.
Engage NY Math Grade 7 Module 3 Lesson 20 Exercise Answer Key 1
Answer:
Area of rectangle ABCD – area of rectangle IJKL = area of shaded region
(3 ∙ 2) – (\(\frac{1}{2}\) ∙ 1)
6 – \(\frac{1}{2}\)
5 \(\frac{1}{2}\)
The area of the space covered with grass is 5 \(\frac{1}{2}\) units2.

Exercise 2.
Find the area of the shaded region. Use 3.14 for π.
Engage NY Math Grade 7 Module 3 Lesson 20 Exercise Answer Key 2
Answer:
Area of the triangle + area of the semicircle = area of the shaded region
\(\frac{1}{2}\) b × h) + \(\frac{1}{2}\) )(πr2 )
\(\frac{1}{2}\) ∙ 14 cm ∙ 8 cm) + \(\frac{1}{2}\) )(3.14 ∙ (4 cm)2 )
56 cm2 + 25.12 cm2
81.12 cm2
The area is approximately 81.12 cm2.

Exercise 3.
Find the area of the shaded region. The figure is not drawn to scale.
Engage NY Math Grade 7 Module 3 Lesson 20 Exercise Answer Key 3
Answer:
Area of squares – (area of the bottom right triangle + area of the top right triangle)
((2 cm × 2 cm)+(3 cm × 3 cm)) – ((\(\frac{1}{2}\) × 5 cm × 2 cm)+(\(\frac{1}{2}\) × 3 cm × 3 cm))
13 cm2 – 9.5 cm2
3.5 cm2
The area is 3.5 cm2.
There are multiple solution paths for this problem. Explore them with students.

Eureka Math Grade 7 Module 3 Lesson 20 Problem Set Answer Key

Question 1.
Find the area of the shaded region. Use 3.14 for π.
Eureka Math 7th Grade Module 3 Lesson 20 Problem Set Answer Key 1
Answer:
Area of large circle– area of small circle
(π × (8 cm)2) – (π × (4 cm)2)
(3.14)(64 cm2) – (3.14)(16 cm2)
200.96 cm2 – 50.24 cm2
150.72 cm2
The area of the region is approximately 150.72 cm2.

Question 2.
The figure shows two semicircles. Find the area of the shaded region. Use 3.14 for π.
Eureka Math 7th Grade Module 3 Lesson 20 Problem Set Answer Key 2
Answer:
Area of large semicircle region – area of small semicircle region = area of the shaded region
(\(\frac{1}{2}\) )(π × (6 cm)2) – (\(\frac{1}{2}\) )(π × (3 cm)2)
(\(\frac{1}{2}\) )(3.14)(36 cm2) – (\(\frac{1}{2}\) )(3.14)(9 cm2)
56.52 cm2 – 14.13 cm2
42.39 cm2
The area is approximately 42.39 cm2.

Question 3.
The figure shows a semicircle and a square. Find the area of the shaded region. Use 3.14 for π.
Eureka Math 7th Grade Module 3 Lesson 20 Problem Set Answer Key 3
Answer:
Area of the square – area of the semicircle
(24 cm × 24 cm) – (\(\frac{1}{2}\) )( π × (12 cm)2)
576 cm2 – (\(\frac{1}{2}\) )(3.14 × 144 cm2)
576 cm2 – 226.08 cm2
349.92 cm2
The area is approximately 349.92 cm2.

Question 4.
The figure shows two semicircles and a quarter of a circle. Find the area of the shaded region. Use 3.14 for π.
Eureka Math 7th Grade Module 3 Lesson 20 Problem Set Answer Key 4
Answer:
Area of two semicircles + area of quarter of the larger circle
2(\(\frac{1}{2}\))(π × (5 cm)2 ) + (\(\frac{1}{4}\))(π × (10 cm)2)
(3.14)(25 cm2 )+(3.14)(25 cm2)
78.5 cm2 + 78.5 cm2
157 cm2
The area is approximately 157 cm2.

Question 5.
Jillian is making a paper flower motif for an art project. The flower she is making has four petals; each petal is formed by three semicircles as shown below. What is the area of the paper flower? Provide your answer in terms of π.
Eureka Math 7th Grade Module 3 Lesson 20 Problem Set Answer Key 5
Answer:
Area of medium semicircle + (area of larger semicircle – area of small semicircle)
(\(\frac{1}{2}\) )(π × (6 cm)2 )+((\(\frac{1}{2}\) )(π × (9 cm)2 ) – (\(\frac{1}{2}\) )(π × (3 cm)2))
18π cm2+40.5π cm2 – 4.5π cm2 = 54π cm2
54π cm2 × 4
216πcm2
The area is 216π cm2.

Question 6.
The figure is formed by five rectangles. Find the area of the unshaded rectangular region.
Eureka Math 7th Grade Module 3 Lesson 20 Problem Set Answer Key 6
Answer:
Area of the whole rectangle – area of the sum of the shaded rectangles = area of the unshaded rectangular region
(12 cm × 14 cm) – (2(3 cm × 9 cm) + (11 cm × 3 cm) + (5 cm × 9 cm))
168 cm2 – (54 cm2 + 33 cm2 + 45 cm2 )
168 cm2 – 132 cm2
36 cm2
The area is 36 cm2.

Question 7.
The smaller squares in the shaded region each have side lengths of 1.5 m. Find the area of the shaded region.
Eureka Math 7th Grade Module 3 Lesson 20 Problem Set Answer Key 7
Answer:
Area of the 16 m by 8 m rectangle – the sum of the area of the smaller unshaded rectangles = area of the shaded region
(16 m × 8 m) – ((3 m × 2 m) + (4(1.5 m × 1.5 m)))
128 m2 – (6 m2 + 4(2.25 m2 ))
128 m2 – 15 m2
113 m2
The area is 113 m2.

Question 8.
Find the area of the shaded region.
Eureka Math 7th Grade Module 3 Lesson 20 Problem Set Answer Key 8
Answer:
Area of the sum of the rectangles – area of the right triangle = area of shaded region
((17 cm × 4 cm)+(21 cm × 8 cm)) – ((\(\frac{1}{2}\) )(13 cm × 7 cm))
(68 cm2+168 cm2 ) – (\(\frac{1}{2}\) )(91 cm2 )
236 cm2 – 45.5 cm2
190.5 cm2
The area is 190.5 cm2.

Question 9.
a. Find the area of the shaded region.
Eureka Math 7th Grade Module 3 Lesson 20 Problem Set Answer Key 9
Answer:
Area of the two parallelograms – area of square in the center = area of the shaded region
2(5 cm × 16 cm) – (4 cm × 4 cm)
160 cm2 – 16 cm2
144 cm2
The area is 144 cm2.

b. Draw two ways the figure above can be divided in four equal parts.
Answer:
Eureka Math 7th Grade Module 3 Lesson 20 Problem Set Answer Key 10

c. What is the area of one of the parts in (b)?
Answer:
144 cm2 ÷ 4 = 36 cm2
The area of one of the parts in (b) is 36 cm2.

Question 10.
The figure is a rectangle made out of triangles. Find the area of the shaded region.
Eureka Math 7th Grade Module 3 Lesson 20 Problem Set Answer Key 11
Answer:
Area of the rectangle – area of the unshaded triangles = area of the shaded region
(24 cm × 21 cm) – ((\(\frac{1}{2}\) )(9 cm × 21 cm)+(\(\frac{1}{2}\))(9 cm × 24 cm))
504 cm2 – (94.5 cm2 + 108 cm2 )
504 cm2 – 202.5 cm2
301.5 cm2
The area is 301.5 cm2.

Question 11.
The figure consists of a right triangle and an eighth of a circle. Find the area of the shaded region. Use \(\frac{22}{7}\) for π.
Eureka Math 7th Grade Module 3 Lesson 20 Problem Set Answer Key 12
Answer:
Area of right triangle – area of eighth of the circle = area of shaded region
(\(\frac{1}{2}\))(14 cm × 14 cm) – (\(\frac{1}{8}\))(π × 14 cm × 14 cm)
(\(\frac{1}{2}\))(196 cm2) – (\(\frac{1}{8}\))(\(\frac{22}{7}\))(2 cm × 7 cm × 2 cm × 7 cm)
98 cm2 – 77 cm2
21 cm2
The area is approximately 21 cm2.

Eureka Math Grade 7 Module 3 Lesson 20 Exit Ticket Answer Key

Question 1.
The unshaded regions are quarter circles. Approximate the area of the shaded region. Use π ≈ 3.14.
Eureka Math Grade 7 Module 3 Lesson 20 Exit Ticket Answer Key 1
Answer:
Area of the square – area of the 4 quarter circles = area of the shaded region
(22 m ∙ 22 m) – ((11 m)2 ∙ 3.14)
484 m2 – 379.94 m2
104.06 m2
The area of the shaded region is approximately 104.06 m2.

Eureka Math Grade 6 Module 1 Lesson 19 Answer Key

Engage NY Eureka Math 6th Grade Module 1 Lesson 19 Answer Key

Eureka Math Grade 6 Module 1 Lesson 19 Example Answer Key

Example 1.
The ratio of cups of blue paint to cups of red paint is 1: 2, which means for every cup of blue paint, there are two cups of red paint. In this case, the equation would be red = 2 × blue, or r = 2b, where b represents the amount of blue paint and r represents the amount of red paint. Make a table of values.
Answer:
Eureka Math Grade 6 Module 1 Lesson 19 Example Answer Key 1

Example 2.
Ms. Siple is a librarian who really enjoys reading. She can read \(\frac{3}{4}\) of a book in one day. This relationship can be represented by the equation days = \(\frac{3}{4}\) books, which can be written as d = \(\frac{3}{4}\)b where b represents the number of books and d represents the number of days.
Answer:
Eureka Math Grade 6 Module 1 Lesson 19 Example Answer Key 2

Eureka Math Grade 6 Module 1 Lesson 19 Exercise Answer Key

Exercise 1.
Bryan and ShaNiece are both training for a bike race and want to compare who rides his or her bike at a faster rate. Both bikers use apps on their phones to record the time and distance of their bike rides. Bryan’s app keeps track of his route on a table, and ShaNiece’s app presents the information on a graph. The information is shown below.
Eureka Math Grade 6 Module 1 Lesson 19 Exercise Answer Key 3
a. At what rate does each biker travel? Explain how you arrived at your answer.
Answer:
Eureka Math Grade 6 Module 1 Lesson 19 Exercise Answer Key 4
Bryan travels at a rate of 25 miles per hour. The double number line had to be split in 3 equal sections.
That’s how l got25; (25 + 25 + 25) = 75.
ShaNiece travels at 15 miles per hour. I know this by looking at the point (1, 15) on the graph.
The 1 represents the number of hours, and the 15 represents the number of miles.

b. ShaNiece wants to win the bike race. Make a new graph to show the speed ShaNiece would have to ride her bike in order to beat Bryan.
Answer:
Eureka Math Grade 6 Module 1 Lesson 19 Exercise Answer Key 5
The graph shows ShaNiece traveling at a rate of 30 miles per hour, which is faster than Bryan’s rate.

Exercise 2.
Braylen and Tyce both work at a department store and are paid by the hour. The manager told the boys they both earn the same amount of money per hour, but Braylen and Tyce did not agree. They each kept track of how much money they earned in order to determine if the manager was correct. Their data is shown below.

Braylen: m = 10.50h where h represents the number of hours worked and m represents the amount of money Braylen was paid.

Tyce:
Eureka Math Grade 6 Module 1 Lesson 19 Exercise Answer Key 6
a. How much did each person earn in one hour?
Answer:
Eureka Math Grade 6 Module 1 Lesson 19 Exercise Answer Key 7
Tyce earned $11.50 per hour. Braylen earned $10.50 per hour.

b. Was the manager correct? Why or why not?
Answer:
The manager was not correct because Tyce earned $1 more than Braylen in one hour.

Exercise 3.
Claire and Kate are entering a cup stacking contest. Both girls have the same strategy: stack the cups at a constant rate so that they do not slow down at the end of the race. While practicing, they keep track of their progress, which is shown below.

Claire:
Eureka Math Grade 6 Module 1 Lesson 19 Exercise Answer Key 8
Kate: c = 4t, where t represents the amount of time in seconds and c represents the number of stacked cups.
a. At what rate does each girl stack her cups during the practice sessions?
Answer:
Claire stacks cups at a rate of 5 cups per second. Kate stacks cups at a rate of 4 cups per second.

b. Kate notices that she is not stacking her cups fast enough. What would Kate’s equation look like if she wanted to stack cups faster than Claire?
Answer:
Answers will vary. c = 6t, where t represents the time in seconds, and c represents the number of cups stacked.

Eureka Math Grade 6 Module 1 Lesson 19 Problem Set Answer Key

Victor was having a hard time deciding which new vehicle he should buy. He decided to make the final decision based on the gas efficiency of each car. A car that is more gas efficient gets more miles per gallon of gas. When he asked the manager at each car dealership for the gas mileage data, he received two different representations, which are shown below.
Eureka Math Grade 6 Module 1 Lesson 19 Problem Set Answer Key 9
Eureka Math Grade 6 Module 1 Lesson 19 Problem Set Answer Key 10

Question 1.
If Victor based his decision only on gas efficiency, which car should he buy? Provide support for your answer.
Answer:
Victor should buy the Legend because it gets 18 miles per gallon of gas, and the Supreme only gets 16\(\frac{2}{3}\) miles per gallon. Therefore, the Legend is more gas efficient.

Question 2.
After comparing the Legend and the Supreme, Victor saw an advertisement for a third vehicle, the Lunar. The manager said that the Lunar can travel about 289 miles on a tank of gas. If the gas tank can hold 17 gallons of gas, is the Lunar Victor’s best option? Why or why not?
Answer:
The Lunar is not a better option than the Legend because the Lunar only gets 17 miles per gallon, and the Legend gets 18 miles per gallon. Therefore, the Legend is still the best option.

Eureka Math Grade 6 Module 1 Lesson 19 Exit Ticket Answer Key

Kiara, Giovanni, and Ebony are triplets and always argue over who can answer basic math facts the fastest. After completing a few different math fact activities, Kiara, Giovanni, and Ebony record their data, which is shown below.

Kiara: m = St, where t represents the time in seconds, and m represents the number of math facts completed.
Eureka Math Grade 6 Module 1 Lesson 19 Exit Ticket Answer Key 11
Eureka Math Grade 6 Module 1 Lesson 19 Exit Ticket Answer Key 12

Question 1.
What is the math fact completion rate for each student?
Answer:
Kiara: 5 math facts/second
Giovanni: 4 math facts/second
Ebony: 6 math facts/second

Question 2.
Who would win the argument? How do you know?
Answer:
Ebony would win the argument because when comparing the unit rates of the three triplets, Ebony completes math facts at the fastest rate.