Eureka Math Grade 8 Module 6 Lesson 2 Answer Key

Engage NY Eureka Math 8th Grade Module 6 Lesson 2 Answer Key

Eureka Math Grade 8 Module 6 Lesson 2 Example Answer Key

Example 1: Rate of Change and Initial Value
The equation of a line can be interpreted as defining a linear function. The graphs and the equations of lines are important in understanding the relationship between two types of quantities (represented in the following examples by x and y).
In a previous lesson, you encountered an MP3 download site that offers downloads of individual songs with the following price structure: a $3 fixed fee for a monthly subscription plus a fee of $0.25 per song. The linear function that models the relationship between the number of songs downloaded and the total monthly cost of downloading songs can be written as
y = 0.25x + 3,
where x represents the number of songs downloaded and y represents the total monthly cost (in dollars) for
MP3 downloads.
a. In your own words, explain the meaning of 0.25 within the context of the problem.
Answer:
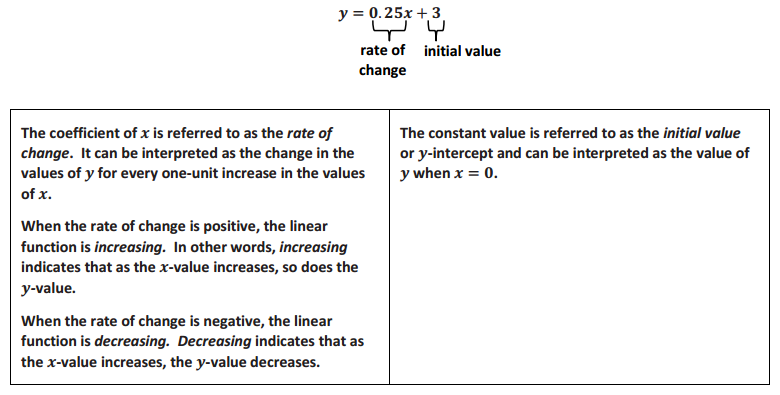
In the example on the previous page, the value 0.25 means there is a cost increase of $0.25 for every 1 song downloaded.

b. In your own words, explain the meaning of 3 within the context of the problem.
Answer:
In the example on the previous page, the value of 3 represents an initial cost of $3 for downloading 0 songs. In other words, there is a fixed cost of $3 to subscribe to the site.

The values represented in the function can be interpreted in the following way:
Engage NY Math 8th Grade Module 6 Lesson 2 Example Answer Key 1

Eureka Math Grade 8 Module 6 Lesson 2 Exercise Answer Key

Exercises 1–6: Is It a Better Deal?
Another site offers MP3 downloads with a different price structure: a $2 fixed fee for a monthly subscription plus a fee of $0.40 per song.
Exercise 1.
Write a linear function to model the relationship between the number of songs downloaded and the total monthly cost. As before, let x represent the number of songs downloaded and y represent the total monthly cost (in dollars) of downloading songs.
Answer:
y = 0.4x + 2

Exercise 2.
Determine the cost of downloading 0 songs and 10 songs from this site.
Answer:
y = 0.4(0) + 2 = 2.00. For 0 songs, the cost is $2.00.
y = 0.4(10) + 2 = 6.00. For 10 songs, the cost is $6.00.

Exercise 3.
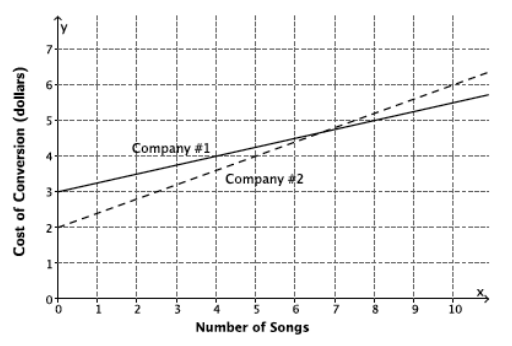
The graph below already shows the linear model for the first subscription site (Company 1): y = 0.25x + 3. Graph the equation of the line for the second subscription site (Company 2) by marking the two points from your work in Exercise 2 (for 0 songs and 10 songs) and drawing a line through those two points.
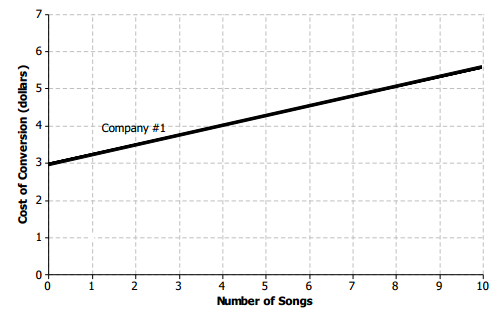
Engage NY Math Grade 8 Module 6 Lesson 2 Exercise Answer Key 1
Answer:
Engage NY Math Grade 8 Module 6 Lesson 2 Exercise Answer Key 2

Exercise 4.
Which line has a steeper slope? Which company’s model has the more expensive cost per song?
Answer:
The line modeled by the second subscription site (Company 2) is steeper. It has the larger slope value and the greater cost per song.

Exercise 5.
Which function has the greater initial value?
Answer:
The first subscription site (Company 1) has the greater initial value. Its monthly subscription fee is $3 compared to only $2 for the second site.

Exercise 6.
Which subscription site would you choose if you only wanted to download 5 songs per month? Which company would you choose if you wanted to download 10 songs? Explain your reasoning.
Answer:
For 5 songs: Company 1’s cost is $4.25 (y = 25(5) + 3); Company 2’s cost is $4.00 (y = 0.4(5) + 2). So, Company 2 would be the better choice. Graphically, Company 2’s model also has the smaller y – value when x = 5.
For 10 songs: Company 1’s cost is $5.50 (y = 0.25(10) + 3); Company 2’s cost is $6.00 (y = 0.4(10) + 2). So, Company 1 would be the better choice. Graphically, Company 1’s model also has the smaller y – value at x = 10.

Exercises 7–9: Aging Autos

Exercise 7.
When someone purchases a new car and begins to drive it, the mileage (meaning the number of miles the car has traveled) immediately increases. Let x represent the number of years since the car was purchased and y represent the total miles traveled. The linear function that models the relationship between the number of years since purchase and the total miles traveled is y = 15000x.
a. Identify and interpret the rate of change.
Answer:
The rate of change is 15,000. It means that the mileage is increasing by 15,000 miles per year.

b. Identify and interpret the initial value.
Answer:
The initial value is 0. This means that there were no miles on the car when it was purchased.

c. Is the mileage increasing or decreasing each year according to the model? Explain your reasoning.
Answer:
Since the rate of change is positive, it means the mileage is increasing each year.

Exercise 8.
When someone purchases a new car and begins to drive it, generally speaking, the resale value of the car (in dollars) goes down each year. Let x represent the number of years since purchase and y represent the resale value of the car (in dollars). The linear function that models the resale value based on the number of years since purchase is
y = 20000 – 1200x.
a. Identify and interpret the rate of change.
Answer:
The rate of change is – 1,200. The resale value of the car is decreasing $1,200 every year since purchase.

b. Identify and interpret the initial value.
Answer:
The initial value is $20,000. The car’s value at the time of purchase was $20,000.

c. Is the resale value increasing or decreasing each year according to the model? Explain.
Answer:
The slope is negative. This means that the resale value decreases each year.

Exercise 9.
Suppose you are given the linear function y = 2.5x + 10.
a. Write a story that can be modeled by the given linear function.
Answer:
Answers will vary. I am ordering cupcakes for a birthday party. The bakery is going to charge $2.50 per cupcake in addition to a $10 decorating fee.

b. What is the rate of change? Explain its meaning with respect to your story.
Answer:
The rate of change is 2.5, which means that the cost increases $2.50 for every additional cupcake ordered.

c. What is the initial value? Explain its meaning with respect to your story.
Answer:
The initial value is 10, which in this story means that there is a flat fee of $10 to decorate the cupcakes.

Eureka Math Grade 8 Module 6 Lesson 2 Problem Set Answer Key

Question 1.
A rental car company offers the following two pricing methods for its customers to choose from for a
one – month rental:
Method 1: Pay $400 for the month, or
Method 2: Pay $0.30 per mile plus a standard maintenance fee of $35.
a. Construct a linear function that models the relationship between the miles driven and the total rental cost for Method 2. Let x represent the number of miles driven and y represent the rental cost (in dollars).
Answer:
y = 35 + 0.30x

b. If you plan to drive 1,100 miles for the month, which method would you choose? Explain your reasoning.
Answer:
Method 1 has a flat rate of $400 regardless of miles. Using Method 2, the cost would be $365
(y = 35 + 0.3(1100)). So, Method 2 would be preferred.

Question 2.
Recall from a previous lesson that Kelly wants to add new music to her MP3 player. She was interested in a monthly subscription site that offered its MP3 downloading service for a monthly subscription fee plus a fee per song. The linear function that modeled the total monthly cost in dollars (y) based on the number of songs downloaded (x) is
y = 5.25 + 0.30x.
The site has suddenly changed its monthly price structure. The linear function that models the new total monthly cost in dollars (y) based on the number of songs downloaded (x) is y = 0.35x + 4.50.
a. Explain the meaning of the value 4.50 in the new equation. Is this a better situation for Kelly than before?
Answer:
The initial value is 4.50 and means that the monthly subscription cost is now $4.50. This is lower than before, which is good for Kelly.

b. Explain the meaning of the value 0.35 in the new equation. Is this a better situation for Kelly than before?
Answer:
The rate of change is 0.35. This means that the cost is increasing by $0.35 for every song downloaded. This is more than the download cost for the original plan.

c. If you were to graph the two equations (old versus new), which line would have the steeper slope? What does this mean in the context of the problem?
Answer:
The slope of the new line is steeper because the new linear function has a greater rate of change. It means that the total monthly cost of the new plan is increasing at a faster rate per song compared to the cost of the old plan.

d. Which subscription plan provides the better value if Kelly downloads fewer than 15 songs per month?
Answer:
If Kelly were to download 15 songs, both plans will cost the same ($9.75). Therefore, the new plan is cheaper if Kelly downloads fewer than 15 songs.

Eureka Math Grade 8 Module 6 Lesson 2 Exit Ticket Answer Key

In 2008, a collector of sports memorabilia purchased 5 specific baseball cards as an investment. Let y represent each card’s resale value (in dollars) and x represent the number of years since purchase. Each card’s resale value after 0, 1, 2, 3, and 4 years could be modeled by linear equations as follows:
Card A: y = 5 – 0.7x
Card B: y = 4 + 2.6x
Card C: y = 10 + 0.9x
Card D: y = 10 – 1.1x
Card E: y = 8 + 0.25x

Question 1.
Which card(s) are decreasing in value each year? How can you tell?
Answer:
Cards A and D are decreasing in value, as shown by the negative values for rate of change in each equation.

Question 2.
Which card(s) had the greatest initial value at purchase (at 0 years)?
Answer:
Since all of the models are in slope – intercept form, Cards C and D have the greatest initial values at $10 each.

Question 3.
Which card(s) is increasing in value the fastest from year to year? How can you tell?
Answer:
Card B is increasing in value the fastest from year to year. Its model has the greatest rate of change.

Question 4.
If you were to graph the equations of the resale values of Card B and Card C, which card’s graph line would be steeper? Explain.
Answer:
The Card B line would be steeper because the function for Card B has the greatest rate of change; the card’s value is increasing at a faster rate than the other values of other cards.

Question 5.
Write a sentence explaining the 0.9 value in Card C’s equation.
Answer:
The 0.9 value means that Card C’s value increases by 90 cents per year.
Eureka Math Grade 8 Module 6 Lesson 3 Answer Key

Engage NY Eureka Math 8th Grade Module 6 Lesson 3 Answer Key

Eureka Math Grade 8 Module 6 Lesson 3 Example Answer Key

Example 1: Rate of Change and Initial Value Given in the Context of the Problem
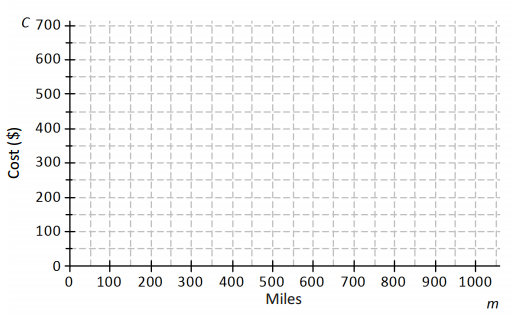
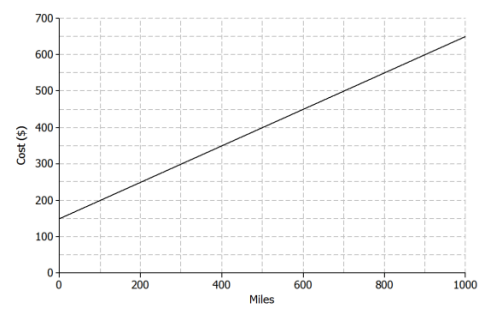
A truck rental company charges a $150 rental fee in addition to a charge of $0.50 per mile driven. Graph the linear function relating the total cost of the rental in dollars, C, to the number of miles driven, m, on the axes below.
Engage NY Math 8th Grade Module 6 Lesson 3 Example Answer Key 1
Answer:
Engage NY Math 8th Grade Module 6 Lesson 3 Example Answer Key 2

a. If the truck is driven 0 miles, what is the cost to the customer? How is this shown on the graph?
Answer:
$150, shown as the point (0, 150). This is the initial value. Some students might say “b.” Help them to use the term initial value.

b. What is the rate of change that relates cost to number of miles driven? Explain what it means within the context of the problem.
Answer:
The rate of change is 0.5. It means that the cost increases by $0.50 for every mile driven.

c. On the axes given, sketch the graph of the linear function that relates C to m.
Answer:
Students can plot the initial value (0, 150) and then use the rate of change to identify additional points as needed. A 1, 000-unit increase in m results in a 500-unit increase for C, so another point on the line is (1000, 650).

d. Write the equation of the linear function that models the relationship between number of miles driven and total rental cost.
Answer:
C = 0.5m + 150

Eureka Math Grade 8 Module 6 Lesson 3 Exercise Answer Key

Exercises
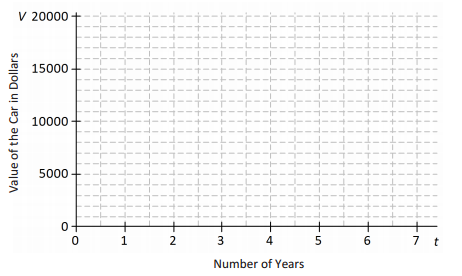
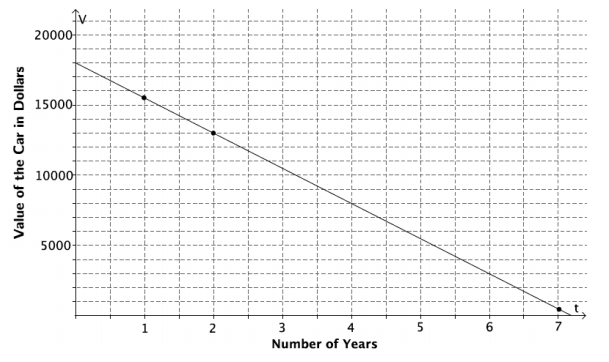
Jenna bought a used car for $18, 000. She has been told that the value of the car is likely to decrease by $2, 500 for each year that she owns the car. Let the value of the car in dollars be V and the number of years Jenna has owned the car be t.
Engage NY Math Grade 8 Module 6 Lesson 3 Exercise Answer Key 1
Answer:
Engage NY Math Grade 8 Module 6 Lesson 3 Exercise Answer Key 2

Exercise 1.
What is the value of the car when t = 0? Show this point on the graph.
Answer:
$18, 000. Shown by the point (0, 18000)

Exercise 2.
What is the rate of change that relates V to t? (Hint: Is it positive or negative? How can you tell?)
Answer:
-2, 500. The rate of change is negative because the value of the car is decreasing.

Exercise 3.
Find the value of the car when:
a. t = 1
Answer:
$18000 – $2500 = $15500

b. t = 2
Answer:
$18000 – 2($2500) = $13000

c. t = 7
Answer:
$18000 – 7($2500) = $500

Exercise 4.
Plot the points for the values you found in Exercise 3, and draw the line (using a straightedge) that passes through those points.
Answer:
See the graph above.

Exercise 5.
Write the linear function that models the relationship between the number of years Jenna has owned the car and the value of the car.
Answer:
V = 18000 – 2500t or V = -2500t + 18000

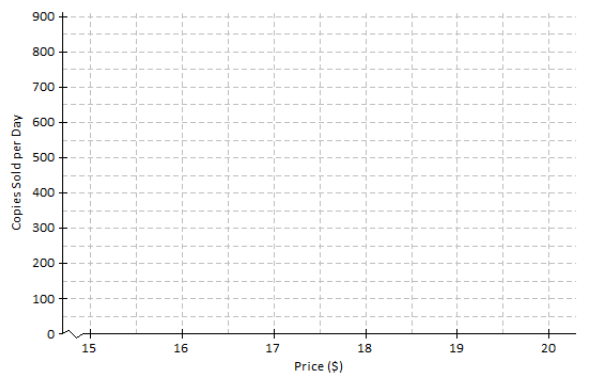
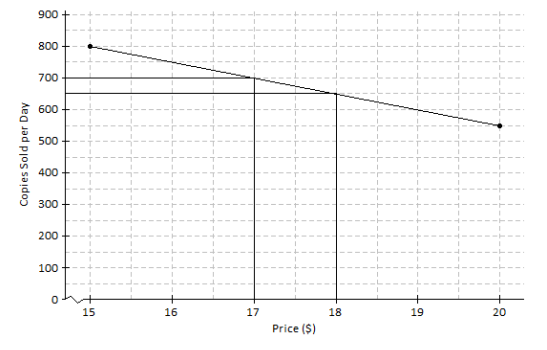
An online bookseller has a new book in print. The company estimates that if the book is priced at $15, then 800 copies of the book will be sold per day, and if the book is priced at $20, then 550 copies of the book will be sold per day.
Engage NY Math Grade 8 Module 6 Lesson 3 Exercise Answer Key 3
Answer:
Engage NY Math Grade 8 Module 6 Lesson 3 Exercise Answer Key 4

Exercise 6.
Identify the ordered pairs given in the problem. Then, plot both on the graph.
Answer:
The ordered pairs are (15, 800) and (20, 550). See the graph above.

Exercise 7.
Assume that the relationship between the number of books sold and the price is linear. (In other words, assume that the graph is a straight line.) Using a straightedge, draw the line that passes through the two points.
Answer:
See the graph above.

Exercise 8.
What is the rate of change relating number of copies sold to price?
Answer:
Between the points (15, 800) and (20, 550), the run is 5, and the rise is -(800-550) = -250. So, the rate of change is \(\frac{-250}{5}\) = -50.

Exercise 9.
Based on the graph, if the company prices the book at $18, about how many copies of the book can they expect to sell per day?
Answer:
650

Exercise 10.
Based on the graph, approximately what price should the company charge in order to sell 700 copies of the book per day?
Answer:
$17

Eureka Math Grade 8 Module 6 Lesson 3 Problem Set Answer Key

Question 1.
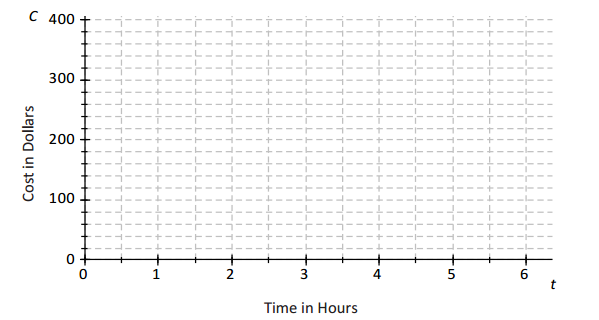
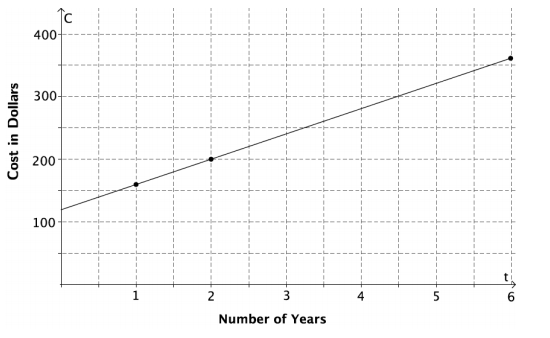
A plumbing company charges a service fee of $120, plus $40 for each hour worked. Sketch the graph of the linear function relating the cost to the customer (in dollars), C, to the time worked by the plumber (in hours), t, on the axes below.
Eureka Math 8th Grade Module 6 Lesson 3 Problem Set Answer Key 1
Answer:
Eureka Math 8th Grade Module 6 Lesson 3 Problem Set Answer Key 2

a. If the plumber works for 0 hours, what is the cost to the customer? How is this shown on the graph?
Answer:
$120 This is shown on the graph by the point (0, 120).

b. What is the rate of change that relates cost to time?
Answer:
40

c. Write a linear function that models the relationship between the hours worked and the cost to the customer.
Answer:
C = 40t + 120

d. Find the cost to the customer if the plumber works for each of the following number of hours.
i) 1 hour
Answer:
$160

ii) 2 hours
Answer:
$200

iii) 6 hours
Answer:
$360

e. Plot the points for these times on the coordinate plane, and use a straightedge to draw the line through the points.
Answer:
See the graph on the previous page.

Question 2.
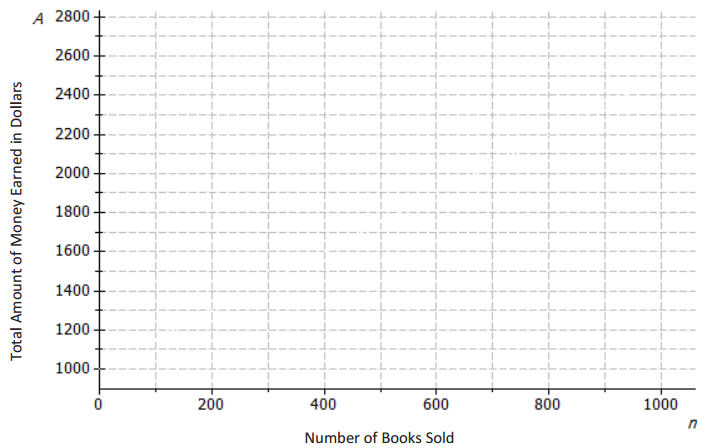
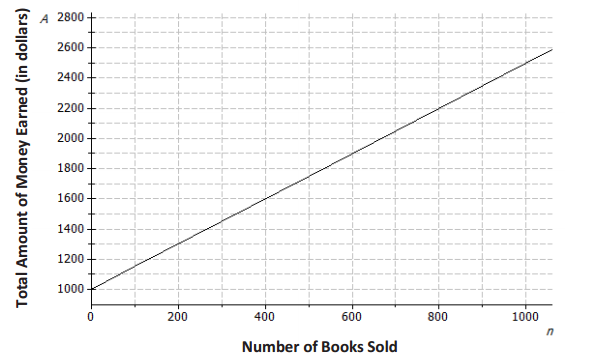
An author has been paid a writer’s fee of $1, 000 plus $1.50 for every copy of the book that is sold.
a. Sketch the graph of the linear function that relates the total amount of money earned in dollars, A, to the number of books sold, n, on the axes below.
Eureka Math 8th Grade Module 6 Lesson 3 Problem Set Answer Key 3
Answer:
Eureka Math 8th Grade Module 6 Lesson 3 Problem Set Answer Key 4

b. What is the rate of change that relates the total amount of money earned to the number of books sold?
Answer:
1.5

c. What is the initial value of the linear function based on the graph?
Answer:
1, 000

d. Let the number of books sold be n and the total amount earned be A. Construct a linear function that models the relationship between the number of books sold and the total amount earned.
Answer:
A = 1.5n + 1000

Question 3.
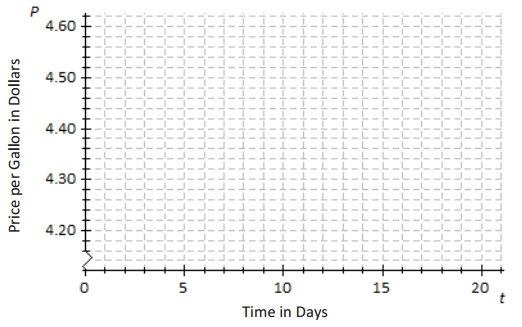
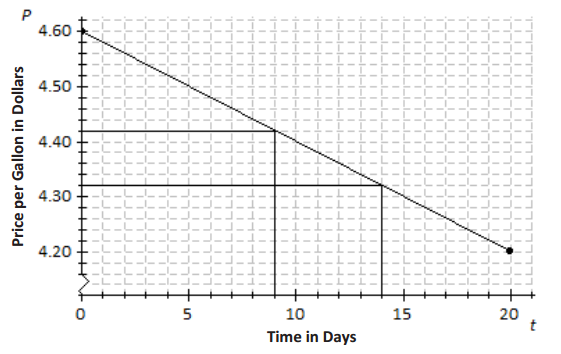
Suppose that the price of gasoline has been falling. At the beginning of last month (t = 0), the price was $4.60 per gallon. Twenty days later (t = 20), the price was $4.20 per gallon. Assume that the price per gallon, P, fell at a constant rate over the twenty days.
Eureka Math 8th Grade Module 6 Lesson 3 Problem Set Answer Key 5
Answer:
Eureka Math 8th Grade Module 6 Lesson 3 Problem Set Answer Key 6

a. Identify the ordered pairs given in the problem. Plot both points on the coordinate plane above.
Answer:
(0, 4.60) and (20, 4.20); see the graph above.

b. Using a straightedge, draw the line that contains the two points.
Answer:
See the graph above.

c. What is the rate of change? What does it mean within the context of the problem?
Answer:
Using points (0, 4.60) and (20, 4.20), the rate of change is -0.02 because \(\frac{4.20-4.60}{20-0}\) = \(\frac{-0.4}{20}\) = -0.02. The price of gas is decreasing $0.02 each day.

d. What is the function that models the relationship between the number of days and the price per gallon?
Answer:
P = -0.02t + 4.6

e. What was the price of gasoline after 9 days?
Answer:
$4.42; see the graph above.

f. After how many days was the price $4.32?
Answer:
14 days; see the graph above.

Eureka Math Grade 8 Module 6 Lesson 3 Exit Ticket Answer Key

Question 1.
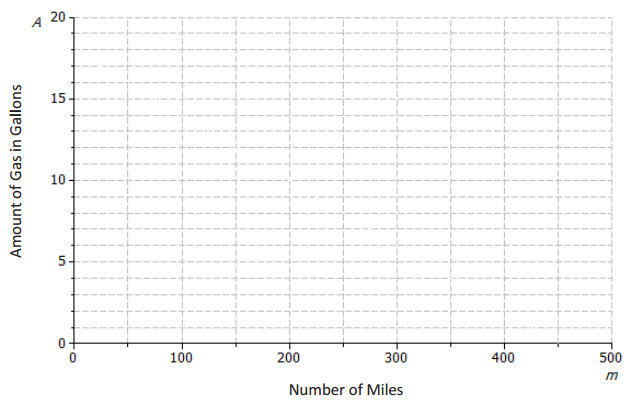
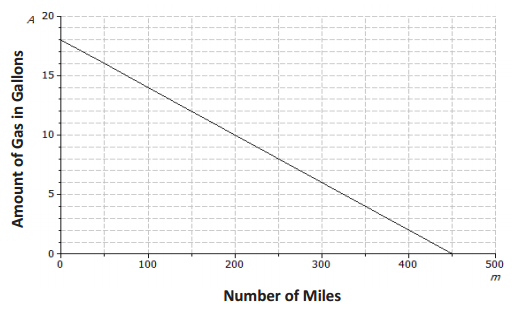
A car starts a journey with 18 gallons of fuel. Assuming a constant rate, the car consumes 0.04 gallon for every mile driven. Let A represent the amount of gas in the tank (in gallons) and m represent the number of miles driven.
Eureka Math Grade 8 Module 6 Lesson 3 Exit Ticket Answer Key 1
Answer:
Eureka Math Grade 8 Module 6 Lesson 3 Exit Ticket Answer Key 2

a. How much gas is in the tank if 0 miles have been driven? How would this be represented on the axes above?
Answer:
There are 18 gallons in the tank. This would be represented as (0, 18), the initial value, on the graph above.

b. What is the rate of change that relates the amount of gas in the tank to the number of miles driven? Explain what it means within the context of the problem.
Answer:
-0.04; the car consumes 0.04 gallon for every mile driven. It relates the amount of fuel to the miles driven.

c. On the axes above, draw the line that represents the graph of the linear function that relates A to m.
Answer:
See the graph above. Students can plot the initial value (0, 18) and then use the rate of change to identify additional points as needed. A 50-unit increase in m results in a 2-unit decrease for A, so another point on the line is (50, 16).

d. Write the linear function that models the relationship between the number of miles driven and the amount of gas in the tank.
Answer:
A = 18 – 0.04m or A = -0.04m + 18

Question 2.
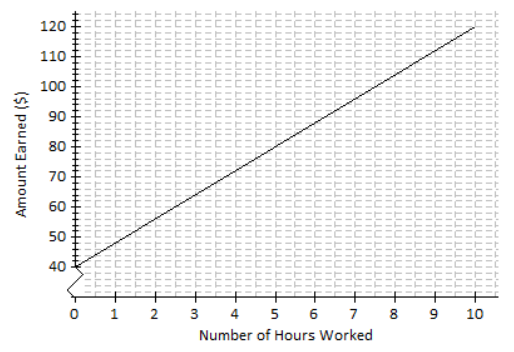
Andrew works in a restaurant. The graph below shows the relationship between the amount Andrew earns in dollars and the number of hours he works.
Eureka Math Grade 8 Module 6 Lesson 3 Exit Ticket Answer Key 3
a. If Andrew works for 7 hours, approximately how much does he earn in dollars?
Answer:
$96

b. Estimate how long Andrew has to work in order to earn $64.
Answer:
3 hours

c. What is the rate of change of the function given by the graph? Interpret the value within the context of the problem.
Answer:
Using the ordered pairs (7, 96) and (3, 64), the slope is 8. It means that the amount Andrew earns increases by $8 for every hour worked.

Eureka Math Grade 8 Module 6 Lesson 1 Answer Key

Engage NY Eureka Math 8th Grade Module 6 Lesson 1 Answer Key

Eureka Math Grade 8 Module 6 Lesson 1 Example Answer Key

Example 2: Another Rate Plan
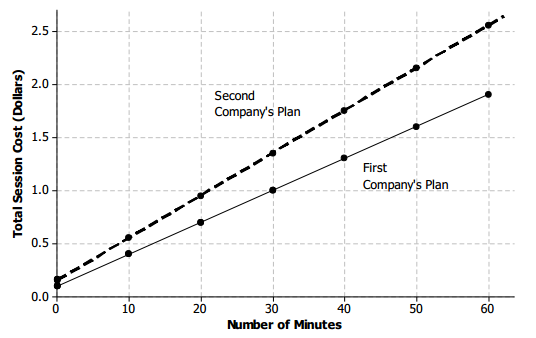
A second wireless access company has a similar method for computing its costs. Unlike the first company that Lenore was considering, this second company explicitly states its access fee is $0.15, and its usage rate is $0.04 per minute.
Total Session Cost = $0.15 + $0.04 (number of minutes)
Answer:
→ How is this plan presented differently?
In this case, we are given the access fee and usage rate with an equation. In the first example, just data points were given.

→ Based on the work with the first set of problems, how do you think the two plans are different?
The values for the access fee and usage charge per minute are different, or the initial value and the rate of change are different.

Eureka Math Grade 8 Module 6 Lesson 1 Exercise Answer Key

Exercises 1–6

Exercise 1.
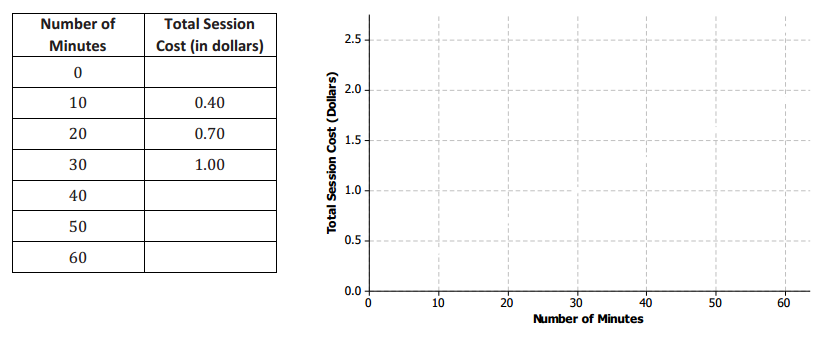
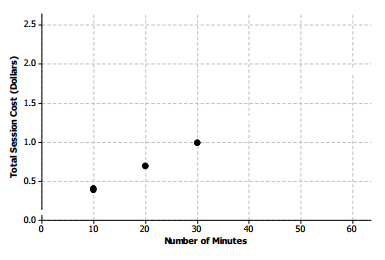
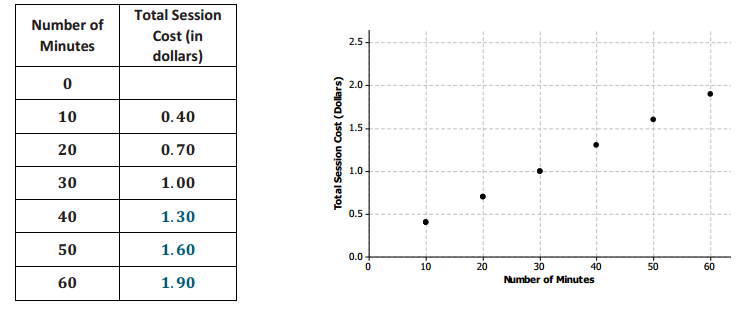
Lenore makes a table of this information and a graph where number of minutes is represented by the horizontal axis and total session cost is represented by the vertical axis. Plot the three given points on the graph. These three points appear to lie on a line. What information about the access plan suggests that the correct model is indeed a linear relationship?
Engage NY Math Grade 8 Module 6 Lesson 1 Exercise Answer Key 1
Answer:
The amount charged for the minutes connected is based upon a constant usage rate in dollars per minute.
Engage NY Math Grade 8 Module 6 Lesson 1 Exercise Answer Key 2.1

Exercise 2.
The rate of change describes how the total cost changes with respect to time.
a. When the number of minutes increases by 10 (e.g., from 10 minutes to 20 minutes or from 20 minutes to 30 minutes), how much does the charge increase?
Answer:
When the number of minutes increases by 10 (e.g., from 10 minutes to 20 minutes or from 20 minutes to 30 minutes), the cost increases by $0.30 (30 cents).

b. Another way to say this would be the usage charge per 10 minutes of use. Use that information to determine the increase in cost based on only 1 minute of additional usage. In other words, find the usage charge per minute of use.
Answer:
If $0.30 is the usage charge per 10 minutes of use, then $0.03 is the usage charge per 1 minute of use (i.e., the usage rate). Since the usage rate is constant, students should use what they have learned in Module 4.

Exercise 3.
The company’s pricing plan states that the usage rate is constant for any number of minutes connected to the Internet. In other words, the increase in cost for 10 more minutes of use (the value that you calculated in Exercise 2) is the same whether you increase from 20 to 30 minutes, 30 to 40 minutes, etc. Using this information, determine the total cost for 40 minutes, 50 minutes, and 60 minutes of use. Record those values in the table, and plot the corresponding points on the graph in Exercise 1.
Answer:
Consider the following table and graphs.
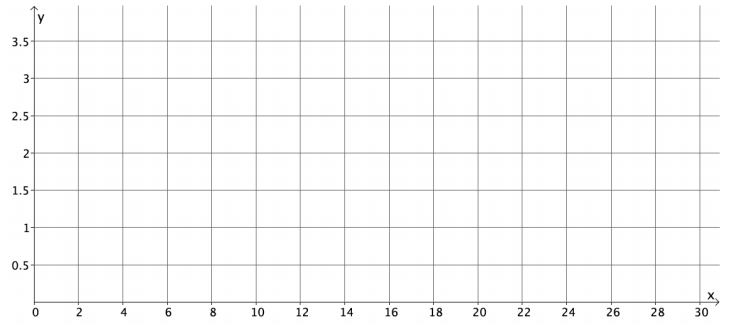
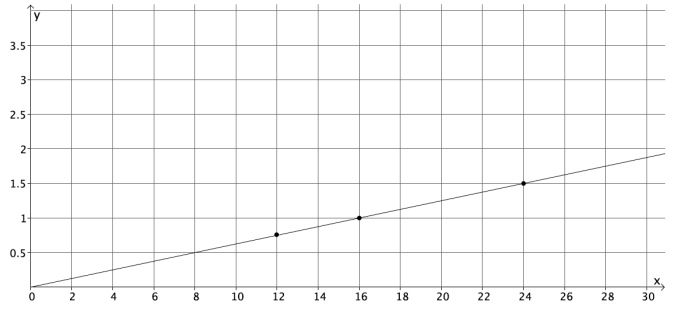
Engage NY Math Grade 8 Module 6 Lesson 1 Exercise Answer Key 3

Exercise 4.
Using the table and the graph in Exercise 1, compute the hypothetical cost for 0 minutes of use. What does that value represent in the context of the values that Lenore is trying to figure out?
Answer:
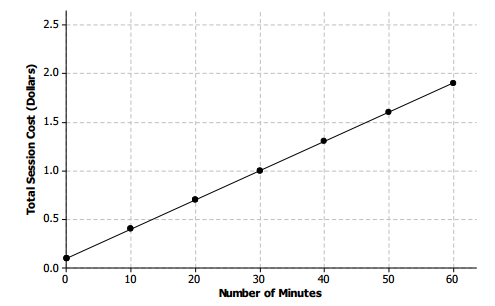
Since there is a $0.30 decrease in cost for each decrease of 10 minutes of use, one could subtract $0.30 from the cost value for 10 minutes and arrive at the hypothetical cost value for 0 minutes. That cost would be $0.10. Students may notice that such a value follows the regular pattern in the table and would represent the fixed access fee for connecting. (This value could also be found from the graph after completing Exercise 6.)

Exercise 5.
On the graph in Exercise 1, draw a line through the points representing 0 to 60 minutes of use under this company’s plan. The slope of this line is equal to the constant rate of change, which in this case is the usage rate.
Answer:
Engage NY Math Grade 8 Module 6 Lesson 1 Exercise Answer Key 4

Exercise 6.
Using x for the number of minutes and y for the total cost in dollars, write a function to model the linear relationship between minutes of use and total cost.
Answer:
y = 0.03x + 0.10

Exercises 7–16

Exercise 7.
Let x represent the number of minutes used and y represent the total session cost in dollars. Construct a linear function that models the total session cost based on the number of minutes used.
Answer:
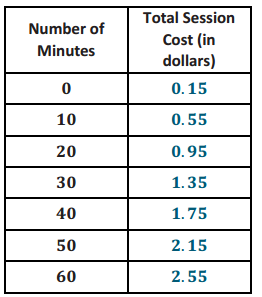
y = 0.04x + 0.15

Exercise 8.
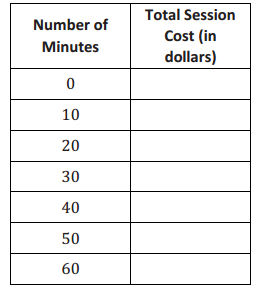
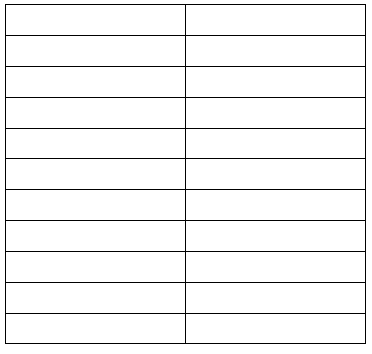
Using the linear function constructed in Exercise 7, determine the total session cost for sessions of 0, 10, 20, 30, 40, 50, and 60 minutes, and fill in these values in the table below.
Engage NY Math Grade 8 Module 6 Lesson 1 Exercise Answer Key 5
Answer:
Engage NY Math Grade 8 Module 6 Lesson 1 Exercise Answer Key 6

Exercise 9.
Plot these points on the original graph in Exercise 1, and draw a line through these points. In what ways does the line that represents this second company’s access plan differ from the line that represents the first company’s access plan?
Answer:
The second company’s plan line begins at a greater initial value. The same plan also increases in total cost more quickly over time; in other words, the slope of the line for the second company’s plan is steeper.
Engage NY Math Grade 8 Module 6 Lesson 1 Exercise Answer Key 7

Exercises 10–12

MP3 download sites are a popular forum for selling music. Different sites offer pricing that depends on whether or not you want to purchase an entire album or individual songs à la carte. One site offers MP3 downloads of individual songs with the following price structure: a $3 fixed fee for a monthly subscription plus a charge of $0.25 per song.
Exercise 10.
Using x for the number of songs downloaded and y for the total monthly cost in dollars, construct a linear function to model the relationship between the number of songs downloaded and the total monthly cost.
Answer:
Since $3 is the initial cost and there is a 25 cent increase per song, the function would be
y = 3 + 0.25x or y = 0.25x + 3.

Exercise 11.
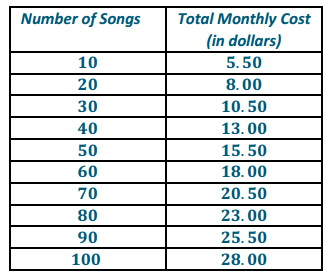
Using the linear function you wrote in Exercise 10, construct a table to record the total monthly cost (in dollars) for MP3 downloads of 10 songs, 20 songs, and so on up to 100 songs.
Engage NY Math Grade 8 Module 6 Lesson 1 Exercise Answer Key 8
Answer:
Engage NY Math Grade 8 Module 6 Lesson 1 Exercise Answer Key 9

Exercise 12.
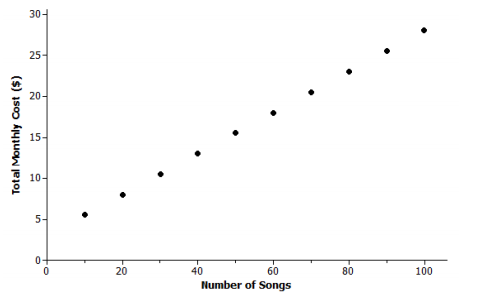
Plot the 10 data points in the table on a coordinate plane. Let the x-axis represent the number of songs downloaded and the y-axis represent the total monthly cost (in dollars) for MP3 downloads.
Answer:
Engage NY Math Grade 8 Module 6 Lesson 1 Exercise Answer Key 10

A band will be paid a flat fee for playing a concert. Additionally, the band will receive a fixed amount for every ticket sold. If 40 tickets are sold, the band will be paid $200. If 70 tickets are sold, the band will be paid $260.
Exercise 13.
Determine the rate of change.
Answer:
The points (40,200) and (70,260) have been given.
So, the rate of change is 2 because \(\frac{260-200}{70-40}\) = 2.

Exercise 14.
Let x represent the number of tickets sold and y represent the amount the band will be paid in dollars. Construct a linear function to represent the relationship between the number of tickets sold and the amount the band will be paid.
Answer:
Using the rate of change and (40,200):
200 = 2(40) + b
200 = 80 + b
120 = b
Therefore, the function is y = 2x + 120.

Exercise 15.
What flat fee will the band be paid for playing the concert regardless of the number of tickets sold?
Answer:
The band will be paid a flat fee of $120 for playing the concert.

Exercise 16.
How much will the band receive for each ticket sold?
Answer:
The band receives $2 per ticket.

Eureka Math Grade 8 Module 6 Lesson 1 Problem Set Answer Key

Question 1.
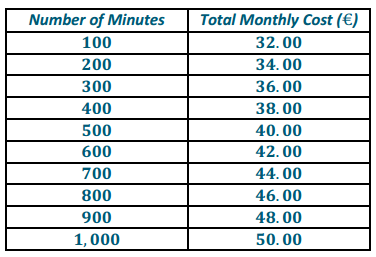
Recall that Lenore was investigating two wireless access plans. Her friend in Europe says that he uses a plan in which he pays a monthly fee of 30 euro plus 0.02 euro per minute of use.
a. Construct a table of values for his plan’s monthly cost based on 100 minutes of use for the month, 200 minutes of use, and so on up to 1,000 minutes of use. (The charge of 0.02 euro per minute of use is equivalent to 2 euro per 100 minutes of use.)
Answer:
Eureka Math 8th Grade Module 6 Lesson 1 Problem Set Answer Key 1

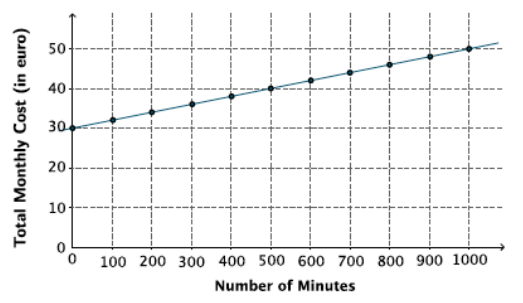
b. Plot these 10 points on a carefully labeled graph, and draw the line that contains these points.
Eureka Math 8th Grade Module 6 Lesson 1 Problem Set Answer Key 3
Answer:

c. Let x represent minutes of use and y represent the total monthly cost in euro. Construct a linear function that determines the monthly cost based on minutes of use.
Answer:
y = 30 + 0.02x

d. Use the function to calculate the cost under this plan for 750 minutes of use. If this point were added to the graph, would it be above the line, below the line, or on the line?
Answer:
The cost for 750 minutes would be €45. The point (750,45) would be on the line.

Question 2.
A shipping company charges a $4.45 handling fee in addition to $0.27 per pound to ship a package.
a. Using x for the weight in pounds and y for the cost of shipping in dollars, write a linear function that determines the cost of shipping based on weight.
Answer:
y = 4.45 + 0.27x

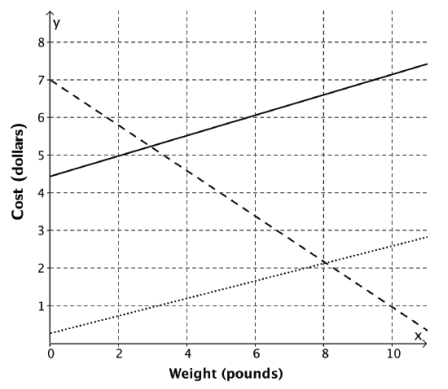
b. Which line (solid, dotted, or dashed) on the following graph represents the shipping company’s pricing method? Explain.
Eureka Math 8th Grade Module 6 Lesson 1 Problem Set Answer Key 4
Answer:
The solid line would be the correct line. Its initial value is 4.45, and its slope is 0.27. The dashed line shows the cost decreasing as the weight increases, so that is not correct. The dotted line starts at an initial value that is too low.

Question 3.
Kelly wants to add new music to her MP3 player. Another subscription site offers its downloading service using the following: Total Monthly Cost = 5.25 + 0.30(number of songs).
a. Write a sentence (all words, no math symbols) that the company could use on its website to explain how it determines the price for MP3 downloads for the month.
Answer:
“We charge a $5.25 subscription fee plus 30 cents per song downloaded.”

b. Let x represent the number of songs downloaded and y represent the total monthly cost in dollars. Construct a function to model the relationship between the number of songs downloaded and the total monthly cost.
Answer:
y = 5.25 + 0.30x

c. Determine the cost of downloading 10 songs.
Answer:
5.25 + 0.30(10) = 8.25
The cost of downloading 10 songs is $8.25.

Question 4.
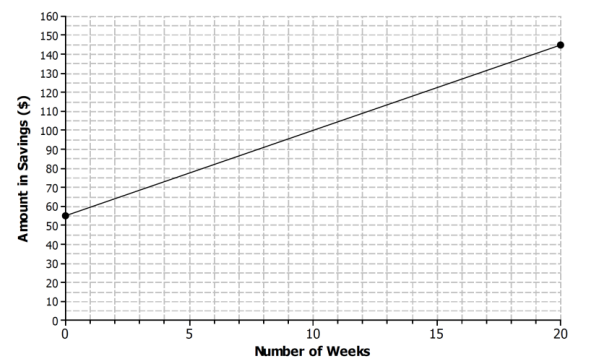
Li Na is saving money. Her parents gave her an amount to start, and since then she has been putting aside a fixed amount each week. After six weeks, Li Na has a total of $82 of her own savings in addition to the amount her parents gave her. Fourteen weeks from the start of the process, Li Na has $118.
a. Using x for the number of weeks and y for the amount in savings (in dollars), construct a linear function that describes the relationship between the number of weeks and the amount in savings.
Answer:
The points (6, 82) and (14, 118) have been given.
So, the rate of change is 4.5 because \(\frac{118-82}{14-6}\) = \(\frac{36}{8}\) = 4.5.
Using the rate of change and (6, 82):
82 = 4.5(6) + b
82 = 27 + b
55 = b
The function is y = 4.5x + 55.

b. How much did Li Na’s parents give her to start?
Answer:
Li Na’s parents gave her $55 to start.

c. How much does Li Na set aside each week?
Answer:
Li Na is setting aside $4.50 every week for savings.

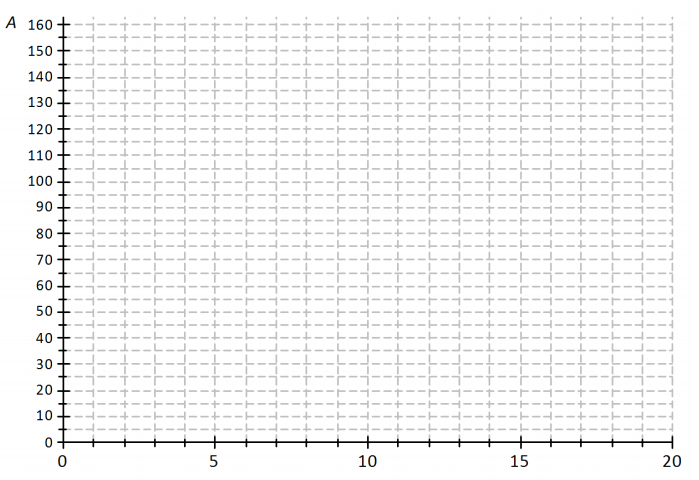
d. Draw the graph of the linear function below (start by plotting the points for x = 0 and x = 20).
Eureka Math 8th Grade Module 6 Lesson 1 Problem Set Answer Key 5
Answer:
Eureka Math 8th Grade Module 6 Lesson 1 Problem Set Answer Key 6

Eureka Math Grade 8 Module 6 Lesson 1 Exit Ticket Answer Key

A rental car company offers a rental package for a midsize car. The cost comprises a fixed $30 administrative fee for the cleaning and maintenance of the car plus a rental cost of $35 per day.
Question 1.
Using x for the number of days and y for the total cost in dollars, construct a function to model the relationship between the number of days and the total cost of renting a midsize car.
Answer:
y = 35x + 30

Question 2.
The same company is advertising a deal on compact car rentals. The linear function y = 30x + 15 can be used to model the relationship between the number of days, x, and the total cost in dollars, y, of renting a compact car.
a. What is the fixed administrative fee?
Answer:
The administrative fee is $15.

b. What is the rental cost per day?
Answer:
It costs $30 per day to rent the compact car.

Eureka Math Grade 8 Module 5 Lesson 6 Answer Key

Engage NY Eureka Math 8th Grade Module 5 Lesson 6 Answer Key

Eureka Math Grade 8 Module 5 Lesson 6 Exercise Answer Key

Exercise
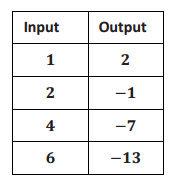
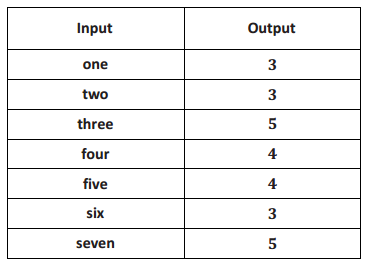
A function assigns to the inputs shown the corresponding outputs given in the table below.
Engage NY Math Grade 8 Module 5 Lesson 6 Exercise Answer Key 1
a. Do you suspect the function is linear? Compute the rate of change of this data for at least three pairs of inputs and their corresponding outputs.
Answer:
\(\frac{2 – ( – 1)}{1 – 2}\) = \(\frac{3}{ – 1}\)
= – 3

\(\frac{ – 7 – ( – 13)}{4 – 6}\) = \(\frac{6}{ – 2}\)
= – 3

\(\frac{2 – ( – 7)}{1 – 4}\) = \(\frac{9}{ – 3}\)
= – 3
Yes, the rate of change is the same when I check pairs of inputs and corresponding outputs. Each time it is equal to – 3. Since the rate of change is the same, then I know it is a linear function.

b. What equation seems to describe the function?
Answer:
Using the assignment of 2 to 1:
2 = – 3(1) + b
2 = – 3 + b
5 = b
The equation that seems to describe the function is y = – 3x + 5.

c. As you did not verify that the rate of change is constant across all input/output pairs, check that the equation you found in part (a) does indeed produce the correct output for each of the four inputs 1, 2, 4, and 6.
Answer:
For x = 1 we have y = – 3(1) + 5 = 2.
For x = 2 we have y = – 3(2) + 5 = – 1.
For x = 4 we have y = – 3(4) + 5 = – 7.
For x = 6 we have y = – 3(6) + 5 = – 13.
These are correct.

d. What will the graph of the function look like? Explain.
Answer:
The graph of the function will be a plot of four points lying on a common line. As we were not told about any other inputs for this function, we must assume for now that there are only these four input values for the function.
The four points lie on the line with equation y = – 3x + 5.

Eureka Math Grade 8 Module 5 Lesson 6 Problem Set Answer Key

Question 1.
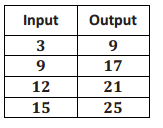
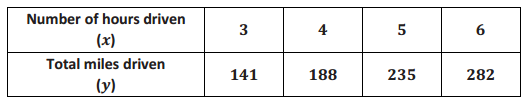
A function assigns to the inputs given the corresponding outputs shown in the table below.
Eureka Math 8th Grade Module 5 Lesson 6 Problem Set Answer Key 1
a. Does the function appear to be linear? Check at least three pairs of inputs and their corresponding outputs.
\(\frac{9 – 17}{3 – 9}\) = \(\frac{ – 8}{ – 6}\)
= \(\frac{4}{3}\)

\(\frac{17 – 21}{9 – 12}\) = \(\frac{ – 4}{ – 3}\)
= \(\frac{4}{3}\)

\(\frac{21 – 25}{12 – 15}\) = \(\frac{ – 4}{ – 3}\)
= \(\frac{4}{3}\)
Yes. The rate of change is the same when I check pairs of inputs and corresponding outputs. Each time it is equal to \(\frac{4}{3}\). Since the rate of change is the same, the function does appear to be linear.

b. Find a linear equation that describes the function.
Answer:
Using the assignment of 9 to 3
9 = \(\frac{4}{3}\) (3) + b
9 = 4 + b
5 = b
The equation that describes the function is y = \(\frac{4}{3}\) x + 5. (We check that for each of the four inputs given, this equation does indeed produce the correct matching output.)

c. What will the graph of the function look like? Explain.
Answer:
The graph of the function will be four points in a row. They all lie on the line given by the equation
y = \(\frac{4}{3}\) x + 5.

Question 2.
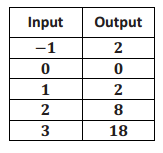
A function assigns to the inputs given the corresponding outputs shown in the table below.
Eureka Math 8th Grade Module 5 Lesson 6 Problem Set Answer Key 2
a. Is the function a linear function?
Answer:
\(\frac{2 – 0}{ – 1 – 0}\) = \(\frac{2}{ – 1}\)
= – 2

\(\frac{0 – 2}{0 – 1}\) = \(\frac{ – 2}{ – 1}\)
= 2
No. The rate of change is not the same when I check the first two pairs of inputs and corresponding outputs. All rates of change must be the same for all inputs and outputs for the function to be linear.

b. What equation describes the function?
Answer:
I am not sure what equation describes the function. It is not a linear function.

Question 3.
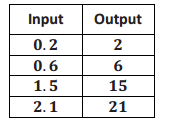
A function assigns the inputs and corresponding outputs shown in the table below.
Eureka Math 8th Grade Module 5 Lesson 6 Problem Set Answer Key 3
a. Does the function appear to be linear? Check at least three pairs of inputs and their corresponding outputs..
Answer:
\(\frac{2 – 6}{0.2 – 0.6}\) = \(\frac{ – 4}{ – 0.4}\)
= 10

\(\frac{6 – 15}{0.6 – 1.5}\) = \(\frac{ – 9}{ – 0.9}\)
= 10

\(\frac{15 – 21}{1.5 – 2.1}\) = \(\frac{ – 6}{ – 0.6}\)
= 10
Yes. The rate of change is the same when I check pairs of inputs and corresponding outputs. Each time it is equal to 10. The function appears to be linear.

b. Find a linear equation that describes the function.
Answer:
Using the assignment of 2 to 0.2:
2 = 10(0.2) + b
2 = 2 + b
0 = b
The equation that describes the function is y = 10x . It clearly fits the data presented in the table.

c. What will the graph of the function look like? Explain.
Answer:
The graph will be four distinct points in a row. They all sit on the line given by the equation y = 10x.

Question 4.
Martin says that you only need to check the first and last input and output values to determine if the function is linear. Is he correct? Explain.
Answer:
No, he is not correct. For example, consider the function with input and output values in this table.
Eureka Math 8th Grade Module 5 Lesson 6 Problem Set Answer Key 4

Using the first and last input and output, the rate of change is
\(\frac{9 – 12}{1 – 3}\) = \(\frac{ – 3}{ – 2}\)
= \(\frac{3}{2}\)
But when you use the first two inputs and outputs, the rate of change is
\(\frac{9 – 10}{1 – 2}\) = \(\frac{ – 1}{ – 1}\)
= 1
Note to teacher: Accept any example where the rate of change is different for any two inputs and outputs.

Question 5.
Is the following graph a graph of a linear function? How would you determine if it is a linear function?
Eureka Math 8th Grade Module 5 Lesson 6 Problem Set Answer Key 5
Answer:
It appears to be a linear function. To check, I would organize the coordinates in an input and output table. Next, I would check to see that all the rates of change are the same. If they are the same rates of change, I would use the equation y = mx + b and one of the assignments to write an equation to solve for b. That information would allow me to determine the equation that represents the function.

Question 6.
A function assigns to the inputs given the corresponding outputs shown in the table below.
Eureka Math 8th Grade Module 5 Lesson 6 Problem Set Answer Key 6
a. Does the function appear to be a linear function?
Answer:
\(\frac{ – 6 – ( – 5)}{ – 6 – ( – 5)}\) = \(\frac{1}{1}\)
= 1

\(\frac{ – 5 – ( – 5)}{ – 5 – ( – 5)}\) = \(\frac{1}{1}\)
= 1

\(\frac{ – 4 – ( – 2)}{ – 4 – ( – 2)}\) = \(\frac{2}{2}\)
= 1
Yes. The rate of change is the same when I check pairs of inputs and corresponding outputs. Each time it is equal to 1. Since the rate of change is constant so far, it could be a linear function.

b. What equation describes the function?
Answer:
Clearly the equation y = x fits the data. It is a linear function.

c. What will the graph of the function look like? Explain.
Answer:
The graph of the function will be four distinct points in a row. These four points lie on the line given by the equation y = x.

Eureka Math Grade 8 Module 5 Lesson 6 Exit Ticket Answer Key

Question 1.
Sylvie claims that a function with the table of inputs and outputs below is a linear function. Is she correct? Explain.
Eureka Math Grade 8 Module 5 Lesson 6 Exit Ticket Answer Key 1
Answer:
\(\frac{ – 25 – (10)}{ – 3 – 2}\) = \(\frac{ – 35}{ – 5}\)
= 7

\(\frac{10 – 31}{2 – 5}\) = \(\frac{ – 21}{ – 3}\)
= 7

\(\frac{31 – 54}{5 – 8}\) = \(\frac{ – 23}{ – 3}\)
= \(\frac{23}{3}\)
No, this is not a linear function. The rate of change was not the same for each pair of inputs and outputs inspected, which means that it is not a linear function.

Question 2.
A function assigns the inputs and corresponding outputs shown in the table to the right.
a. Does the function appear to be linear? Check at least three pairs of inputs and their corresponding outputs.
Eureka Math Grade 8 Module 5 Lesson 6 Exit Ticket Answer Key 2
Answer:
\(\frac{3 – ( – 2)}{ – 2 – 8}\) = \(\frac{5}{ – 10}\) = – \(\frac{1}{2}\)
\(\frac{ – 2 – ( – 3)}{8 – 10}\) = \(\frac{1}{ – 2}\) = – \(\frac{1}{2}\)
\(\frac{ – 3 – ( – 8)}{10 – 20}\) = \(\frac{5}{ – 10}\) = – \(\frac{1}{2}\)
Yes. The rate of change is the same when I check pairs of inputs and corresponding outputs. Each time it is equal to – \(\frac{1}{2}\) . Since the rate of change is the same for at least these three examples, the function could well be linear.

b. Can you write a linear equation that describes the function?
Answer:
We suspect we have an equation of the form y = – \(\frac{1}{2}\) x + b. Using the assignment of 3 to – 2:
3 = – \(\frac{1}{2}\) ( – 2) + b
3 = 1 + b
2 = b
The equation that describes the function might be y = – \(\frac{1}{2}\) x + 2.
Checking: When x = – 2, we get y = – \(\frac{1}{2}\) ( – 2) + 2 = 3. When x = 8, we get y = – \(\frac{1}{2}\) (8) + 2 = – 2. When x = 10, we get y = – \(\frac{1}{2}\) (10) + 2 = – 3. When x = 20, we get y = – \(\frac{1}{2}\) (20) + 2 = – 8.
It works.

c. What will the graph of the function look like? Explain.
Answer:
The graph of the function will be four distinct points all lying in a line. (They all lie on the line with equation y = – \(\frac{1}{2}\) x + 2 ).

Eureka Math Grade 8 Module 5 Lesson 6 Multi – Step Equations I Answer Key

Set 1:
3x + 2 = 5x + 6
4(5x + 6) = 4(3x + 2)
\(\frac{3x + 2}{6}\) = \(\frac{5x + 6}{6}\)
Answer:
Answer for each problem in this set is x = – 2.

Set 2:
6 – 4x = 10x + 9
– 2( – 4x + 6) = – 2(10x + 9)
\(\frac{10x + 9}{5}\) = \(\frac{6 – 4x}{5}\)
Answer:
Answer for each problem in this set is x = – \(\frac{3}{14}\).

Set 3:
5x + 2 = 9x – 18
8x + 2 – 3x = 7x – 18 + 2x
\(\frac{2 + 5x}{3}\) = \(\frac{7x – 18 + 2x}{3}\)
Answer:
Answer for each problem in this set is x = 5.

Eureka Math Grade 8 Module 5 End of Module Assessment Answer Key

Engage NY Eureka Math 8th Grade Module 5 End of Module Assessment Answer Key

Eureka Math Grade 8 Module 5 End of Module Assessment Task Answer Key

Question 1.
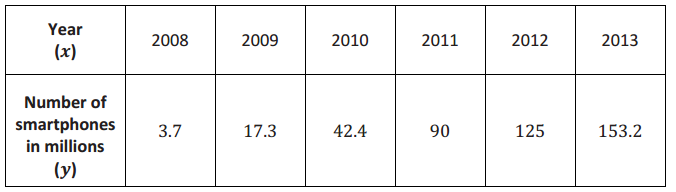
a. We define x as a year between 2008 and 2013 and y as the total number of smartphones sold that year, in millions. The table shows values of x and corresponding y values.
Engage NY Math 8th Grade Module 5 End of Module Assessment Answer Key 1
i) How many smartphones were sold in 2009?
Answer:
17.3 Million Smartphones were sold in 2009

ii) In which year were 90 million smartphones sold?
Answer:
90 Million Smartphones were sold in 2011

iii) Is y a function of x? Explain why or why not.
Answer:
Yes, It is a function because for each input there is exactly one output. Specifically only one number will be assigned to represent the number of smartphones sold in the given year.
b. Randy began completing the table below to represent a particular linear function. Write an equation to represent the function he was using and complete the table for him.
Engage NY Math 8th Grade Module 5 End of Module Assessment Answer Key 2
Answer:
Engage NY Math 8th Grade Module 5 End of Module Assessment Answer Key 9
y = 3x + 4

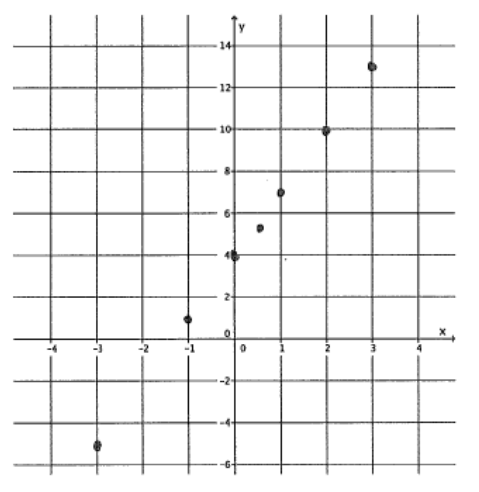
c. Create the graph of the function in part (b).
Engage NY Math 8th Grade Module 5 End of Module Assessment Answer Key 3
Answer:
Engage NY Math 8th Grade Module 5 End of Module Assessment Answer Key 10

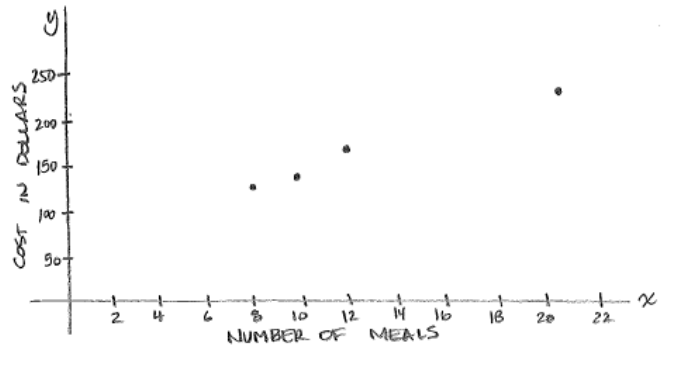
d. At NYU in 2013, the cost of the weekly meal plan options could be described as a function of the number of meals. Is the cost of the meal plan a linear or nonlinear function? Explain.

8 meals: $125/week
10 meals: $135/week
12 meals: $155/week
21 meals: $220/week
Answer:
\(\frac{125}{8}\) = 15.625
\(\frac{135}{10}\) = 13.5
\(\frac{155}{12}\) = 12.917
\(\frac{220}{21}\) = 10.476
The cost of the meal plan is a nonlinear function. The cost per meal is different based on the plan. Chosen for example, one plan charges almost $16 per meal while another is about $10. Also, when the data is graphed, The points do not fall on a line.
Engage NY Math 8th Grade Module 5 End of Module Assessment Answer Key 11

Question 2.
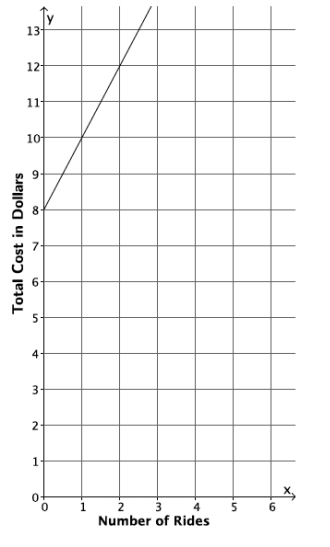
The cost to enter and go on rides at a local water park, Wally’s Water World, is shown in the graph below.
Engage NY Math 8th Grade Module 5 End of Module Assessment Answer Key 4
A new water park, Tony’s Tidal Takeover, just opened. You have not heard anything specific about how much it costs to go to this park, but some of your friends have told you what they spent. The information is organized in the table below.
Engage NY Math 8th Grade Module 5 End of Module Assessment Answer Key 5
Each park charges a different admission fee and a different fee per ride, but the cost of each ride remains the same.
a. If you only have $14 to spend, which park would you attend (assume the rides are the same quality)? Explain.
Answer:
Let x represent the number of rides
Let w represent the total cost at wally’s water world
W = 2x + 8
Wally’s
W = 2x + 8
14 = 2x + 8
6 = 2x
3 = x

Tony’s
T = 0.75x + 12
14 = 0.75x + 12
2 = 0.75x
2.67 ≈ x
At wally’s you can go in 3 rides with $14, At tony’s just 2 rides. I would go to wally’s because i could go on more rides.

b. Another water park, Splash, opens, and they charge an admission fee of $30 with no additional fee for rides. At what number of rides does it become more expensive to go to Wally’s Water World than Splash? At what number of rides does it become more expensive to go to Tony’s Tidal Takeover than Splash?
Answer:
Let S represent total cost at splash, S = 30
Wally’s
30 = 2x + 8
22 = 2x
11 = x

Tony’s
30 = 0.75x + 12
18 = 0.75x
24 = x
At Wally’s you can go on 11 rides with $30. The 12th ride makes wally’s more expensive than splash.
At Tony’s you can go on 24 rides with $30. The 25th ride makes tony’s more expensive than splash.

c. For all three water parks, the cost is a function of the number of rides. Compare the functions for all three water parks in terms of their rate of change. Describe the impact it has on the total cost of attending each park.
Answer:
Wally’s rate of change is 2, $2 per ride.
Tony’s rate of change is 0.75, $0.75 per ride.
Splash’s rate of change is 0, $0 extra per ride.
Wally’s has the greatest rate of change that means that the total cost at wally’s will increase the fastest as we go on more rides. At tony’s the rate of change is just 0.75 so the total cost increases with the number of rides we go on, but not as quickly as wally’s. Splash has a rate of change of zero, The number of rides we go on does not impact the total cost at all.

Question 3.
For each part below, leave your answers in terms of π.
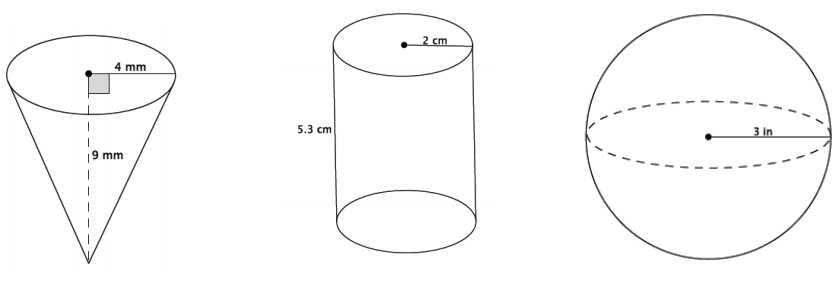
a. Determine the volume for each three-dimensional figure shown below.
Engage NY Math 8th Grade Module 5 End of Module Assessment Answer Key 6
Answer:
V = \(\frac{1}{3}\) π (16)(9)
= (16)(3)π
= 48 π
The volume is 48 π mm2

V = π (4)(5.3)
= π (21.2)
= 21.2 π
The volume is 21.2 π cm3.

V = \(\frac{4}{3}\) π (32)
= 4(9) π
= 36 π
The volume is 36 πin3

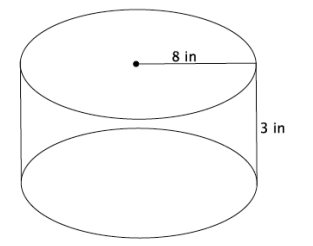
b. You want to fill the cylinder shown below with water. All you have is a container shaped like a cone with a radius of 3 inches and a height of 5 inches; you can use this cone-shaped container to take water from a faucet and fill the cylinder. How many cones will it take to fill the cylinder?
Engage NY Math 8th Grade Module 5 End of Module Assessment Answer Key 7
Answer:
Volume of cylinder = π (64) (3)
= 192 π
Volume of cone = \(\frac{1}{3}\) π (9) (5)
= \(\frac{45}{3}\) π
= 15 π
The volume of cylinder is 192 π in3
The volume of cone is 15 π in3
\(\frac{192 \pi}{15 \pi}\) = \(\frac{192}{15}\) = 12.8
It takes 12.8 cone of the given size to fill the cylinder.

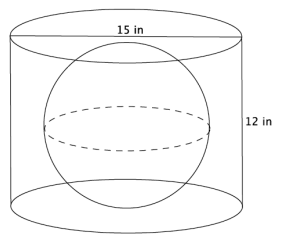
c. You have a cylinder with a diameter of 15 inches and height of 12 inches. What is the volume of the largest sphere that will fit inside of it?
Engage NY Math 8th Grade Module 5 End of Module Assessment Answer Key 8
Answer:
The cylinder has radius of 7.5 cm, but the height is just 12 cm. That means the maximum radius for the sphere is 6 cm. Anything larger would not fit in the cylinder. Then the volume of the largest sphere that will fit in the cylinder is 288 in3.
V= \(\frac{4}{3}\) π (63)
= \(\frac{4}{3}\) π (216)
= 288 π

Eureka Math Grade 8 Module 5 Lesson 11 Answer Key

Engage NY Eureka Math 8th Grade Module 5 Lesson 11 Answer Key

Eureka Math Grade 8 Module 5 Lesson 11 Example Answer Key

Example 1.
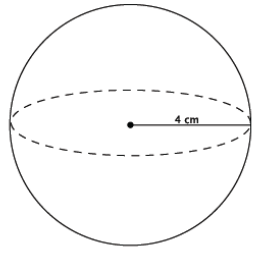
Compute the exact volume for the sphere shown below.
Engage NY Math 8th Grade Module 5 Lesson 11 Example Answer Key 1
Answer:
Provide students time to work; then, have them share their solutions.
Sample student work:
V = \(\frac{4}{3}\) πr3
= \(\frac{4}{3}\) π(43 )
= \(\frac{4}{3}\) π(64)
= \(\frac{256}{3}\) π
= 85 \(\frac{1}{3}\) π
The volume of the sphere is 85 \(\frac{1}{3}\) π cm3.

Example 2.
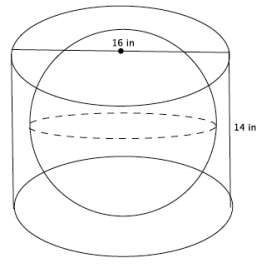
A cylinder has a diameter of 16 inches and a height of 14 inches. What is the volume of the largest sphere that will fit into the cylinder?
Engage NY Math 8th Grade Module 5 Lesson 11 Example Answer Key 2
Answer:
→ What is the radius of the base of the cylinder?
The radius of the base of the cylinder is 8 inches.

→ Could the sphere have a radius of 8 inches? Explain.
No. If the sphere had a radius of 8 inches, then it would not fit into the cylinder because the height is only 14 inches. With a radius of 8 inches, the sphere would have a height of 2r, or 16 inches. Since the cylinder is only 14 inches high, the radius of the sphere cannot be 8 inches.

→ What size radius for the sphere would fit into the cylinder? Explain.
A radius of 7 inches would fit into the cylinder because 2r is 14, which means the sphere would touch the top and bottom of the cylinder. A radius of 7 means the radius of the sphere would not touch the sides of the cylinder, but would fit into it.

→ Now that we know the radius of the largest sphere is 7 inches, what is the volume of the sphere?
Sample student work:
V = \(\frac{4}{3}\) πr3
= \(\frac{4}{3}\) π(73 )
= \(\frac{4}{3}\) π(343)
= \(\frac{1372}{3}\) π
= 457 \(\frac{1}{3}\) π
The volume of the sphere is 457 \(\frac{1}{3}\) π cm3.

Eureka Math Grade 8 Module 5 Lesson 11 Exercise Answer Key

Exercises 1–3

Exercise 1.
What is the volume of a cylinder?
Answer:
V = πr2 h

Exercise 2.
What is the height of the cylinder?
Answer:
The height of the cylinder is the same as the diameter of the sphere. The diameter is 2r.

Exercise 3.
If volume(sphere) = 2/3 volume(cylinder with same diameter and height), what is the formula for the volume of a sphere?
Answer:
Volume(sphere) = \(\frac{2}{3}\) (πr2h)
Volume(sphere) = \(\frac{2}{3}\) (πr22r)
Volume(sphere) = \(\frac{4}{3}\) (πr3)

Exercises 4–8

Exercise 4.
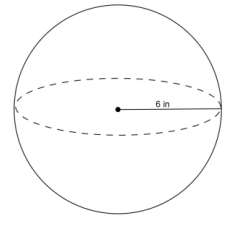
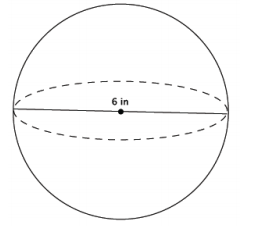
Use the diagram and the general formula to find the volume of the sphere.
Engage NY Math Grade 8 Module 5 Lesson 11 Exercise Answer Key 1
Answer:
V = \(\frac{4}{3}\) πr3
V = \(\frac{4}{3}\) π(63 )
V ≈ 288π
The volume of the sphere is about 288π in3.

Exercise 5.
The average basketball has a diameter of 9.5 inches. What is the volume of an average basketball? Round your answer to the tenths place.
Answer:
V = \(\frac{4}{3}\) πr3
V = \(\frac{4}{3}\) π(4.753 )
V = \(\frac{4}{3}\) π(107.17)
V ≈ 142.9π
The volume of an average basketball is about 142.9π in3.

Exercise 6.
A spherical fish tank has a radius of 8 inches. Assuming the entire tank could be filled with water, what would the volume of the tank be? Round your answer to the tenths place.
Answer:
V = \(\frac{4}{3}\) πr3
V = \(\frac{4}{3}\) π(83 )
V = \(\frac{4}{3}\) π(512)
V ≈ 682.7π
The volume of the fish tank is about 682.7π in3.

Exercise 7.
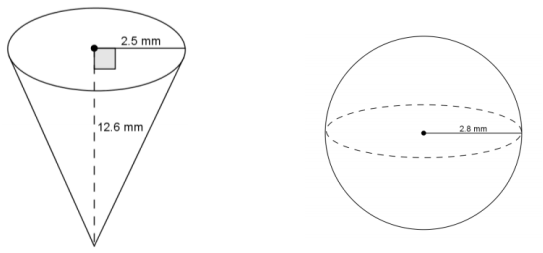
Use the diagram to answer the questions.
Engage NY Math Grade 8 Module 5 Lesson 11 Exercise Answer Key 2
a. Predict which of the figures shown above has the greater volume. Explain.
Answer:
Student answers will vary. Students will probably say the cone has more volume because it looks larger.

b. Use the diagram to find the volume of each, and determine which has the greater volume.
Answer:
V = \(\frac{1}{3}\) πr2 h
V = \(\frac{1}{3}\) π(2.52)(12.6)
V = 26.25π
The volume of the cone is 26.25π mm3.
V = \(\frac{4}{3}\) πr3
V = \(\frac{4}{3}\) π(2.83)
V = 29.269333…π
The volume of the sphere is about 29.27π mm3. The volume of the sphere is greater than the volume of the cone.

Exercise 8.
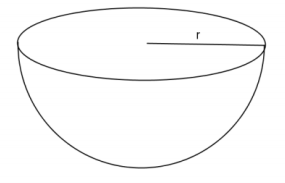
One of two half spheres formed by a plane through the sphere’s center is called a hemisphere. What is the formula for the volume of a hemisphere?
Engage NY Math Grade 8 Module 5 Lesson 11 Exercise Answer Key 3
Answer:
Since a hemisphere is half a sphere, the volume(hemisphere) = \(\frac{1}{2}\) (volume of sphere).
V = \(\frac{1}{2}\) (\(\frac{4}{3}\) πr3 )
V = \(\frac{2}{3}\) πr3

Eureka Math Grade 8 Module 5 Lesson 11 Problem Set Answer Key

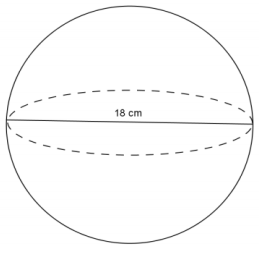
Question 1.
Use the diagram to find the volume of the sphere.
Eureka Math 8th Grade Module 5 Lesson 11 Problem Set Answer Key 1
Answer:
V = \(\frac{4}{3}\) πr3
V = \(\frac{4}{3}\) π(93)
V = 972π
The volume of the sphere is 972π cm3.

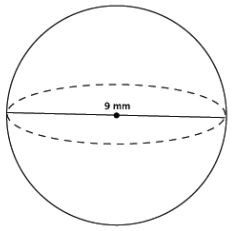
Question 2.
Determine the volume of a sphere with diameter 9 mm, shown below.
Eureka Math 8th Grade Module 5 Lesson 11 Problem Set Answer Key 2
Answer:
V = \(\frac{4}{3}\) πr3
= \(\frac{4}{3}\) π(4.53 )
= \(\frac{364.5}{3}\) π
= 121.5π
The volume of the sphere is 121.5π mm3.

Question 3.
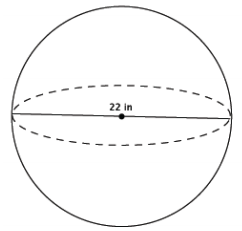
Determine the volume of a sphere with diameter 22 in., shown below.
Eureka Math 8th Grade Module 5 Lesson 11 Problem Set Answer Key 3
Answer:
V = \(\frac{4}{3}\) πr3
= \(\frac{4}{3}\) π(113 )
= \(\frac{5324}{3}\) π
= 1774 \(\frac{2}{3}\) π
The volume of the sphere is 1774 \(\frac{2}{3}\) π in3.

Question 4.
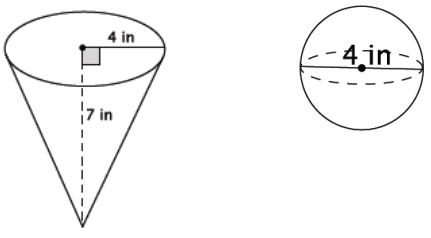
Which of the two figures below has the lesser volume?
Eureka Math 8th Grade Module 5 Lesson 11 Problem Set Answer Key 4
Answer:
The volume of the cone:
V = \(\frac{1}{3}\) πr2 h
= \(\frac{1}{3}\) π(16)(7)
= \(\frac{112}{3}\) π
= 37 \(\frac{1}{3}\) π

The volume of the sphere:
V = \(\frac{4}{3}\) πr3
= \(\frac{4}{3}\) π(23 )
= \(\frac{32}{3}\) π
= 10 \(\frac{2}{3}\) π
The cone has volume 37 \(\frac{1}{3}\) π in3 and the sphere has volume 10 \(\frac{2}{3}\) π in3. The sphere has the lesser volume.

Question 5.
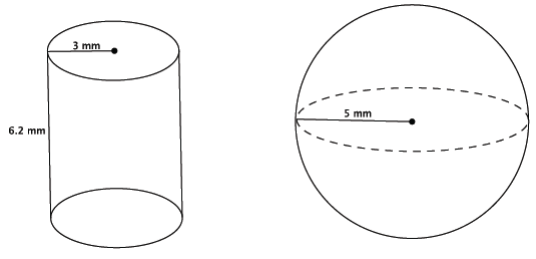
Which of the two figures below has the greater volume?
Eureka Math 8th Grade Module 5 Lesson 11 Problem Set Answer Key 5
Answer:
The volume of the cylinder:
V = πr2 h
= π(32)(6.2)
= 55.8π

The volume of the sphere:
V = \(\frac{4}{3}\) πr3
= \(\frac{4}{3}\) π(53)
= \(\frac{500}{3}\) π
= 166 \(\frac{2}{3}\) π
The cylinder has volume 55.8π mm3 and the sphere has volume 166 \(\frac{2}{3}\) π mm3. The sphere has the greater volume.

Question 6.
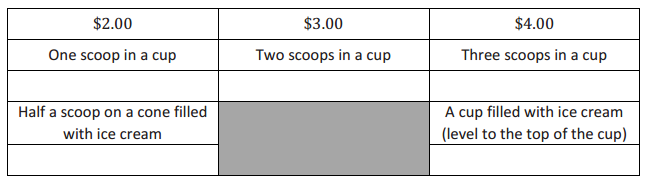
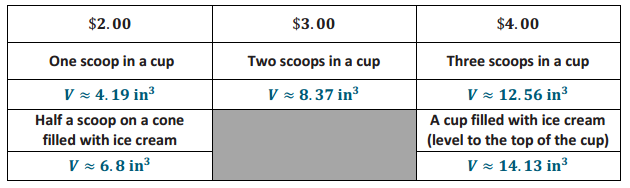
Bridget wants to determine which ice cream option is the best choice. The chart below gives the description and prices for her options. Use the space below each item to record your findings.
Eureka Math 8th Grade Module 5 Lesson 11 Problem Set Answer Key 6
A scoop of ice cream is considered a perfect sphere and has a 2-inch diameter. A cone has a 2-inch diameter and a height of 4.5 inches. A cup, considered a right circular cylinder, has a 3-inch diameter and a height of 2 inches.
Answer:
Eureka Math 8th Grade Module 5 Lesson 11 Problem Set Answer Key 7
a. Determine the volume of each choice. Use 3.14 to approximate π.
Answer:
First, find the volume of one scoop of ice cream.
Volume of one scoop = \(\frac{4}{3}\) π(13)
The volume of one scoop of ice cream is \(\frac{4}{3}\) π in3, or approximately 4.19 in3.
The volume of two scoops of ice cream is \(\frac{8}{3}\) π in3, or approximately 8.37 in3.
The volume of three scoops of ice cream is \(\frac{12}{3}\) π in3, or approximately 12.56 in3.
Volume of half scoop = \(\frac{2}{3}\) π(13)
The volume of half a scoop of ice cream is \(\frac{2}{3}\) π in3, or approximately 2.09 in3.
Volume of cone = \(\frac{1}{3}\) (πr2)h
V = \(\frac{1}{3}\) π(12)4.5
V = 1.5π
The volume of the cone is 1.5π in3, or approximately 4.71 in3. Then, the cone with half a scoop of ice cream on top is approximately 6.8 in3.
V = πr2 h
V = π1.52(2)
V = 4.5π
The volume of the cup is 4.5π in3, or approximately 14.13 in3.

b. Determine which choice is the best value for her money. Explain your reasoning.
Answer:
Student answers may vary.
Checking the cost for every in3 of each choice:
\(\frac{2}{4.19}\) ≈ 0.47723…
\(\frac{2}{6.8}\) ≈ 0.29411…
\(\frac{3}{8.37}\) ≈ 0.35842…
\(\frac{4}{12.56}\) ≈ 0.31847…
\(\frac{4}{14.13}\) ≈ 0.28308…
The best value for her money is the cup filled with ice cream since it costs about 28 cents for every in3.

Eureka Math Grade 8 Module 5 Lesson 11 Exit Ticket Answer Key

Question 1.
What is the volume of the sphere shown below?
Eureka Math Grade 8 Module 5 Lesson 11 Exit Ticket Answer Key 1
Answer:
V = \(\frac{4}{3}\) πr3
= \(\frac{4}{3}\) π(33 )
= \(\frac{108}{3}\) π
= 36π
The volume of the sphere is 36π in3.

Question 2.
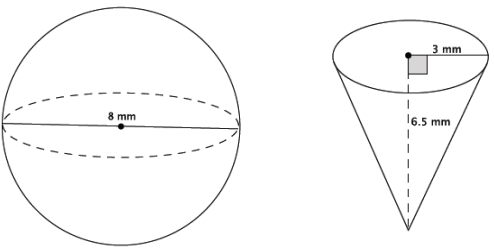
Which of the two figures below has the greater volume?
Eureka Math Grade 8 Module 5 Lesson 11 Exit Ticket Answer Key 2
Answer:
V = \(\frac{4}{3}\) πr3
= \(\frac{4}{3}\) π(43)
= \(\frac{256}{3}\) π
= 85 \(\frac{1}{3}\) π
The volume of the sphere is 85 \(\frac{1}{3}\) π mm3.
V = \(\frac{1}{3}\) πr2 h
= \(\frac{1}{3}\) π(32)(6.5)
= \(\frac{58.5}{3}\) π
= 19.5π
The volume of the cone is 19.5π mm3. The sphere has the greater volume.

Eureka Math Grade 8 Module 5 Lesson 10 Answer Key

Engage NY Eureka Math 8th Grade Module 5 Lesson 10 Answer Key

Eureka Math Grade 8 Module 5 Lesson 10 Exercise Answer Key

Opening Exercise
a.
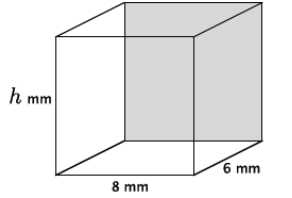
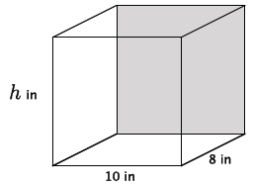
i. Write an equation to determine the volume of the rectangular prism shown below.
Engage NY Math Grade 8 Module 5 Lesson 10 Exercise Answer Key 1
Answer:
V = 8(6)(h)
= 48h
The volume is 48h mm3.

ii. Write an equation to determine the volume of the rectangular prism shown below.
Engage NY Math Grade 8 Module 5 Lesson 10 Exercise Answer Key 2
Answer:
V = 10(8)(h)
= 80h
The volume is 80h in3.

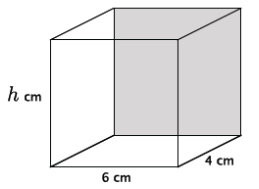
iii. Write an equation to determine the volume of the rectangular prism shown below.
Engage NY Math Grade 8 Module 5 Lesson 10 Exercise Answer Key 3
Answer:
V = 6(4)(h)
= 24h
The volume is 24h cm3.

iv. Write an equation for volume, V, in terms of the area of the base, B.
V = Bh

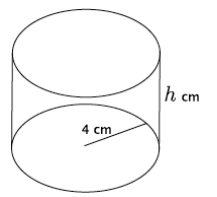
b. Using what you learned in part (a), write an equation to determine the volume of the cylinder shown below.
Engage NY Math Grade 8 Module 5 Lesson 10 Exercise Answer Key 4
Answer:
V = Bh
= 42 πh
= 16πh
The volume is 16πh cm3.

Exercises 1–3

Exercise 1.
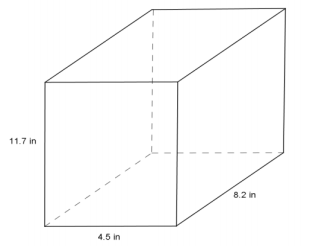
Use the diagram to the right to answer the questions.
Engage NY Math Grade 8 Module 5 Lesson 10 Exercise Answer Key 5
a. What is the area of the base?
Answer:
The area of the base is (4.5)(8.2) in2 or 36.9 in2.

b. What is the height?
Answer:
The height of the rectangular prism is 11.7 in.

c. What is the volume of the rectangular prism?
Answer:
The volume of the rectangular prism is 431.73 in3.

Exercise 2.
Use the diagram to the right to answer the questions.
Engage NY Math Grade 8 Module 5 Lesson 10 Exercise Answer Key 6
a. What is the area of the base?
Answer:
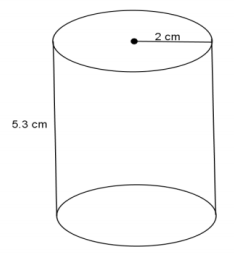
A = π22
A = 4π
The area of the base is 4π cm2.

b. What is the height?
Answer:
The height of the right circular cylinder is 5.3 cm.

c. What is the volume of the right circular cylinder?
Answer:
V = (πr2)h
V = (4π)5.3
V = 21.2π
The volume of the right circular cylinder is 21.2π cm3.

Exercise 3.
Use the diagram to the right to answer the questions.
Engage NY Math Grade 8 Module 5 Lesson 10 Exercise Answer Key 7
a. What is the area of the base?
Answer:
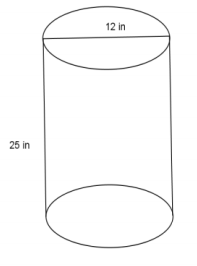
A = π62
A = 36π
The area of the base is 36π in2.

b. What is the height?
Answer:
The height of the right circular cylinder is 25 in.

c. What is the volume of the right circular cylinder?
Answer:
V = (36π)25
V = 900π
The volume of the right circular cylinder is 900π in3.

Exercises 4–6

Exercise 4.
Use the diagram to find the volume of the right circular cone.
Engage NY Math Grade 8 Module 5 Lesson 10 Exercise Answer Key 8
Answer:
V = \(\frac{1}{3}\) (πr2)h
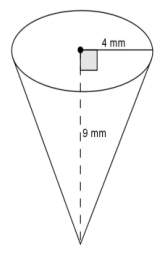
V = \(\frac{1}{3}\) (π42)9
V = 48π
The volume of the right circular cone is 48π mm3.

Exercise 5.
Use the diagram to find the volume of the right circular cone.
Engage NY Math Grade 8 Module 5 Lesson 10 Exercise Answer Key 9
Answer:
V = \(\frac{1}{3}\) (πr2)h
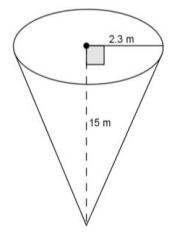
V = \(\frac{1}{3}\) (π2.32)15
V = 26.45π
The volume of the right circular cone is 26.45π m3.

Exercise 6.
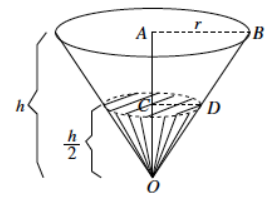
Challenge: A container in the shape of a right circular cone has height h, and base of radius r, as shown. It is filled with water (in its upright position) to half the height. Assume that the surface of the water is parallel to the base of the inverted cone. Use the diagram to answer the following questions:
Engage NY Math Grade 8 Module 5 Lesson 10 Exercise Answer Key 10
a. What do we know about the lengths of AB and AO?
Answer:
Then we know that |AB| = r, and |AO| = h.

b. What do we know about the measure of ∠OAB and ∠OCD?
Answer:
∠OAB and ∠OCD are both right angles.

c. What can you say about △OAB and △OCD?
Answer:
We have two similar triangles, △OAB and △OCD by AA criterion.

d. What is the ratio of the volume of water to the volume of the container itself?
Answer:
Since \(\frac{|A B|}{|C D|}\) = \(\frac{|A O|}{|C O|}\), and |AO| = 2|OC|, we have \(\frac{|A B|}{|C D|}\) = 2\(\frac{2|O C|}{|C O|}\).
Then |AB| = 2|CD|.
Using the volume formula to determine the volume of the container, we have V = \(\frac{1}{3}\) π|AB|2 |AO|.
By substituting |AB| with 2|CD| and |AO| with 2|OC| we get:
V = \(\frac{1}{3}\) π(2|CD|)2 (2|OC|)
V = 8(\(\frac{1}{3}\) π|CD|2 |OC|), where \(\frac{1}{3}\) π|CD|2 |OC| gives the volume of the portion of the container that is filled with water.
Therefore, the volume of the water to the volume of the container is 1:8.

Eureka Math Grade 8 Module 5 Lesson 10 Problem Set Answer Key

Question 1.
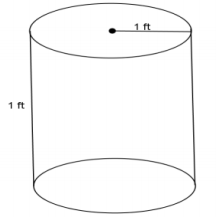
Use the diagram to help you find the volume of the right circular cylinder.
Eureka Math 8th Grade Module 5 Lesson 10 Problem Set Answer Key 1
Answer:
V = πr2 h
V = π(1)2 (1)
V = π
The volume of the right circular cylinder is π ft3.

Question 2.
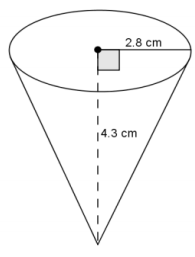
Use the diagram to help you find the volume of the right circular cone.
Eureka Math 8th Grade Module 5 Lesson 10 Problem Set Answer Key 2
Answer:
V = \(\frac{1}{3}\) πr2 h
V = \(\frac{1}{3}\) π(2.8)2 (4.3)
V = 11.237333…π
The volume of the right circular cone is about 11.2π cm3.

Question 3.
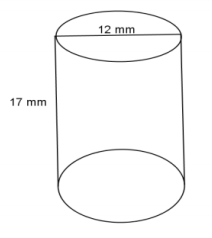
Use the diagram to help you find the volume of the right circular cylinder.
Eureka Math 8th Grade Module 5 Lesson 10 Problem Set Answer Key 3
Answer:
If the diameter is 12 mm, then the radius is 6 mm.
V = πr2 h
V = π(6)2 (17)
V = 612π
The volume of the right circular cylinder is 612π mm3.

Question 4.
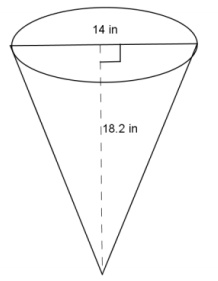
Use the diagram to help you find the volume of the right circular cone.
Eureka Math 8th Grade Module 5 Lesson 10 Problem Set Answer Key 4
Answer:
If the diameter is 14 in., then the radius is 7 in.
V = \(\frac{1}{3}\) πr2 h
V = \(\frac{1}{3}\) π(7)2 (18.2)
V = 297.26666…π
V ≈ 297.3π
The volume of the right cone is about 297.3π in3.

Question 5.
Oscar wants to fill with water a bucket that is the shape of a right circular cylinder. It has a 6-inch radius and 12-inch height. He uses a shovel that has the shape of a right circular cone with a 3-inch radius and 4-inch height. How many shovelfuls will it take Oscar to fill the bucket up level with the top?
Answer:
V = πr2 h
V = π(6)2 (12)
V = 432π
The volume of the bucket is 432π in3.
V = \(\frac{1}{3}\) πr2 h
V = \(\frac{1}{3}\) π(3)2 (4)
V = 12π
The volume of shovel is 12π in3.
\(\frac{432 \pi}{12 \pi}\) = 36
It would take 36 shovelfuls of water to fill up the bucket.

Question 6.
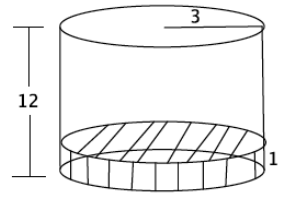
A cylindrical tank (with dimensions shown below) contains water that is 1-foot deep. If water is poured into the tank at a constant rate of 20 \(\frac{\mathrm{ft}^{3}}{\mathrm{~min}}\) for 20 min., will the tank overflow? Use 3.14 to estimate π.
Eureka Math 8th Grade Module 5 Lesson 10 Problem Set Answer Key 5
Answer:
V = πr2 h
V = π(3)2 (12)
V = 108π
The volume of the tank is about 339.12 ft3.
V = πr2 h
V = π(3)2 (1)
V = 9π
There is about 28.26 ft3 of water already in the tank. There is about 310.86 ft3 of space left in the tank. If the water is poured at a constant rate for 20 min., 400 ft3 will be poured into the tank, and the tank will overflow.

Eureka Math Grade 8 Module 5 Lesson 10 Exit Ticket Answer Key

Question 1.
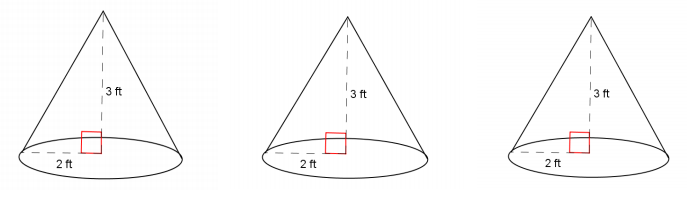
Use the diagram to find the total volume of the three cones shown below.
Eureka Math Grade 8 Module 5 Lesson 10 Exit Ticket Answer Key 1
Answer:
Since all three cones have the same base and height, the volume of the three cones will be the same as finding the volume of a cylinder with the same base radius and same height.
V = πr2 h
V = π(2)23
V = 12π
The volume of all three cones is 12π ft3.

Question 2.
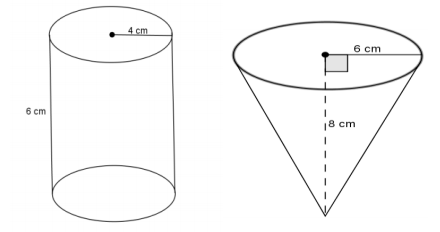
Use the diagram below to determine which has the greater volume, the cone or the cylinder.
Eureka Math Grade 8 Module 5 Lesson 10 Exit Ticket Answer Key 2
Answer:
V = πr2 h
V = π42 (6)
V = 96π
The volume of the cylinder is 96π cm3.
V = \(\frac{1}{3}\) πr2 h
V = \(\frac{1}{3}\) π62 (8)
V = 96π
The volume of the cone is 96π cm3.
The volume of the cylinder and the volume of the cone are the same, 96π cm3.

Eureka Math Grade 8 Module 5 Lesson 9 Answer Key

Engage NY Eureka Math 8th Grade Module 5 Lesson 9 Answer Key

Eureka Math Grade 8 Module 5 Lesson 9 Exploratory Challenge/Exercise Answer Key

Exploratory Challenge 1/Exercises 1–4
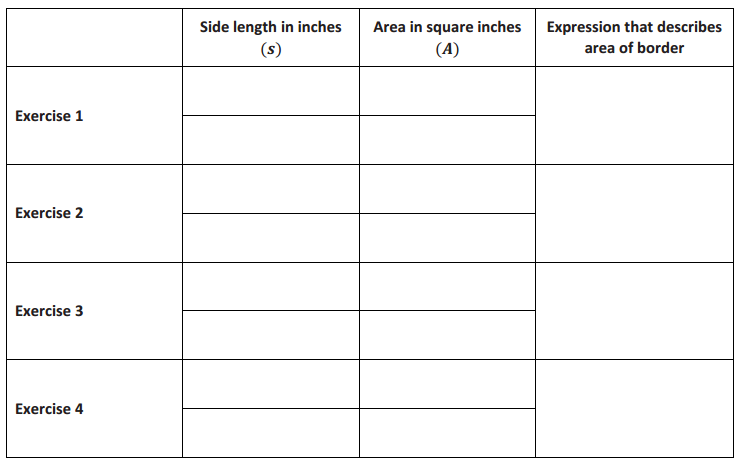
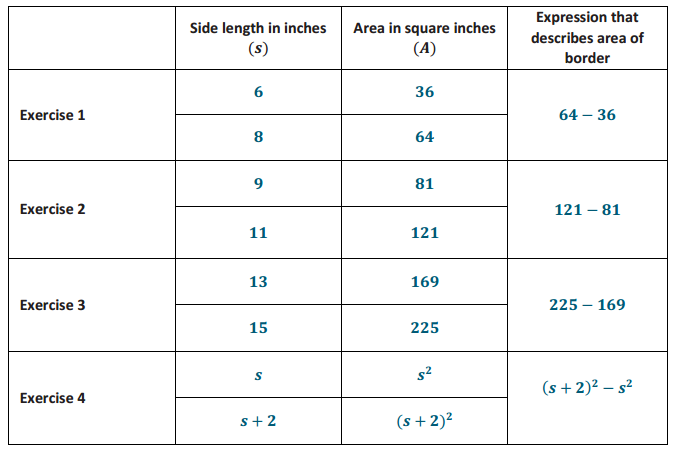
As you complete Exercises 1–4, record the information in the table below.
Engage NY Math Grade 8 Module 5 Lesson 9 Exercise Answer Key 1
Answer:
Engage NY Math Grade 8 Module 5 Lesson 9 Exercise Answer Key 2

Exercise 1.
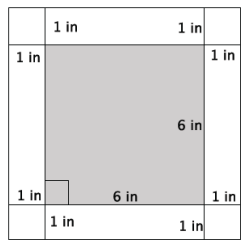
Use the figure below to answer parts (a)–(f).
Engage NY Math Grade 8 Module 5 Lesson 9 Exercise Answer Key 3
a. What is the length of one side of the smaller, inner square?
Answer:
The length of one side of the smaller square is 6 in.

b. What is the area of the smaller, inner square?
Answer:
62 = 36
The area of the smaller square is 36 in2.

c. What is the length of one side of the larger, outer square?
Answer:
The length of one side of the larger square is 8 in.

d. What is the area of the larger, outer square?
Answer:
82 = 64
The area of the larger square is 64 in2.

e. Use your answers in parts (b) and (d) to determine the area of the 1 – inch white border of the figure.
Answer:
64 – 36 = 28
The area of the 1 – inch white border is 28 in2.

f. Explain your strategy for finding the area of the white border.
Answer:
First, I had to determine the length of one side of the larger, outer square. Since the inner square is 6 in. and the border is 1 in. on all sides, then the length of one side of the larger square is (6 + 2) in = 8 in. Then, the area of the larger square is 64 in2. Next, I found the area of the smaller, inner square. Since one side length is 6 in., the area is 36 in2. To find the area of the white border, I needed to subtract the area of the inner square from the area of the outer square.

Exercise 2.
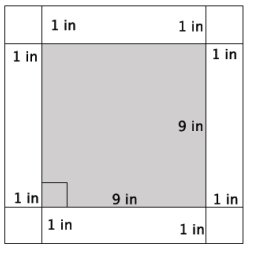
Use the figure below to answer parts (a)–(f).
Engage NY Math Grade 8 Module 5 Lesson 9 Exercise Answer Key 4
a. What is the length of one side of the smaller, inner square?
Answer:
The length of one side of the smaller square is 9 in.

b. What is the area of the smaller, inner square?
Answer:
92 = 81
The area of the smaller square is 81 in2.

c. What is the length of one side of the larger, outer square?
Answer:
The length of one side of the larger square is 11 in.

d. What is the area of the larger, outer square?
Answer:
112 = 121
The area of the larger square is 121 in2.

e. Use your answers in parts (b) and (d) to determine the area of the 1 – inch white border of the figure.
Answer:
121 – 81 = 40
The area of the 1 – inch white border is 40 in2.

f. Explain your strategy for finding the area of the white border.
Answer:
First, I had to determine the length of one side of the larger, outer square. Since the inner square is 9 in. and the border is 1 in. on all sides, the length of one side of the larger square is (9 + 2) in = 11 in. Therefore, the area of the larger square is 121 in2. Then, I found the area of the smaller, inner square. Since one side length is 9 in., the area is 81 in2. To find the area of the white border, I needed to subtract the area of the inner square from the area of the outer square.

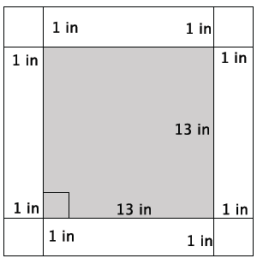
Exercise 3.
Use the figure below to answer parts (a)–(f).
Engage NY Math Grade 8 Module 5 Lesson 9 Exercise Answer Key 5
a. What is the length of one side of the smaller, inner square?
Answer:
The length of one side of the smaller square is 13 in.

b. What is the area of the smaller, inner square?
Answer:
132 = 169
The area of the smaller square is 169 in2.

c. What is the length of one side of the larger, outer square?
Answer:
The length of one side of the larger square is 15 in.

d. What is the area of the larger, outer square?
Answer:
152 = 225
The area of the larger square is 225 in2.

e. Use your answers in parts (b) and (d) to determine the area of the 1 – inch white border of the figure.
Answer:
225 – 169 = 56
The area of the 1 – inch white border is 56 in2.

f. Explain your strategy for finding the area of the white border.
Answer:
First, I had to determine the length of one side of the larger, outer square. Since the inner square is 13 in. and the border is 1 in. on all sides, the length of one side of the larger square is (13 + 2) in = 15 in. Therefore, the area of the larger square is 225 in2. Then, I found the area of the smaller, inner square. Since one side length is 13 in., the area is 169 in2. To find the area of the white border, I needed to subtract the area of the inner square from the area of the outer square.

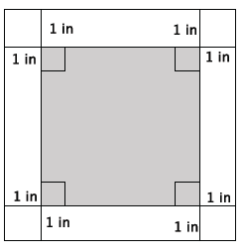
Exercise 4.
Write a function that would allow you to calculate the area of a 1 – inch white border for any sized square picture measured in inches.
Engage NY Math Grade 8 Module 5 Lesson 9 Exercise Answer Key 6
a. Write an expression that represents the side length of the smaller, inner square.
Answer:
Symbols used will vary. Expect students to use s or x to represent one side of the smaller, inner square. Answers that follow will use s as the symbol to represent one side of the smaller, inner square.

b. Write an expression that represents the area of the smaller, inner square.
Answer:
s2

c. Write an expression that represents the side lengths of the larger, outer square.
Answer:
s + 2

d. Write an expression that represents the area of the larger, outer square.
Answer:
(s + 2)2

e. Use your expressions in parts (b) and (d) to write a function for the area A of the 1 – inch white border for any sized square picture measured in inches.
Answer:
A = (s + 2)2 – s2

Exercises 5–6

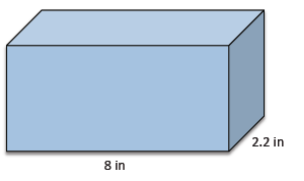
Exercise 5.
The volume of the prism shown below is 61.6 in3. What is the height of the prism?
Engage NY Math Grade 8 Module 5 Lesson 9 Exercise Answer Key 7
Answer:
Let x represent the height of the prism.
61.6 = 8(2.2)x
61.6 = 17.6x
3.5 = x
The height of the prism is 3.5 in.

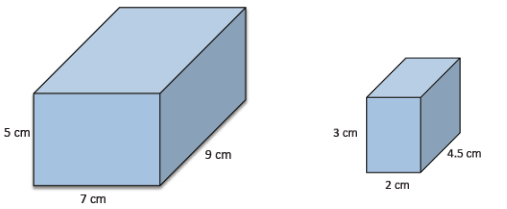
Exercise 6.
Find the value of the ratio that compares the volume of the larger prism to the smaller prism.
Engage NY Math Grade 8 Module 5 Lesson 9 Exercise Answer Key 8
Answer:
Volume of larger prism:
V = 7(9)(5)
= 315
The volume of the larger prism is 315 cm3.
Volume of smaller prism:
V = 2(4.5)(3)
= 27
The volume of the smaller prism is 27 cm3.
The ratio that compares the volume of the larger prism to the smaller prism is 315:27. The value of the ratio is \(\frac{315}{27}\) = \(\frac{35}{3}\).

Exploratory Challenge 2/Exercises 7–10
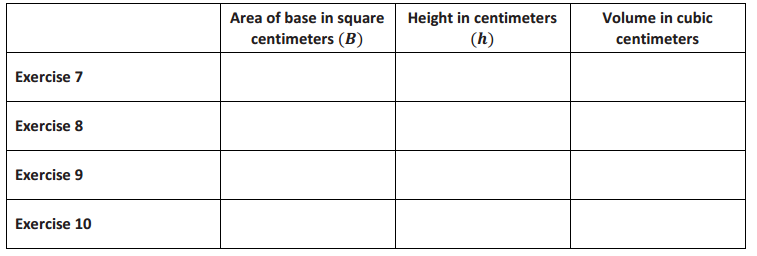
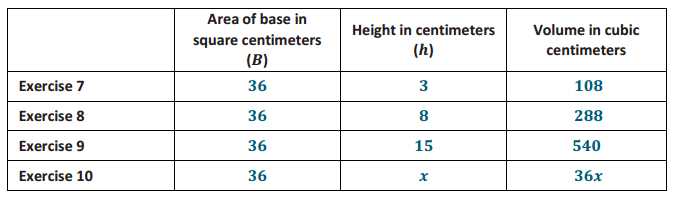
As you complete Exercises 7–10, record the information in the table below. Note that base refers to the bottom of the prism.
Engage NY Math Grade 8 Module 5 Lesson 9 Exercise Answer Key 9
Answer:
Engage NY Math Grade 8 Module 5 Lesson 9 Exercise Answer Key 10

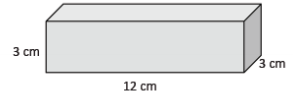
Exercise 7.
Use the figure to the right to answer parts (a)–(c).
Engage NY Math Grade 8 Module 5 Lesson 9 Exercise Answer Key 11
a. What is the area of the base?
Answer:
The area of the base is 36 cm2.

b. What is the height of the figure?
Answer:
The height is 3 cm.

c. What is the volume of the figure?
Answer:
The volume of the rectangular prism is 108 cm3.

Exercise 8.
Use the figure to the right to answer parts (a)–(c).
Engage NY Math Grade 8 Module 5 Lesson 9 Exercise Answer Key 12
a. What is the area of the base?
Answer:
The area of the base is 36 cm2.

b. What is the height of the figure?
Answer:
The height is 8 cm.

c. What is the volume of the figure?
Answer:
The volume of the rectangular prism is 288 cm3.

Exercise 9.
Use the figure to the right to answer parts (a)–(c).
Engage NY Math Grade 8 Module 5 Lesson 9 Exercise Answer Key 13
a. What is the area of the base?
Answer:
The area of the base is 36 cm2.

b. What is the height of the figure?
Answer:
The height is 15 cm.

c. What is the volume of the figure?
Answer:
The volume of the rectangular prism is 540 cm3.

Exercise 10.
Use the figure to the right to answer parts (a)–(c).
Engage NY Math Grade 8 Module 5 Lesson 9 Exercise Answer Key 14
a. What is the area of the base?
Answer:
The area of the base is 36 cm2.

b. What is the height of the figure?
Answer:
The height is x cm.

c. Write and describe a function that will allow you to determine the volume of any rectangular prism that has a base area of
Answer:
36 cm2.
The rule that describes the function is V = 36x, where V is the volume and x is the height of the rectangular prism. The volume of a rectangular prism with a base area of 36 cm2 is a function of its height.

Eureka Math Grade 8 Module 5 Lesson 9 Problem Set Answer Key

Question 1.
Calculate the area of the 3 – inch white border of the square figure below.
Eureka Math 8th Grade Module 5 Lesson 9 Problem Set Answer Key 1
Answer:
172 = 289
112 = 121
The area of the 3 – inch white border is 168 in2.

Question 2.
Write a function that would allow you to calculate the area, A, of a 3 – inch white border for any sized square picture measured in inches.
Eureka Math 8th Grade Module 5 Lesson 9 Problem Set Answer Key 2
Answer:
Let s represent the side length of the inner square in inches. Then, the area of the inner square is s2 square inches. The side length of the outer square, in inches, is s + 6, which means that the area of the outer square, in square inches, is (s + 6)2. The function that describes the area, A, of the 3 – inch border is in square inches
A = (s + 6)2 – s2.

Question 3.
Dartboards typically have an outer ring of numbers that represent the number of points a player can score for getting a dart in that section. A simplified dartboard is shown below. The center of the circle is point A. Calculate the area of the outer ring. Write an exact answer that uses π (do not approximate your answer by using 3.14 for π).
Eureka Math 8th Grade Module 5 Lesson 9 Problem Set Answer Key 3
Answer:
Inner ring area: πr2 = π(62 ) = 36 π
Outer ring: πr2 = π(6 + 2)2 = π(82 ) = 64 π
Difference in areas: 64 π – 36 π = (64 – 34)π = 28 π
The inner ring has an area of 36π in2. The area of the inner ring including the border is 64π in2. The difference is the area of the border, 28π in2.

Question 4.
Write a function that would allow you to calculate the area, A, of the outer ring for any sized dartboard with radius r. Write an exact answer that uses π (do not approximate your answer by using 3.14 for π).
Eureka Math 8th Grade Module 5 Lesson 9 Problem Set Answer Key 4
Answer:
Inner ring area: πr2
Outer ring: πr2 = π(r + 2)2
Difference in areas: Inner ring area: π(r + 2)2 – πr2
The inner ring has an area of πr2 in2. The area of the inner ring including the border is π(r + 2)2 in2. Let A be the area of the outer ring. Then, the function that would describe that area in square inches is
A = π(r + 2)2 – πr2.

Question 5.
The shell of the solid shown was filled with water and then poured into the standard rectangular prism, as shown. The height that the volume reaches is 14.2 in. What is the volume of the shell of the solid?
Eureka Math 8th Grade Module 5 Lesson 9 Problem Set Answer Key 5
Answer:
V = Bh
= 1(14.2)
= 14.2
The volume of the shell of the solid is 14.2 in3.

Question 6.
Determine the volume of the rectangular prism shown below.
Eureka Math 8th Grade Module 5 Lesson 9 Problem Set Answer Key 6
Answer:
6.4 × 5.1 × 10.2 = 332.928
The volume of the prism is 332.928 in3.

Question 7.
The volume of the prism shown below is 972 cm3. What is its length?
Eureka Math 8th Grade Module 5 Lesson 9 Problem Set Answer Key 7
Answer:
Let x represent the length of the prism.
972 = 8.1(5)x
972 = 40.5x
24 = x
The length of the prism is 24 cm.

Question 8.
The volume of the prism shown below is 32.7375 ft3. What is its width?
Eureka Math 8th Grade Module 5 Lesson 9 Problem Set Answer Key 8
Answer:
Let x represent the width.
32.7375 = (0.75)(4.5)x
32.7375 = 3.375x
9.7 = x
The width of the prism is 9.7 ft.

Question 9.
Determine the volume of the three – dimensional figure below. Explain how you got your answer.
Eureka Math 8th Grade Module 5 Lesson 9 Problem Set Answer Key 9
Answer:
2 × 2.5 × 1.5 = 7.5
2 × 1 × 1 = 2
The volume of the top rectangular prism is 7.5 units3. The volume of the bottom rectangular prism is 2 units3. The figure is made of two rectangular prisms, and since the rectangular prisms only touch at their boundaries, we can add their volumes together to obtain the volume of the figure. The total volume of the three – dimensional figure is 9.5 units3.

Eureka Math Grade 8 Module 5 Lesson 9 Exit Ticket Answer Key

Question 1.
Write a function that would allow you to calculate the area in square inches, A, of a 2 – inch white border for any sized square figure with sides of length s measured in inches.
Eureka Math Grade 8 Module 5 Lesson 9 Exit Ticket Answer Key 1
Answer:
Let s represent the side length of the inner square in inches. Then, the area of the inner square is s2 square inches. The side length of the larger square, in inches, is s + 4, and the area in square inches is (s + 4)2. If A is the area of the 2 – inch border, then the function that describes A in square inches is
A = (s + 4)2 – s2.

Question 2.
The volume of the rectangular prism is 295.68 in3. What is its width?
Eureka Math Grade 8 Module 5 Lesson 9 Exit Ticket Answer Key 2
Answer:
Let x represent the width of the prism.
295.68 = 11(6.4)x
295.68 = 70.4x
4.2 = x
The width of the prism is 4.2 in.

Eureka Math Grade 8 Module 5 Lesson 7 Answer Key

Engage NY Eureka Math 8th Grade Module 5 Lesson 7 Answer Key

Eureka Math Grade 8 Module 5 Lesson 7 Exploratory Challenge/Exercise Answer Key

Exploratory Challenge/Exercises 1–4
Each of Exercises 1–4 provides information about two functions. Use that information given to help you compare the two functions and answer the questions about them.

Exercise 1.
Alan and Margot each drive from City A to City B, a distance of 147 miles. They take the same route and drive at constant speeds. Alan begins driving at 1:40 p.m. and arrives at City B at 4:15 p.m. Margot’s trip from City A to City B can be described with the equation y = 64x, where y is the distance traveled in miles and x is the time in minutes spent traveling. Who gets from City A to City B faster?
Answer:
Student solutions will vary. Sample solution is provided.
It takes Alan 155 minutes to travel the 147 miles. Therefore, his constant rate is \(\frac{147}{155}\) miles per minute.
Margot drives 64 miles per hour (60 minutes). Therefore, her constant rate is \(\frac{64}{60}\) miles per minute.
To determine who gets from City A to City B faster, we just need to compare their rates in miles per minute.
\(\frac{147}{155}\) < \(\frac{64}{60}\)
Since Margot’s rate is faster, she will get to City B faster than Alan.

Exercise 2.
You have recently begun researching phone billing plans. Phone Company A charges a flat rate of $75 a month. A flat rate means that your bill will be $75 each month with no additional costs. The billing plan for Phone Company B is a linear function of the number of texts that you send that month. That is, the total cost of the bill changes each month depending on how many texts you send. The table below represents some inputs and the corresponding outputs that the function assigns.
Engage NY Math Grade 8 Module 5 Lesson 7 Exercise Answer Key 1
At what number of texts would the bill from each phone plan be the same? At what number of texts is Phone Company A the better choice? At what number of texts is Phone Company B the better choice?
Answer:
Student solutions will vary. Sample solution is provided.
The equation that represents the function for Phone Company A is y = 75.
To determine the equation that represents the function for Phone Company B, we need the rate of change. (We are told it is constant.)
\(\frac{60 – 50}{150 – 50}\) = \(\frac{10}{100}\)
= 0.1
The equation for Phone Company B is shown below.
Using the assignment of 50 to 50,
50 = 0.1(50) + b
50 = 5 + b
45 = b.
The equation that represents the function for Phone Company B is y = 0.1x + 45.
We can determine at what point the phone companies charge the same amount by solving the system:
y = 75
y = 0.1x + 45

75 = 0.1x + 45
30 = 0.1x
300 = x
After 300 texts are sent, both companies would charge the same amount, $75. More than 300 texts means that the bill from Phone Company B will be higher than Phone Company A. Less than 300 texts means the bill from Phone Company A will be higher.

Exercise 3.
The function that gives the volume of water, y, that flows from Faucet A in gallons during x minutes is a linear function with the graph shown. Faucet B’s water flow can be described by the equation y = \(\frac{5}{6}\) x, where y is the volume of water in gallons that flows from the faucet during x minutes. Assume the flow of water from each faucet is constant. Which faucet has a faster rate of flow of water? Each faucet is being used to fill a tub with a volume of 50 gallons. How long will it take each faucet to fill its tub? How do you know?
Engage NY Math Grade 8 Module 5 Lesson 7 Exercise Answer Key 2
Suppose the tub being filled by Faucet A already had 15 gallons of water in it, and the tub being filled by Faucet B started empty. If now both faucets are turned on at the same time, which faucet will fill its tub fastest?
Answer:
Student solutions will vary. Sample solution is provided.
The slope of the graph of the line is \(\frac{4}{7}\) because (7, 4) is a point on the line that represents 4 gallons of water that flows in 7 minutes. Therefore, the rate of water flow for Faucet A is \(\frac{4}{7}\). To determine which faucet has a faster flow of water, we can compare their rates.
\(\frac{4}{7}\) < \(\frac{5}{6}\)
Therefore, Faucet B has a faster rate of water flow.
Engage NY Math Grade 8 Module 5 Lesson 7 Exercise Answer Key 3

Exercise 4.
Two people, Adam and Bianca, are competing to see who can save the most money in one month. Use the table and the graph below to determine who will save the most money at the end of the month. State how much money each person had at the start of the competition. (Assume each is following a linear function in his or her saving habit.)
Engage NY Math Grade 8 Module 5 Lesson 7 Exercise Answer Key 4
Answer:
The slope of the line that represents Adam’s savings is 3; therefore, the rate at which Adam is saving money is $3 per day. According to the table of values for Bianca, she is also saving money at a rate of $3 per day:
\(\frac{26 – 17}{8 – 5}\) = \(\frac{9}{3}\) = 3
\(\frac{38 – 26}{12 – 8}\) = \(\frac{12}{4}\) = 3
\(\frac{62 – 26}{20 – 8}\) = \(\frac{36}{12}\) = 3
Therefore, at the end of the month, Adam and Bianca will both have saved the same amount of money.
According to the graph for Adam, the equation y = 3x + 3 represents the function of money saved each day. On day zero, he had $3.
The equation that represents the function of money saved each day for Bianca is y = 3x + 2 because, using the assignment of 17 to 5
17 = 3(5) + b
17 = 15 + b
2 = b.
The amount of money Bianca had on day zero was $2.

Eureka Math Grade 8 Module 5 Lesson 7 Problem Set Answer Key

Question 1.
The graph below represents the distance in miles, y, Car A travels in x minutes. The table represents the distance in miles, y, Car B travels in x minutes. It is moving at a constant rate. Which car is traveling at a greater speed? How do you know?
Car A:
Eureka Math 8th Grade Module 5 Lesson 7 Problem Set Answer Key 1
Answer:
Based on the graph, Car A is traveling at a rate of 2 miles every 3 minutes, m = 2/3. From the table, the constant rate that Car B is traveling is
\(\frac{25 – 12.5}{30 – 15}\) = \(\frac{12.5}{15}\) = \(\frac{25}{30}\) = \(\frac{5}{6}\).

Since \(\frac{5}{6}\)>\(\frac{2}{3}\), Car B is traveling at a greater speed.

Question 2.
The local park needs to replace an existing fence that is 6 feet high. Fence Company A charges $7,000 for building materials and $200 per foot for the length of the fence. Fence Company B charges are based solely on the length of the fence. That is, the total cost of the 6 – foot high fence will depend on how long the fence is. The table below represents some inputs and their corresponding outputs that the cost function for Fence Company B assigns. It is a linear function.
Eureka Math 8th Grade Module 5 Lesson 7 Problem Set Answer Key 2
a. Which company charges a higher rate per foot of fencing? How do you know?
Answer:
Let x represent the length of the fence and y represent the total cost.
The equation that represents the function for Fence Company A is y = 200x + 7,000. So, the rate is 200 dollars per foot of fence.
The rate of change for Fence Company B is given by:
\(\frac{26,000 – 31,200}{100 – 120}\) = \(\frac{ – 5,200}{ – 20}\)
= 260
Fence Company B charges $260 per foot of fence, which is a higher rate per foot of fence length than Fence Company A.

b. At what number of the length of the fence would the cost from each fence company be the same? What will the cost be when the companies charge the same amount? If the fence you need were 190 feet in length, which company would be a better choice?
Answer:
Student solutions will vary. Sample solution is provided.
The equation for Fence Company B is
y = 260x.
We can find out at what point the fence companies charge the same amount by solving the system
y = 200x + 7000
y = 260x

200x + 7,000 = 260x
7,000 = 60x
116.6666…… = x
116.7 ≈ x
At 116.7 feet of fencing, both companies would charge the same amount (about $30,340). Less than 116.7 feet of fencing means that the cost from Fence Company A will be more than Fence Company B. More than 116.7 feet of fencing means that the cost from Fence Company B will be more than Fence Company A. So, for 190 feet of fencing, Fence Company A is the better choice.

Question 3.
The equation y = 123x describes the function for the number of toys, y, produced at Toys Plus in x minutes of production time. Another company, #1 Toys, has a similar function, also linear, that assigns the values shown in the table below. Which company produces toys at a slower rate? Explain.
Eureka Math 8th Grade Module 5 Lesson 7 Problem Set Answer Key 3
Answer:
We are told that #1 Toys produces toys at a constant rate. That rate is:
\(\frac{1,320 – 600}{11 – 5}\) = \(\frac{720}{6}\)
= 120
The rate of production for #1 Toys is 120 toys per minute. The rate of production for Toys Plus is 123 toys per minute. Since 120 is less than 123, #1 Toys produces toys at a slower rate.

Question 4.
A train is traveling from City A to City B, a distance of 320 miles. The graph below shows the number of miles, y, the train travels as a function of the number of hours, x, that have passed on its journey. The train travels at a constant speed for the first four hours of its journey and then slows down to a constant speed of 48 miles per hour for the remainder of its journey.
Eureka Math 8th Grade Module 5 Lesson 7 Problem Set Answer Key 4
a. How long will it take the train to reach its destination?
Answer:
Student solutions will vary. Sample solution is provided.
We see from the graph that the train travels 220 miles during its first four hours of travel. It has 100 miles remaining to travel, which it shall do at a constant speed of 48 miles per hour. We see that it will take about 2 hours more to finish the trip:
100 = 48x
2.08333… = x
2.1 ≈ x.
This means it will take about 6.1 hours (4 + 2.1 = 6.1) for the train to reach its destination.

b. If the train had not slowed down after 4 hours, how long would it have taken to reach its destination?
Answer:
320 = 55x
5.8181818…. = x
5.8 ≈ x
The train would have reached its destination in about 5.8 hours had it not slowed down.

c. Suppose after 4 hours, the train increased its constant speed. How fast would the train have to travel to complete the destination in 1.5 hours?
Answer:
Let m represent the new constant speed of the train.
100 = m(1.5)
66.6666…. = x
66.7 ≈ x
The train would have to increase its speed to about 66.7 miles per hour to arrive at its destination 1.5 hours later.

Question 5.
a. A hose is used to fill up a 1,200 gallon water truck. Water flows from the hose at a constant rate. After 10 minutes, there are 65 gallons of water in the truck. After 15 minutes, there are 82 gallons of water in the truck. How long will it take to fill up the water truck? Was the tank initially empty?
Answer:
Student solutions will vary. Sample solution is provided.
Let x represent the time in minutes it takes to pump y gallons of water. Then, the rate can be found as follows:
Eureka Math 8th Grade Module 5 Lesson 7 Problem Set Answer Key 5
\(\frac{65 – 82}{10 – 15}\) = \(\frac{ – 17}{ – 5}\)
= \(\frac{17}{5}\)
Since the water is pumping at a constant rate, we can assume the equation is linear. Therefore, the equation for the volume of water pumped from the hose is found by
65 = \(\frac{17}{5}\) (10) + b
65 = 34 + b
31 = b
The equation is y = \(\frac{17}{5}\) x + 31, and we see that the tank initially had 31 gallons of water in it. The time to fill the tank is given by
1200 = \(\frac{17}{5}\) x + 31
1169 = \(\frac{17}{5}\) x
343.8235… = x
343.8 ≈ x
It would take about 344 minutes or about 5.7 hours to fill up the truck.

b. The driver of the truck realizes that something is wrong with the hose he is using. After 30 minutes, he shuts off the hose and tries a different hose. The second hose flows at a constant rate of 18 gallons per minute. How long now does it take to fill up the truck?
Since the first hose has been pumping for 30 minutes, there are 133 gallons of water already in the truck. That means the new hose only has to fill up 1,067 gallons. Since the second hose fills up the truck at a constant rate of 18 gallons per minute, the equation for the second hose is y = 18x.
Answer:
1067 = 18x
59.27 = x
59.3 ≈ x
It will take the second hose about 59.3 minutes (or a little less than an hour) to finish the job.

Eureka Math Grade 8 Module 5 Lesson 7 Exit Ticket Answer Key

Question 1.
Brothers Paul and Pete walk 2 miles to school from home. Paul can walk to school in 24 minutes. Pete has slept in again and needs to run to school. Paul walks at a constant rate, and Pete runs at a constant rate. The graph of the function that represents Pete’s run is shown below.
Eureka Math Grade 8 Module 5 Lesson 7 Exit Ticket Answer Key 1
a. Which brother is moving at a greater rate? Explain how you know.
Answer:
Paul takes 24 minutes to walk 2 miles; therefore, his rate is \(\frac{1}{12}\) miles per minute.
Pete can run 8 miles in 60 minutes; therefore, his rate is \(\frac{8}{60}\), or \(\frac{2}{15}\) miles per minute.
Since \(\frac{2}{15}\)>\(\frac{1}{12}\), Pete is moving at a greater rate.

b. If Pete leaves 5 minutes after Paul, will he catch up to Paul before they get to school?
Answer:
Student solution methods will vary. Sample answer is shown.
Since Pete slept in, we need to account for that fact. So, Pete’s time would be decreased. The equation that would represent the number of miles Pete runs, y, in x minutes, would be
y = \(\frac{2}{15}\)(x – 5).
The equation that would represent the number of miles Paul walks, y, in x minutes, would be y = \(\frac{1}{12}\) x.
To find out when they meet, solve the system of equations:
y = \(\frac{2}{15}\) x – \(\frac{2}{3}\)
y = \(\frac{1}{12}\) x

\(\frac{2}{15}\) x – \(\frac{2}{3}\) = \(\frac{1}{12}\) x
\(\frac{2}{15}\) x – \(\frac{2}{3}\) – \(\frac{1}{12}\) x + \(\frac{2}{3}\) = \(\frac{1}{12}\) x – \(\frac{1}{12}\) x + \(\frac{2}{3}\)
\(\frac{1}{20}\) x = \(\frac{2}{3}\)
(\(\frac{20}{1}\)) \(\frac{1}{20}\) x = \(\frac{2}{3}\) (\(\frac{20}{1}\))
x = \(\frac{40}{3}\)
y = \(\frac{1}{12}\) (\(\frac{40}{3}\)) = \(\frac{10}{9}\) or y = \(\frac{2}{15}\) (\(\frac{40}{3}\)) – \(\frac{2}{3}\)
Pete would catch up to Paul in \(\frac{40}{3}\) minutes, which occurs \(\frac{10}{9}\) miles from their home. Yes, he will catch Paul before they get to school because it is less than the total distance, two miles, to school.

Eureka Math Grade 8 Module 5 Lesson 7 Multi – Step Equations II Answer Key

Question 1.
2(x + 5) = 3(x + 6)
Answer:
x = – 8

Question 2.
3(x + 5) = 4(x + 6)
Answer:
x = – 9

Question 3.
4(x + 5) = 5(x + 6)
Answer:
x = – 10

Question 4.
– (4x + 1) = 3(2x – 1)
Answer:
x = \(\frac{1}{5}\)

Question 5.
3(4x + 1) = – (2x – 1)
Answer:
x = – \(\frac{1}{7}\)

Question 6.
– 3(4x + 1) = 2x – 1
Answer:
x = – \(\frac{1}{7}\)

Question 7.
15x – 12 = 9x – 6
Answer:
x = 1

Question 8.
\(\frac{1}{3}\) (15x – 12) = 9x – 6
x = \(\frac{1}{2}\)

Question 9.
\(\frac{2}{3}\) (15x – 12) = 9x – 6
Answer:
x = 2

Eureka Math Grade 8 Module 5 Lesson 5 Answer Key

Engage NY Eureka Math 8th Grade Module 5 Lesson 5 Answer Key

Eureka Math Grade 8 Module 5 Lesson 5 Exploratory Challenge/Exercise Answer Key

Exploratory Challenge/Exercises 1–3
Exercise 1.
The distance that Giselle can run is a function of the amount of time she spends running. Giselle runs 3 miles in 21 minutes. Assume she runs at a constant rate.
a. Write an equation in two variables that represents her distance run, y, as a function of the time, x, she spends running.
\(\frac{3}{21}\) = \(\frac{y}{x}\)
y = \(\frac{1}{7}\) x

b. Use the equation you wrote in part (a) to determine how many miles Giselle can run in 14 minutes.
Answer:
y = \(\frac{1}{7}\) (14)
y = 2
Giselle can run 2 miles in 14 minutes.

c. Use the equation you wrote in part (a) to determine how many miles Giselle can run in 28 minutes.
Answer:
y = \(\frac{1}{7}\) (28)
y = 4
Giselle can run 4 miles in 28 minutes.

d. Use the equation you wrote in part (a) to determine how many miles Giselle can run in 7 minutes.
Answer:
y = \(\frac{1}{7}\) (7)
y = 1
Giselle can run 1 mile in 7 minutes.

e. For a given input x of the function, a time, the matching output of the function, y, is the distance Giselle ran in that time. Write the inputs and outputs from parts (b)–(d) as ordered pairs, and plot them as points on a coordinate plane.
Engage NY Math Grade 8 Module 5 Lesson 5 Exercise Answer Key 1
Answer:
(14, 2), (28, 4), (7, 1)
Engage NY Math Grade 8 Module 5 Lesson 5 Exercise Answer Key 2
f. What do you notice about the points you plotted?
Answer:
The points appear to be in a line.

g. Is the function discrete?
Answer:
The function is not discrete because we can find the distance Giselle runs for any given amount of time she spends running.

h. Use the equation you wrote in part (a) to determine how many miles Giselle can run in 36 minutes. Write your answer as an ordered pair, as you did in part (e), and include the point on the graph. Is the point in a place where you expected it to be? Explain.
Answer:
y = \(\frac{1}{7}\) (36)
y = \(\frac{36}{7}\)
y = 5 \(\frac{1}{7}\)
(36, 5 \(\frac{1}{7}\)) The point is where I expected it to be because it is in line with the other points.

i. Assume you used the rule that describes the function to determine how many miles Giselle can run for any given time and wrote each answer as an ordered pair. Where do you think these points would appear on the graph?
Answer:
I think all of the points would fall on a line.

j. What do you think the graph of all the possible input/output pairs would look like? Explain.
Answer:
I know the graph will be a line as we can find all of the points that represent fractional intervals of time too. We also know that Giselle runs at a constant rate, so we would expect that as the time she spends running increases, the distance she can run will increase at the same rate.

k. Connect the points you have graphed to make a line. Select a point on the graph that has integer coordinates. Verify that this point has an output that the function would assign to the input.
Answer:
Answers will vary. Sample student work:
The point (42, 6) is a point on the graph.
y = \(\frac{1}{7}\) x
6 = \(\frac{1}{7}\) (42)
6 = 6
The function assigns the output of 6 to the input of 42.

l. Sketch the graph of the equation y = \(\frac{1}{7}\) x using the same coordinate plane in part (e). What do you notice about the graph of all the input/output pairs that describes Giselle’s constant rate of running and the graph of the equation y = \(\frac{1}{7}\) x?
Answer:
The graphs of the equation and the function coincide completely.

Exercise 2.
Sketch the graph of the equation y = x2 for positive values of x. Organize your work using the table below, and then answer the questions that follow.
Engage NY Math Grade 8 Module 5 Lesson 5 Exercise Answer Key 3
Answer:
Engage NY Math Grade 8 Module 5 Lesson 5 Exercise Answer Key 4
a. Plot the ordered pairs on the coordinate plane.
Engage NY Math Grade 8 Module 5 Lesson 5 Exercise Answer Key 5
Answer:
Engage NY Math Grade 8 Module 5 Lesson 5 Exercise Answer Key 6

b. What shape does the graph of the points appear to take?
Answer:
It appears to take the shape of a curve.

c. Is this equation a linear equation? Explain.
Answer:
No, the equation y = x2 is not a linear equation because the exponent of x is greater than 1.

d. Consider the function that assigns to each square of side length s units its area A square units. Write an equation that describes this function.
Answer:
A = s2

e. What do you think the graph of all the input/output pairs (s, A) of this function will look like? Explain.
Answer:
I think the graph of input/output pairs will look like the graph of the equation y = x2. The inputs and outputs would match the solutions to the equation exactly. For the equation, the y value is the square of the x value. For the function, the output is the square of the input.

f. Use the function you wrote in part (d) to determine the area of a square with side length 2.5 units. Write the input and output as an ordered pair. Does this point appear to belong to the graph of y = x2?
Answer:
A = (2.5)2
A = 6.25
The area of the square is 6.25 units squared. (2.5, 6.25) The point looks like it would belong to the graph of y = x2; it looks like it would be on the curve that the shape of the graph is taking.

Exercise 3.
The number of devices a particular manufacturing company can produce is a function of the number of hours spent making the devices. On average, 4 devices are produced each hour. Assume that devices are produced at a constant rate.
a. Write an equation in two variables that describes the number of devices, y, as a function of the time the company spends making the devices, x.
Answer:
\(\frac{4}{1}\) = \(\frac{y}{x}\)
y = 4x

b. Use the equation you wrote in part (a) to determine how many devices are produced in 8 hours.
Answer:
y = 4(8)
y = 32
The company produces 32 devices in 8 hours.

c. Use the equation you wrote in part (a) to determine how many devices are produced in 6 hours.
Answer:
y = 4(6)
y = 24
The company produces 24 devices in 6 hours.

d. Use the equation you wrote in part (a) to determine how many devices are produced in 4 hours.
Answer:
y = 4(4)
y = 16
The company produces 16 devices in 4 hours.

e. The input of the function, x, is time, and the output of the function, y, is the number of devices produced. Write the inputs and outputs from parts (b)–(d) as ordered pairs, and plot them as points on a coordinate plane.
Engage NY Math Grade 8 Module 5 Lesson 5 Exercise Answer Key 7
Answer:
Engage NY Math Grade 8 Module 5 Lesson 5 Exercise Answer Key 8
(8, 32), (6, 24), (4, 16)

f. What shape does the graph of the points appear to take?
Answer:
The points appear to be in a line.

g. Is the function discrete?
Answer:
The function is not discrete because we can find the number of devices produced for any given time, including fractions of an hour.

h. Use the equation you wrote in part (a) to determine how many devices are produced in 1.5 hours. Write your answer as an ordered pair, as you did in part (e), and include the point on the graph. Is the point in a place where you expected it to be? Explain.
Answer:
y = 4(1.5)
y = 6
(1.5, 6) The point is where I expected it to be because it is in line with the other points.

i. Assume you used the equation that describes the function to determine how many devices are produced for any given time and wrote each answer as an ordered pair. Where do you think these points would appear on the graph?
Answer:
I think all of the points would fall on a line.

j. What do you think the graph of all possible input/output pairs will look like? Explain.
Answer:
I think the graph of this function will be a line. Since the rate is continuous, we can find all of the points that represent fractional intervals of time. We also know that devices are produced at a constant rate, so we would expect that as the time spent producing devices increases, the number of devices produced would increase at the same rate.

k. Connect the points you have graphed to make a line. Select a point on the graph that has integer coordinates. Verify that this point has an output that the function would assign to the input.
Answer:
Answers will vary. Sample student work:
The point (5, 20) is a point on the graph.
y = 4x
20 = 4(5)
20 = 20
The function assigns the output of 20 to the input of 5.

l. Sketch the graph of the equation y = 4x using the same coordinate plane in part (e). What do you notice about the graph of input/output pairs that describes the company’s constant rate of producing devices and the graph of the equation y = 4x?
Answer:
The graphs of the equation and the function coincide completely.

Exploratory Challenge/Exercise 4.
Examine the three graphs below. Which, if any, could represent the graph of a function? Explain why or why not for each graph.
Graph 1:
Engage NY Math Grade 8 Module 5 Lesson 5 Exercise Answer Key 9
Answer:
This is the graph of a function. Each input is a real number x, and we see from the graph that there is an output y to associate with each such input. For example, the ordered pair (-2, 4) on the line associates the output 4 to the input -2.

Graph 2:
Engage NY Math Grade 8 Module 5 Lesson 5 Exercise Answer Key 10
Answer:
This is not the graph of a function. The ordered pairs (6, 4) and (6, 6) show that for the input of 6 there are two different outputs, both 4 and 6. We do not have a function.

Graph 3:
Engage NY Math Grade 8 Module 5 Lesson 5 Exercise Answer Key 11
Answer:
This is the graph of a function. The ordered pairs (-3, -9), (-2, -4), (-1, -1), (0, 0), (1, -1), (2, -4), and (3, -9) represent inputs and their unique outputs.

Eureka Math Grade 8 Module 5 Lesson 5 Problem Set Answer Key

Question 1.
The distance that Scott walks is a function of the time he spends walking. Scott can walk \(\frac{1}{2}\) mile every 8 minutes. Assume he walks at a constant rate.
a. Predict the shape of the graph of the function. Explain.
Answer:
The graph of the function will likely be a line because a linear equation can describe Scott’s motion, and I know that the graph of the function will be the same as the graph of the equation.

b. Write an equation to represent the distance that Scott can walk in miles, y, in x minutes.
Answer:
\(\frac{0.5}{8}\) = \(\frac{y}{x}\)
y = \(\frac{0.5}{8}\) x
y = \(\frac{1}{16}\) x

c. Use the equation you wrote in part (b) to determine how many miles Scott can walk in 24 minutes.
Answer:
y = \(\frac{1}{16}\) (24)
y = 1.5
Scott can walk 1.5 miles in 24 minutes.

d. Use the equation you wrote in part (b) to determine how many miles Scott can walk in 12 minutes.
Answer:
y = \(\frac{1}{16}\) (12)
y = \(\frac{3}{4}\)
Scott can walk 0.75 miles in 12 minutes.

e. Use the equation you wrote in part (b) to determine how many miles Scott can walk in 16 minutes.
Answer:
y = \(\frac{1}{16}\) (16)
y = 1
Scott can walk 1 mile in 16 minutes.

f. Write your inputs and corresponding outputs as ordered pairs, and then plot them on a coordinate plane.
Eureka Math 8th Grade Module 5 Lesson 5 Problem Set Answer Key 1
Answer:
(24, 1.5), (12, 0.75), (16, 1)
Eureka Math 8th Grade Module 5 Lesson 5 Problem Set Answer Key 2

g. What shape does the graph of the points appear to take? Does it match your prediction?
Answer:
The points appear to be in a line. Yes, as I predicted, the graph of the function is a line.

h. Connect the points to make a line. What is the equation of the line?
Answer:
It is the equation that described the function: y = \(\frac{1}{16}\) x.

Question 2.
Graph the equation y = x3 for positive values of x. Organize your work using the table below, and then answer the questions that follow.
Eureka Math 8th Grade Module 5 Lesson 5 Problem Set Answer Key 3
Answer:
Eureka Math 8th Grade Module 5 Lesson 5 Problem Set Answer Key 4

a. Plot the ordered pairs on the coordinate plane.
Eureka Math 8th Grade Module 5 Lesson 5 Problem Set Answer Key 5
Answer:
Eureka Math 8th Grade Module 5 Lesson 5 Problem Set Answer Key 6

b. What shape does the graph of the points appear to take?
Answer:
It appears to take the shape of a curve.

c. Is this the graph of a linear function? Explain.
Answer:
No, this is not the graph of a linear function. The equation y = x3 is not a linear equation.

d. Consider the function that assigns to each positive real number s the volume V of a cube with side length s units. An equation that describes this function is V = s3. What do you think the graph of this function will look like? Explain.
Answer:
I think the graph of this function will look like the graph of the equation y = x3. The inputs and outputs would match the solutions to the equation exactly. For
the equation, the y-value is the cube of the x-value.
For the function, the output is the cube of the input.

e. Use the function in part (d) to determine the volume of a cube with side length of 3 units. Write the input and output as an ordered pair. Does this point appear to belong to the graph of y = x3?
Answer:
V = (3)3
V = 27
(3, 27) The point looks like it would belong to the graph of y = x3; it looks like it would be on the curve that the shape of the graph is taking.

Question 3.
Sketch the graph of the equation y = 180(x – 2) for whole numbers. Organize your work using the table below, and then answer the questions that follow.
Eureka Math 8th Grade Module 5 Lesson 5 Problem Set Answer Key 7
Answer:
Eureka Math 8th Grade Module 5 Lesson 5 Problem Set Answer Key 8

a. Plot the ordered pairs on the coordinate plane.
Eureka Math 8th Grade Module 5 Lesson 5 Problem Set Answer Key 9
Answer:
Eureka Math 8th Grade Module 5 Lesson 5 Problem Set Answer Key 10

b. What shape does the graph of the points appear to take?
Answer:
It appears to take the shape of a line.

c. Is this graph a graph of a function? How do you know?
Answer:
It appears to be a function because each input has exactly one output.

d. Is this a linear equation? Explain.
Answer:
Yes, y = 180(x – 2) is a linear equation. It can be rewritten as y = 180x-360.

e. The sum S of interior angles, in degrees, of a polygon with n sides is given by S = 180(n-2). If we take this equation as defining S as a function of n, how do you think the graph of this S will appear? Explain.
Answer:
I think the graph of this function will look like the graph of the equation y = 180(x-2). The inputs and outputs would match the solutions to the equation exactly.

f. Is this function discrete? Explain.
Answer:
The function S = 180(n – 2) is discrete. The inputs are the number of sides, which are integers. The input, n, must be greater than 2 since three sides is the smallest number of sides for a polygon.

Question 4.
Examine the graph below. Could the graph represent the graph of a function? Explain why or why not.
Eureka Math 8th Grade Module 5 Lesson 5 Problem Set Answer Key 11
Answer:
This is not the graph of a function. The ordered pairs (1, 0) and (1, -1) show that for the input of 1 there are two different outputs, both 0 and -1. For that reason, this cannot be the graph of a function because it does not fit the definition of a function.

Question 5.
Examine the graph below. Could the graph represent the graph of a function? Explain why or why not.
Eureka Math 8th Grade Module 5 Lesson 5 Problem Set Answer Key 12
Answer:
This is not the graph of a function. The ordered pairs (2, -1) and (2, -3) show that for the input of 2 there are two different outputs, both -1 and -3. Further, the ordered pairs (5, -3) and (5, -4) show that for the input of 5 there are two different outputs, both -3 and -4. For these reasons, this cannot be the graph of a function because it does not fit the definition of a function.

Question 6.
Examine the graph below. Could the graph represent the graph of a function? Explain why or why not.
Eureka Math 8th Grade Module 5 Lesson 5 Problem Set Answer Key 13
Answer:
This is the graph of a function. The ordered pairs (-2, -4), (-1, -3), (0, -2), (1, -1), (2, 0), and (3, 1) represent inputs and their unique outputs. By definition, this is a function.

Eureka Math Grade 8 Module 5 Lesson 5 Exit Ticket Answer Key

Question 1.
Water flows from a hose at a constant rate of 11 gallons every 4 minutes. The total amount of water that flows from the hose is a function of the number of minutes you are observing the hose.
a. Write an equation in two variables that describes the amount of water, y, in gallons, that flows from the hose as a function of the number of minutes, x, you observe it.
Answer:
\(\frac{11}{4}\) = \(\frac{y}{x}\)
y = \(\frac{11}{4}\) x

b. Use the equation you wrote in part (a) to determine the amount of water that flows from the hose during an 8-minute period, a 4-minute period, and a 2-minute period.
Answer:
y = \(\frac{11}{4}\) (8)
y = 22
In 8 minutes, 22 gallons of water flow out of the hose.
y = \(\frac{11}{4}\) (4)
y = 11
In 4 minutes, 11 gallons of water flow out of the hose.
y = \(\frac{11}{4}\) (2)
y = 5.5
In 2 minutes, 5.5 gallons of water flow out of the hose.

c. An input of the function, x, is time in minutes, and the output of the function, y, is the amount of water that flows out of the hose in gallons. Write the inputs and outputs from part (b) as ordered pairs, and plot them as points on the coordinate plane.
Eureka Math Grade 8 Module 5 Lesson 5 Exit Ticket Answer Key 1
Answer:
(8, 22), (4, 11), (2, 5.5)
Eureka Math Grade 8 Module 5 Lesson 5 Exit Ticket Answer Key 2

Eureka Math Grade 8 Module 5 Lesson 4 Answer Key

Engage NY Eureka Math 8th Grade Module 5 Lesson 4 Answer Key

Eureka Math Grade 8 Module 5 Lesson 4 Example Answer Key

Example 1.
Classify each of the functions described below as either discrete or not discrete.
a. The function that assigns to each whole number the cost of buying that many cans of beans in a particular grocery store.
b. The function that assigns to each time of day one Wednesday the temperature of Sammy’s fever at that time.
c. The function that assigns to each real number its first digit.
d. The function that assigns to each day in the year 2015 my height at noon that day.
e. The function that assigns to each moment in the year 2015 my height at that moment.
f. The function that assigns to each color the first letter of the name of that color.
g. The function that assigns the number 23 to each and every real number between 20 and 30.6.
h. The function that assigns the word YES to every yes/no question.
i. The function that assigns to each height directly above the North Pole the temperature of the air at that height right at this very moment.
Answer:
a) Discrete
b) Not discrete
c) Not discrete
d) Discrete
e) Not discrete
f) Discrete
g) Not discrete
h) Discrete
i) Not discrete

Example 2.
Water flows from a faucet into a bathtub at a constant rate of 7 gallons of water every 2 minutes Regard the volume of water accumulated in the tub as a function of the number of minutes the faucet has be on. Is this function discrete or not discrete?
Answer:
→ Assuming the tub is initially empty, we determined last lesson that the volume of water in the tub is given by y = 3.5x, where y is the volume of water in gallons, and x is the number of minutes the faucet has been on.

→ What limitations are there on x and y?
Both x and y should be positive numbers because they represent time and volume.

→ Would this function be considered discrete or not discrete? Explain.
This function is not discrete because we can assign any positive number to x, not just positive integers.

Example 3.
You have just been served freshly made soup that is so hot that it cannot be eaten. You measure the temperature of the soup, and it is 210°F. Since 212°F is boiling, there is no way it can safely be eaten yet. One minute after receiving the soup, the temperature has dropped to 203°F. If you assume that the rate at which the soup cools is constant, write an equation that would describe the temperature of the soup over time.
Answer:
The temperature of the soup dropped 7°F in one minute. Assuming the cooling continues at the same rate, then if y is the temperature of the soup after x minutes, then, y = 210 – 7x.
→ We want to know how long it will be before the temperature of the soup is at a more tolerable temperature of 147°F. The difference in temperature from 210°F to 147°F is 63°F. For what number x will our function have the value 147?
147 = 210 – 7x; then 7x = 63, and so x = 9.
→ Curious whether or not you are correct in assuming the cooling rate of the soup is constant, you decide to measure the temperature of the soup each minute after its arrival to you. Here’s the data you obtain:
Engage NY Math 8th Grade Module 5 Lesson 4 Example Answer Key 1
Our function led us to believe that after 9 minutes the soup would be safe to eat. The data in the table shows that it is still too hot.

→ What do you notice about the change in temperature from one minute to the next?
For the first few minutes, minute 2 to minute 5, the temperature decreased 6°F each minute. From minute 5 to minute 9, the temperature decreased just 5°F each minute.
→ Since the rate of cooling at each minute is not constant, this function is said to be a nonlinear function.

→ Sir Isaac Newton not only studied the motion of objects under gravity but also studied the rates of cooling of heated objects. He found that they do not cool at constant rates and that the functions that describe their temperature over time are indeed far from linear. (In fact, Newton’s theory establishes that the temperature of soup at time x minutes would actually be given by the formula y = 70 + 140(\(\frac{133}{140}\))x.)

Example 4.
Consider the function that assigns to each of nine baseball players, numbered 1 through 9, his height. The data for this function is given below. Call the function G.
Engage NY Math 8th Grade Module 5 Lesson 4 Example Answer Key 2
Answer:
→ What output does G assign to the input 2?
The function G assigns the height 5′ 4” to the player 2.

→ Could the function G simultaneously assign a second, different output to player 2? Explain.
No. The function assigns height to a particular player. There is no way that a player can have two different heights.
→ It is not clear if there is a formula for this function. (And even if there were, it is not clear that it would be meaningful since who is labeled player 1, player 2, and so on is probably arbitrary.) In general, we can hope to have formulas for functions, but in reality we cannot expect to find them. (People would love to have a formula that explains and predicts the stock market, for example.)

→ Can we classify this function as discrete or not discrete? Explain.
This function would be described as discrete because the inputs are particular players.

Eureka Math Grade 8 Module 5 Lesson 4 Exercise Answer Key

Exercises 1–3

Exercise 1.
At a certain school, each bus in its fleet of buses can transport 35 students. Let B be the function that assigns to each count of students the number of buses needed to transport that many students on a field trip.

When Jinpyo thought about matters, he drew the following table of values and wrote the formula B = x/35. Here x is the count of students, and B is the number of buses needed to transport that many students. He concluded that B is a linear function.
Engage NY Math Grade 8 Module 5 Lesson 4 Exercise Answer Key 1
Alicia looked at Jinpyo’s work and saw no errors with his arithmetic. But she said that the function is not actually linear.
a. Alicia is right. Explain why B is not a linear function.
Answer:
For 36 students, say, we’ll need two buses—an extra bus for the extra student. In fact, for 36,37, …, up to 70 students, the function B assigns the same value 2. For 71,72, …, up to 105, it assigns the value 3. There is not a constant rate of increase of the buses needed, and so the function is not linear.

b. Is B a discrete function?
Answer:
It is a discrete function.

Exercise 2.
A linear function has the table of values below. It gives the costs of purchasing certain numbers of movie tickets.
Engage NY Math Grade 8 Module 5 Lesson 4 Exercise Answer Key 2
a. Write the linear function that represents the total cost, y, for x tickets purchased.
Answer:
y = \(\frac{27.75}{2}\) x
y = 9.25x

b. Is the function discrete? Explain.
Answer:
The function is discrete. You cannot have half of a movie ticket; therefore, it must be a whole number of tickets, which means it is discrete.

c. What number does the function assign to 4? What do the question and your answer mean?
Answer:
It is asking us to determine the cost of buying 4 tickets. The function assigns 37 to 4. The answer means that 4 tickets will cost $37.00.

Exercise 3.
A function produces the following table of values.
Engage NY Math Grade 8 Module 5 Lesson 4 Exercise Answer Key 3
a. Make a guess as to the rule this function follows. Each input is a word from the English language.
Answer:
This function assigns to each word its first letter.

b. Is this function discrete?
Answer:
It is discrete.

Eureka Math Grade 8 Module 5 Lesson 4 Problem Set Answer Key

Question 1.
The costs of purchasing certain volumes of gasoline are shown below. We can assume that there is a linear relationship between x, the number of gallons purchased, and y, the cost of purchasing that many gallons.
Eureka Math 8th Grade Module 5 Lesson 4 Problem Set Answer Key 1
a. Write an equation that describes y as a linear function of x.
Answer:
y = 3.65x

b. Are there any restrictions on the values x and y can adopt?
Answer:
Both x and y must be positive rational numbers.

c. Is the function discrete?
Answer:
The function is not discrete.

d. What number does the linear function assign to 20? Explain what your answer means.
Answer:
y = 3.65(20)
y = 73
The function assigns 73 to 20. It means that if 20 gallons of gas are purchased, it will cost $73.00.

Question 2.
A function has the table of values below. Examine the information in the table to answer the questions below.
Eureka Math 8th Grade Module 5 Lesson 4 Problem Set Answer Key 2
a. Describe the function.
Answer:
The function assigns those particular numbers to those particular seven words. We don’t know if the function accepts any more inputs and what it might assign to those additional inputs. (Though it does seem compelling to say that this function assigns to each positive whole number the count of letters in the name of that whole number.)

b. What number would the function assign to the word eleven?
Answer:
We do not have enough information to tell. We are not even sure if eleven is considered a valid input for this function.

Question 3.
The table shows the distances covered over certain counts of hours traveled by a driver driving a car at a constant speed.
Eureka Math 8th Grade Module 5 Lesson 4 Problem Set Answer Key 3
a. Write an equation that describes y, the number of miles covered, as a linear function of x, number of hours driven.
Answer:
y = \(\frac{141}{3}\) x
y = 47x

b. Are there any restrictions on the value x and y can adopt?
Answer:
Both x and y must be positive rational numbers.

c. Is the function discrete?
Answer:
The function is not discrete.

d. What number does the function assign to 8? Explain what your answer means.
Answer:
y = 47(8)
y = 376
The function assigns 376 to 8. The answer means that 376 miles are driven in 8 hours.

e. Use the function to determine how much time it would take to drive 500 miles.
Answer:
500 = 47x
\(\frac{500}{47}\) = x
10.63829… = x
10.6 ≈ x
It would take about 10.6 hours to drive 500 miles.

Question 4.
Consider the function that assigns to each time of a particular day the air temperature at a specific location in Ithaca, NY. The following table shows the values of this function at some specific times.
Eureka Math 8th Grade Module 5 Lesson 4 Problem Set Answer Key 4
a. Let y represent the air temperature at time x hours past noon. Verify that the data in the table satisfies the linear equation y = 92 – 1.5x.
Answer:
At 12:00, 0 hours have passed since 12:00; then, y = 92 – 1.5(0) = 92.
At 1:00, 1 hour has passed since 12:00; then, y = 92 – 1.5(1) = 90.5.
At 2:00, 2 hours have passed since 12:00; then, y = 92 – 1.5(2) = 89.
At 4:00, 4 hours have passed since 12:00; then, y = 92 – 1.5(4) = 86.
At 8:00, 8 hours have passed since 12:00; then, y = 92 – 1.5(8) = 80.

b. Are there any restrictions on the types of values x and y can adopt?
Answer:
The input is a particular time of the day, and y is the temperature. The input cannot be negative but could be intervals that are fractions of an hour. The output could potentially be negative because it can get that cold.

c. Is the function discrete?
Answer:
The function is not discrete.

d. According to the linear function of part (a), what will the air temperature be at 5:30 p.m.?
Answer:
At 5:30, 5.5 hours have passed since 12:00; then y = 92 – 1.5(5.5) = 83.75.
The temperature at 5:30 will be 83.75°F.

e. Is it reasonable to assume that this linear function could be used to predict the temperature for 10:00 a.m. the following day or a temperature at any time on a day next week? Give specific examples in your explanation.
Answer:
No. There is no reason to expect this function to be linear. Temperature typically fluctuates and will, for certain, rise at some point.
We can show that our model for temperature is definitely wrong by looking at the predicted temperature one week (168 hours) later:
y = 92 – 1.5(168)
y = – 160.
This is an absurd prediction.

Eureka Math Grade 8 Module 5 Lesson 4 Exit Ticket Answer Key

Question 1.
The table below shows the costs of purchasing certain numbers of tablets. We can assume that the total cost is a linear function of the number of tablets purchased.
Eureka Math Grade 8 Module 5 Lesson 4 Exit Ticket Answer Key 1
a. Write an equation that describes the total cost, y, as a linear function of the number, x, of tablets purchased.
Answer:
y = \(\frac{10,183}{17}\) x
y = 599x

b. Is the function discrete? Explain.
Answer:
The function is discrete. You cannot have half of a tablet; therefore, it must be a whole number of tablets, which means it is discrete.

c. What number does the function assign to 7? Explain.
Answer:
The function assigns 4,193 to 7, which means that the cost of 7 tablets would be $4,193.00.

Question 2.
A function C assigns to each word in the English language the number of letters in that word. For example, C assigns the number 6 to the word action.
a. Give an example of an input to which C would assign the value 3.
Answer:
Any three – letter word will do.

b. Is C a discrete function? Explain.
Answer:
The function is discrete. The input is a word in the English language, therefore it must be an entire word, not part of one, which means it is discrete.

Eureka Math Grade 8 Module 5 Lesson 3 Answer Key

Engage NY Eureka Math 8th Grade Module 5 Lesson 3 Answer Key

Eureka Math Grade 8 Module 5 Lesson 3 Example Answer Key

Example 1.
In the last lesson, we looked at several tables of values showing the inputs and outputs of functions. For instance, one table showed the costs of purchasing different numbers of bags of candy:
Engage NY Math 8th Grade Module 5 Lesson 3 Example Answer Key 1
Answer:
→ What do you think a linear function is?
A linear function is likely a function with a rule described by a linear equation. Specifically, the rate of change in the situation being described is constant, and the graph of the equation is a line.

→ Do you think this is a linear function? Justify your answer.
Yes, this is a linear function because there is a proportional relationship:
\(\frac{10.00}{8}\) = 1.25; $1.25 per each bag of candy
\(\frac{5.00}{4}\) = 1.25; $1.25 per each bag of candy
\(\frac{2.50}{2}\) = 1.25; $1.25 per each bag of candy
The total cost is increasing at a rate of $1.25 with each bag of candy. Further justification comes from the graph of the data shown below.
Engage NY Math 8th Grade Module 5 Lesson 3 Example Answer Key 2
→ A linear function is a function with a rule that can be described by a linear equation. That is, if we use x to denote an input of the function and y its matching output, then the function is linear if the rule for the function can be described by the equation y = mx + b for some numbers m and b.

→ What rule or equation describes our cost function for bags of candy?
The rule that represents the function is then y = 1.25x.

→ Notice that the constant m is 1.25, which is the cost of one bag of candy, and the constant b is 0. Also notice that the constant m was found by calculating the unit rate for a bag of candy.
No matter the value of x chosen, as long as x is a nonnegative integer, the rule y = 1.25x gives the cost of purchasing that many bags of candy. The total cost of candy is a function of the number of bags purchased.

→ Why must we set x as a nonnegative integer for this function?
Since x represents the number of bags of candy, it does not make sense that there would be a negative number of bags. It is also unlikely that we might be allowed to buy fractional bags of candy, and so we require x to be a whole number.

→ Would you say that the table represents all possible inputs and outputs? Explain.
No, it does not represent all possible inputs and outputs. Someone can purchase more than 8 bags of candy, and inputs greater than 8 are not represented by this table (unless the store has a limit on the number of bags one may purchase, perhaps).

Example 2.
Walter walks at a constant speed of 8 miles every 2 hours. Describe a linear function for the number of miles he walks in x hours. What is a reasonable range of x-values for this function?
Answer:
→ Consider the following rate problem: Walter walks at a constant speed of 8 miles every 2 hours. Describe a linear function for the number of miles he walks in x hours. What is a reasonable range of x-values for this function?
Walter’s average speed of walking 8 miles is \(\frac{8}{2}\) = 4, or 4 miles per hour.

→ We have y = 4x, where y is the distance walked in x hours. It seems reasonable to say that x is any real number between 0 and 20, perhaps? (Might there be a cap on the number of hours he walks? Perhaps we are counting up the number of miles he walks over a lifetime?)

→ In the last example, the total cost of candy was a function of the number of bags purchased. Describe the function in this walking example.
The distance that Walter travels is a function of the number of hours he spends walking.

→ What limitations did we put on x?
We must insist that x ≥ 0. Since x represents the time Walter walks, then it makes sense that he would walk for a positive amount of time or no time at all.
→ Since x is positive, then we know that the distance y will also be positive.

Example 3.
Veronica runs at a constant speed. The distance she runs is a function of the time she spends running. The function has the table of values shown below.
Engage NY Math 8th Grade Module 5 Lesson 3 Example Answer Key 3
Answer:
→ Since Veronica runs at a constant speed, we know that her average speed over any time interval will be the same. Therefore, Veronica’s distance function is a linear function. Write the equation that describes her distance function.
The function that represents Veronica’s distance is described by the equation y = \(\frac{1}{8}\) x, where y is the distance in miles Veronica runs in x minutes and x,y≥0.

→ Describe the function in terms of distance and time.
The distance that Veronica runs is a function of the number of minutes she spends running.

Example 4.
Water flows from a faucet into a bathtub at the constant rate of 7 gallons of water pouring out every 2 minutes. The bathtub is initially empty, and its plug is in. Determine the rule that describes the volume of water in the tub as a function of time. If the tub can hold 50 gallons of water, how long will it take to fill the tub?
Answer:
The rate of water flow is \(\frac{7}{2}\), or 3.5 gallons per minute. Then the rule that describes the volume of water in the tub as a function of time is y = 3.5x, where y is the volume of water, and x is the number of minutes the faucet has been on.
To find the time when y = 50, we need to look at the equation 50 = 3.5x. This gives x = \(\frac{50}{3.5}\) = 14.2857… ≈ 14 . It will take about 14 minutes to fill the tub.

Assume that the faucet is filling a bathtub that can hold 50 gallons of water. How long will it take the faucet to fill the tub?
Since we want the total volume to be 50 gallons, then
50 = 3.5x
\(\frac{50}{3.5}\) = x
14.2857… = x
14 ≈ x
It will take about 14 minutes to fill a tub that has a volume of 50 gallons.

Now assume that you are filling the same 50-gallon bathtub with water flowing in at the constant rate of 3.5 gallons per minute, but there were initially 8 gallons of water in the tub. Will it still take about 14 minutes to fill the tub?
Answer:
No. It will take less time because there is already some water in the tub.

Engage NY Math 8th Grade Module 5 Lesson 3 Example Answer Key 4
→ What now is the appropriate equation describing the volume of water in the tub as a function of time?
If y is the volume of water that flows from the faucet, and x is the number of minutes the faucet has been on, then y = 3.5x + 8.

→ How long will it take to fill the tub according to this equation?
Since we still want the total volume of the tub to be 50 gallons, then:
50 = 3.5x + 8
42 = 3.5x
12 = x
It will take 12 minutes for the faucet to fill a 50-gallon tub when 8 gallons are already in it.
(Be aware that some students may observe that we can use the previous function rule y = 3.5x to answer this question by noting that we need to add only 42 more gallons to the tub. This will lead directly to the equation 42 = 3.5x.)
→ Generate a table of values for this function:
Engage NY Math 8th Grade Module 5 Lesson 3 Example Answer Key 5

Example 5.
Water flows from a faucet at a constant rate. Assume that 6 gallons of water are already in a tub by the time we notice the faucet is on. This information is recorded in the first column of the table below. The other columns show how many gallons of water are in the tub at different numbers of minutes since we noticed the running faucet.
Engage NY Math 8th Grade Module 5 Lesson 3 Example Answer Key 6
Answer:
→ After 3 minutes pass, there are 9.6 gallons in the tub. How much water flowed from the faucet in those 3 minutes? Explain.
Since there were already 6 gallons in the tub, after 3 minutes an additional 3.6 gallons filled the tub.

→ Use this information to determine the rate of water flow.
In 3 minutes, 3.6 gallons were added to the tub, then \(\frac{3.6}{3}\) = 1.2, and the faucet fills the tub at a rate of 1.2 gallons per minute.

→ Verify that the rate of water flow is correct using the other values in the table.
Sample student work:
5(1.2) = 6, and since 6 gallons were already in the tub, the total volume in the tub is 12 gallons.
9(1.2) = 10.8, and since 6 gallons were already in the tub, the total volume in the tub is 16.8 gallons.

→ Write an equation that describes the volume of water in the tub as a function of time.
The volume function that represents the rate of water flow from the faucet is y = 1.2x + 6, where y is the volume of water in the tub, and x is the number of minutes that have passed since we first noticed the faucet being on.

→ For how many minutes was the faucet on before we noticed it? Explain.
Since 6 gallons were in the tub by the time we noticed the faucet was on, we need to determine how many minutes it takes for 6 gallons to flow into the tub. The columns for x = 0 and x = 5 in the table show that six gallons of water pour in the tub over a five-minute period. The faucet was on for 5 minutes before we noticed it.

Eureka Math Grade 8 Module 5 Lesson 3 Exercise Answer Key

Exercises 1–3

Exercise 1.
Hana claims she mows lawns at a constant rate. The table below shows the area of lawn she can mow over different time periods.
Engage NY Math Grade 8 Module 5 Lesson 3 Exercise Answer Key 1
a. Is the data presented consistent with the claim that the area mowed is a linear function of time?
Answer:
Sample responses:
Linear functions have a constant rate of change. When we compare the rates at each interval of time, they will be equal to the same constant.
When the data is graphed on the coordinate plane, it appears to make a line.

b. Describe in words the function in terms of area mowed and time.
Answer:
The total area mowed is a function of the number of minutes spent mowing.

c. At what rate does Hana mow lawns over a 5-minute period?
Answer:
\(\frac{36}{5}\) = 7.2
The rate is 7.2 square feet per minute.

d. At what rate does Hana mow lawns over a 20-minute period?
Answer:
\(\frac{144}{20}\) = 7.2
The rate is 7.2 square feet per minute.

e. At what rate does Hana mow lawns over a 30-minute period?
Answer:
\(\frac{216}{30}\) = 7.2
The rate is 7.2 square feet per minute.

f. At what rate does Hana mow lawns over a 50-minute period?
Answer:
\(\frac{360}{50}\) = 7.2
The rate is 7.2 square feet per minute.

g. Write the equation that describes the area mowed, y, in square feet, as a linear function of time, x, in minutes.
Answer:
y = 7.2x

h. Describe any limitations on the possible values of x and y.
Answer:
Both x and y must be positive numbers. The symbol x represents time spent mowing, which means it should be positive. Similarly, y represents the area mowed, which should also be positive.

i. What number does the function assign to x = 24? That is, what area of lawn can be mowed in 24 minutes?
Answer:
y = 7.2(24)
y = 172.8
In 24 minutes, an area of 172.8 square feet can be mowed.

j. According to this work, how many minutes would it take to mow an area of 400 square feet?
Answer:
400 = 7.2x
\(\frac{400}{7.2}\) = x
55.555… = x
56 ≈ x
It would take about 56 minutes to mow an area of 400 square feet.

Exercise 2.
A linear function has the table of values below. The information in the table shows the total volume of water, in gallons, that flows from a hose as a function of time, the number of minutes the hose has been running.
Engage NY Math Grade 8 Module 5 Lesson 3 Exercise Answer Key 2
a. Describe the function in terms of volume and time.
Answer:
The total volume of water that flows from a hose is a function of the number of minutes the hose is left on.

b. Write the rule for the volume of water in gallons, y, as a linear function of time, x, given in minutes.
Answer:
y = \(\frac{44}{10}\) x
y = 4.4x

c. What number does the function assign to 250? That is, how many gallons of water flow from the hose during a period of 250 minutes?
Answer:
y = 4.4(250)
y = 1100
In 250 minutes, 1,100 gallons of water flow from the hose.

d. The average swimming pool holds about 17,300 gallons of water. Suppose such a pool has already been filled one quarter of its volume. Write an equation that describes the volume of water in the pool if, at time 0 minutes, we use the hose described above to start filling the pool.
Answer:
\(\frac{1}{4}\) (17300) = 4325
y = 4.4x + 4325

e. Approximately how many hours will it take to finish filling the pool?
Answer:
17300 = 4.4x + 4325
12975 = 4.4x
\(\frac{12975}{4.4}\) = x
2948.8636… = x
2949 ≈ x
\(\frac{2949}{60}\) = 49.15
It will take about 49 hours to fill the pool with the hose.

Exercise 3.
Recall that a linear function can be described by a rule in the form of y = mx + b, where m and b are constants. A particular linear function has the table of values below.
Engage NY Math Grade 8 Module 5 Lesson 3 Exercise Answer Key 3
Answer:
a. What is the equation that describes the function?
Answer:
y = 5x + 4

b. Complete the table using the rule.
Answer:
Engage NY Math Grade 8 Module 5 Lesson 3 Exercise Answer Key 4

Eureka Math Grade 8 Module 5 Lesson 3 Problem Set Answer Key

Question 1.
A food bank distributes cans of vegetables every Saturday. The following table shows the total number of cans they have distributed since the beginning of the year. Assume that this total is a linear function of the number of weeks that have passed.
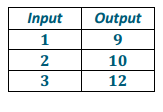
Eureka Math 8th Grade Module 5 Lesson 3 Problem Set Answer Key 1
a. Describe the function being considered in words.
Answer:
The total number of cans handed out is a function of the number of weeks that pass.

b. Write the linear equation that describes the total number of cans handed out, y, in terms of the number of weeks, x, that have passed.
Answer:
y = \(\frac{180}{1}\) x
y = 180x

c. Assume that the food bank wants to distribute 20,000 cans of vegetables. How long will it take them to meet that goal?
Answer:
20 000 = 180x
\(\frac{20000}{180}\) = x
111.1111… = x
111 ≈ x
It will take about 111 weeks to distribute 20,000 cans of vegetables, or about 2 years.

d. The manager had forgotten to record that they had distributed 35,000 cans on January 1. Write an adjusted linear equation to reflect this forgotten information.
Answer:
y = 180x + 35 000

e. Using your function in part (d), determine how long in years it will take the food bank to hand out 80,000 cans of vegetables.
Answer:
80 000 = 180x + 35 000
45 000 = 180x
\(\frac{45000}{180}\) = x
250 = x
To determine the number of years:
\(\frac{250}{52}\) = 4.8076… ≈ 4.8
It will take about 4.8 years to distribute 80,000 cans of vegetables.

Question 2.
A linear function has the table of values below. It gives the number of miles a plane travels over a given number of hours while flying at a constant speed.
Eureka Math 8th Grade Module 5 Lesson 3 Problem Set Answer Key 2
a. Describe in words the function given in this problem.
Answer:
The total distance traveled is a function of the number of hours spent flying.

b. Write the equation that gives the distance traveled, y, in miles, as a linear function of the number of hours, x, spent flying.
Answer:
y = \(\frac{1062.5}{2.5}\) x
y = 425x

c. Assume that the airplane is making a trip from New York to Los Angeles, which is a journey of approximately 2,475 miles. How long will it take the airplane to get to Los Angeles?
Answer:
2475 = 425x
\(\frac{2475}{425}\) = x
5.82352… = x
5.8 ≈ x
It will take about 5.8 hours for the airplane to fly 2,475 miles.

d. If the airplane flies for 8 hours, how many miles will it cover?
Answer:
y = 425(8)
y = 3400
The airplane would travel 3,400 miles in 8 hours.

Question 3.
A linear function has the table of values below. It gives the number of miles a car travels over a given number of hours.
Eureka Math 8th Grade Module 5 Lesson 3 Problem Set Answer Key 3
a. Describe in words the function given.
Answer:
The total distance traveled is a function of the number of hours spent traveling.

b. Write the equation that gives the distance traveled, in miles, as a linear function of the number of hours spent driving.
Answer:
y = \(\frac{203}{3.5}\) x
y = 58x

c. Assume that the person driving the car is going on a road trip to reach a location 500 miles from her starting point. How long will it take the person to get to the destination?
Answer:
500 = 58x
\(\frac{500}{58}\) = x
8.6206… = x
8.6 ≈ x
It will take about 8.6 hours to travel 500 miles.

Question 4.
A particular linear function has the table of values below.
Eureka Math 8th Grade Module 5 Lesson 3 Problem Set Answer Key 4
a. What is the equation that describes the function?
Answer:
y = 3x + 1

b. Complete the table using the rule.
Answer:
Eureka Math 8th Grade Module 5 Lesson 3 Problem Set Answer Key 5

Question 5.
A particular linear function has the table of values below.
Eureka Math 8th Grade Module 5 Lesson 3 Problem Set Answer Key 6
a. What is the rule that describes the function?
Answer:
y = x + 6

b. Complete the table using the rule.
Answer:
Eureka Math 8th Grade Module 5 Lesson 3 Problem Set Answer Key 7

Eureka Math Grade 8 Module 5 Lesson 3 Exit Ticket Answer Key

The information in the table shows the number of pages a student can read in a certain book as a function of time in minutes spent reading. Assume a constant rate of reading.
Eureka Math Grade 8 Module 5 Lesson 3 Exit Ticket Answer Key 1
a. Write the equation that describes the total number of pages read, y, as a linear function of the number of minutes, x, spent reading.
Answer:
y = \(\frac{7}{2}\) x
y = 3.5x

b. How many pages can be read in 45 minutes?
Answer:
y = 3.5(45)
y = 157.5
In 45 minutes, the student can read 157.5 pages.

c. A certain book has 396 pages. The student has already read \(\frac{3}{8}\) of the pages and now picks up the book again at time x = 0 minutes. Write the equation that describes the total number of pages of the book read as a function of the number of minutes of further reading.
Answer:
\(\frac{3}{8}\) (396) = 148.5
y = 3.5x + 148.5

d. Approximately how much time, in minutes, will it take to finish reading the book?
Answer:
396 = 3.5x + 148.5
247.5 = 3.5x
\(\frac{247.5}{3.5}\) = x
70.71428571… = x
71 ≈ x
It will take about 71 minutes to finish reading the book.

Eureka Math Grade 8 Module 5 Lesson 2 Answer Key

Engage NY Eureka Math 8th Grade Module 5 Lesson 2 Answer Key

Eureka Math Grade 8 Module 5 Lesson 2 Example Answer Key

Exercises 1–5

Exercise 1.
Let D be the distance traveled in time t. Use the equation D = 16t2 to calculate the distance the stone dropped for the given time t.
Engage NY Math Grade 8 Module 5 Lesson 2 Exercise Answer Key 1
Answer:
Engage NY Math Grade 8 Module 5 Lesson 2 Exercise Answer Key 2
a. Are the distances you calculated equal to the table from Lesson 1?
Answer:
Yes

b. Does the function D = 16t2 accurately represent the distance the stone fell after a given time t? In other words, does the function described by this rule assign to t the correct distance? Explain.
Answer:
Yes, the function accurately represents the distance the stone fell after the given time interval. Each computation using the function resulted in the correct distance. Therefore, the function assigns to t the correct distance.

Exercise 2.
Can the table shown below represent values of a function? Explain.
Engage NY Math Grade 8 Module 5 Lesson 2 Exercise Answer Key 3.1
Answer:
No, the table cannot represent a function because the input of 5 has two different outputs. Functions assign only one output to each input.

Exercise 3.
Can the table shown below represent values of a function? Explain.
Engage NY Math Grade 8 Module 5 Lesson 2 Exercise Answer Key 3
Answer:
No, the table cannot represent a function because the input of 7 has two different outputs. Functions assign only one output to each input.

Exercise 4.
Can the table shown below represent values of a function? Explain.
Engage NY Math Grade 8 Module 5 Lesson 2 Exercise Answer Key 4
Answer:
Yes, the table can represent a function. Even though there are two outputs that are the same, each input has only one output.

Exercise 5.
It takes Josephine 34 minutes to complete her homework assignment of 10 problems. If we assume that she works at a constant rate, we can describe the situation using a function.
a. Predict how many problems Josephine can complete in 25 minutes.
Answer:
Answers will vary.

b. Write the two-variable linear equation that represents Josephine’s constant rate of work.
Answer:
Let y be the number of problems she can complete in x minutes.
\(\frac{10}{34}\) = \(\frac{y}{x}\)
y = \(\frac{10}{34}\) x
y = \(\frac{5}{17}\) x

c. Use the equation you wrote in part (b) as the formula for the function to complete the table below. Round your answers to the hundredths place.
Engage NY Math Grade 8 Module 5 Lesson 2 Exercise Answer Key 5
After 5 minutes, Josephine was able to complete 1.47 problems, which means that she was able to complete 1 problem, then get about halfway through the next problem.
Answer:
Engage NY Math Grade 8 Module 5 Lesson 2 Exercise Answer Key 6

d. Compare your prediction from part (a) to the number you found in the table above.
Answer:
Answers will vary.

e. Use the formula from part (b) to compute the number of problems completed when x = -7. Does your answer make sense? Explain.
Answer:
y = \(\frac{5}{17}\) (-7)
= -2.06
No, the answer does not make sense in terms of the situation. The answer means that Josephine can complete -2.06 problems in -7 minutes. This obviously does not make sense.

f. For this problem, we assumed that Josephine worked at a constant rate. Do you think that is a reasonable assumption for this situation? Explain.
Answer:
It does not seem reasonable to assume constant rate for this situation. Just because Josephine was able to complete 10 problems in 34 minutes does not necessarily mean she spent the exact same amount of time on each problem. For example, it may have taken her 20 minutes to do 1 problem and then 14 minutes total to finish the remaining 9 problems.

Eureka Math Grade 8 Module 5 Lesson 2 Problem Set Answer Key

Question 1.
The table below represents the number of minutes Francisco spends at the gym each day for a week. Does the data shown below represent values of a function? Explain.
Eureka Math 8th Grade Module 5 Lesson 2 Problem Set Answer Key 1
Answer:
Yes, the table can represent a function because each input has a unique output. For example, on day 1, Francisco was at the gym for 35 minutes.

Question 2.
Can the table shown below represent values of a function? Explain.
Eureka Math 8th Grade Module 5 Lesson 2 Problem Set Answer Key 2
Answer:
No, the table cannot represent a function because the input of 9 has two different outputs, and so does the input of 8. Functions assign only one output to each input.

Question 3.
Olivia examined the table of values shown below and stated that a possible rule to describe this function could be y = -2x + 9. Is she correct? Explain.
Eureka Math 8th Grade Module 5 Lesson 2 Problem Set Answer Key 3
Answer:
Yes, Olivia is correct. When the rule is used with each input, the value of the output is exactly what is shown in the table. Therefore, the rule for this function could well be y = -2x + 9.

Question 4.
Peter said that the set of data in part (a) describes a function, but the set of data in part (b) does not. Do you agree? Explain why or why not.
Eureka Math 8th Grade Module 5 Lesson 2 Problem Set Answer Key 4
Answer:
Peter is correct. The table in part (a) fits the definition of a function. That is, there is exactly one output for each input. The table in part (b) cannot be a function. The input -3 has two outputs, 14 and 2. This contradicts the definition of a function; therefore, it is not a function.

Question 5.
A function can be described by the rule y = x2 + 4. Determine the corresponding output for each given input.
Eureka Math 8th Grade Module 5 Lesson 2 Problem Set Answer Key 6
Answer:
Eureka Math 8th Grade Module 5 Lesson 2 Problem Set Answer Key 7

Question 6.
Examine the data in the table below. The inputs and outputs represent a situation where constant rate can be assumed. Determine the rule that describes the function.
Eureka Math 8th Grade Module 5 Lesson 2 Problem Set Answer Key 8
Answer:
The rule that describes this function is y = 5x + 8.

Question 7.
Examine the data in the table below. The inputs represent the number of bags of candy purchased, and the outputs represent the cost. Determine the cost of one bag of candy, assuming the price per bag is the same no matter how much candy is purchased. Then, complete the table.
Eureka Math 8th Grade Module 5 Lesson 2 Problem Set Answer Key 9
Answer:
Eureka Math 8th Grade Module 5 Lesson 2 Problem Set Answer Key 10
a. Write the rule that describes the function.
Answer:
y = 1.25x

b. Can you determine the value of the output for an input of x = -4? If so, what is it?
Answer:
When x = -4, the output is -5.

c. Does an input of -4 make sense in this situation? Explain.
Answer:
No, an input of -4 does not make sense for the situation. It would mean -4 bags of candy. You cannot purchase -4 bags of candy.

Question 8.
Each and every day a local grocery store sells 2 pounds of bananas for $1.00. Can the cost of 2 pounds of bananas be represented as a function of the day of the week? Explain.
Answer:
Yes, this situation can be represented by a function. Assign to each day of the week the value $1.00.

Question 9.
Write a brief explanation to a classmate who was absent today about why the table in part (a) is a function and the table in part (b) is not.
Eureka Math 8th Grade Module 5 Lesson 2 Problem Set Answer Key 11
Answer:
The table in part (a) is a function because each input has exactly one output. This is different from the information in the table in part (b). Notice that the input of 1 has been assigned two different values. The input of 1 is assigned 2 and 19. Because the input of 1 has more than one output, this table cannot represent a function.

Eureka Math Grade 8 Module 5 Lesson 2 Exit Ticket Answer Key

Question 1.
Can the table shown below represent values of a function? Explain.
Eureka Math Grade 8 Module 5 Lesson 2 Exit Ticket Answer Key 1
Answer:
Yes, the table can represent a function. Each input has exactly one output.

Question 2.
Kelly can tune 4 cars in 3 hours. If we assume he works at a constant rate, we can describe the situation using a function.
a. Write the function that represents Kelly’s constant rate of work.
Answer:
Let y represent the number of cars Kelly can tune up in x hours; then
\(\frac{y}{x}\) = \(\frac{4}{3}\)
y = \(\frac{4}{3}\) x

b. Use the function you wrote in part (a) as the formula for the function to complete the table below. Round your answers to the hundredths place.
Eureka Math Grade 8 Module 5 Lesson 2 Exit Ticket Answer Key 2
Answer:
Eureka Math Grade 8 Module 5 Lesson 2 Exit Ticket Answer Key 3

c. Kelly works 8 hours per day. According to this work, how many cars will he finish tuning at the end of a shift?
Answer:
Using the function, Kelly will tune up 10.67 cars at the end of his shift. That means he will finish tuning up 10 cars and begin tuning up the 11th car.
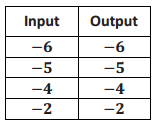
d. For this problem, we assumed that Kelly worked at a constant rate. Do you think that is a reasonable assumption for this situation? Explain.
Answer:
No, it does not seem reasonable to assume a constant rate for this situation. Just because Kelly tuned up 4 cars in 3 hours does not mean he spent the exact same amount of time on each car. One car could have taken 1 hour, while the other three could have taken 2 hours total.
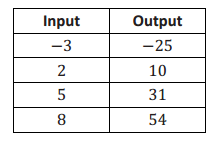
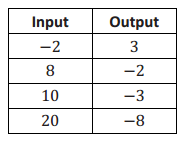
Eureka Math Grade 8 Module 5 Lesson 1 Answer Key

Engage NY Eureka Math 8th Grade Module 5 Lesson 1 Answer Key

Eureka Math Grade 8 Module 5 Lesson 1 Example Answer Key

Example 1.
Suppose a moving object travels 256 feet in 4 seconds. Assume that the object travels at a constant speed, that is, the motion of the object can be described by a linear equation. Write a linear equation in two variables to represent the situation, and use the equation to predict how far the object has moved at the four times shown.
Engage NY Math 8th Grade Module 5 Lesson 1 Example Answer Key 1
Answer:
Engage NY Math 8th Grade Module 5 Lesson 1 Example Answer Key 2
→ Suppose a moving object travels 256 feet in 4 seconds. Assume that the object travels at a constant speed, that is, the motion of the object can be described by a linear equation. Write a linear equation in two variables to represent the situation, and use the equation to predict how far the object has moved at the four times shown.

→ Let x represent the time it takes to travel y feet.
\(\frac{256}{4}\) = \(\frac{y}{x}\)
y = \(\frac{256}{4}\) x
y = 64x

→ What are some of the predictions that this equation allows us to make?
After one second, or when x = 1, the distance traveled is 64 feet.
Accept any reasonable predictions that students make.

→ Use your equation to complete the table.
→ What is the average speed of the moving object from 0 to 3 seconds?
The average speed is 64 feet per second. We know that the object has a constant rate of change; therefore, we expect the average speed to be the same over any time interval.

Example 2.
The object, a stone, is dropped from a height of 256 feet. It takes exactly 4 seconds for the stone to hit the ground. How far does the stone drop in the first 3 seconds? What about the last 3 seconds? Can we assume constant speed in this situation? That is, can this situation be expressed using a linear equation?
Engage NY Math 8th Grade Module 5 Lesson 1 Example Answer Key 3
Answer:
Engage NY Math 8th Grade Module 5 Lesson 1 Example Answer Key 4
Provide students time to discuss this in pairs. Lead a discussion in which students share their thoughts with the class. It is likely they will say the motion of a falling object is linear and that the work conducted in the previous example is appropriate.

→ If this is a linear situation, then we predict that the stone drops 192 feet in the first 3 seconds.
Now consider viewing the 10-second “ball drop” video at the following link: http://www.youtube.com/watch?v = KrX_zLuwOvc. Consider showing it more than once.
→ If we were to slow the video down and record the distance the ball dropped after each second, here is the data we would obtain:
Engage NY Math 8th Grade Module 5 Lesson 1 Example Answer Key 5
Have students record the data in the table of Example 2.
→ Was the linear equation developed in Example 1 appropriate after all?
Students who thought the stone was traveling at constant speed should realize that the predictions were not accurate for this situation. Guide their thinking using the discussion points below.

→ According to the data, how many feet did the stone drop in 3 seconds?
The stone dropped 144 feet.

→ How can that be? It must be that our initial assumption of constant rate was incorrect.
What predictions can we make now?
After one second, x = 1; the stone dropped 16 feet, etc.
→ Let’s make a prediction based on a value of x that is not listed in the table. How far did the stone drop in the first 3.5 seconds? What have we done in the past to figure something like this out?

Eureka Math Grade 8 Module 5 Lesson 1 Exercise Answer Key

Exercises 1–6
Use the table to answer Exercises 1–5.
Engage NY Math Grade 8 Module 5 Lesson 1 Exercise Answer Key 1
Exercise 1.
Name two predictions you can make from this table.
Answer:
Sample student responses:
After 2 seconds, the object traveled 64 feet. After 3.5 seconds, the object traveled 196 feet.

Exercise 2.
Name a prediction that would require more information.
Answer:
Sample student response:
We would need more information to predict the distance traveled after 3.75 seconds.

Exercise 3.
What is the average speed of the object between 0 and 3 seconds? How does this compare to the average speed calculated over the same interval in Example 1?
\(\text { Average Speed } = \frac{\text { distance traveled over a given time interval }}{\text { time interval }}\)
Answer:
The average speed is 48 feet per second: \(\frac{144}{3}\) = 48. This is different from the average speed calculated in Example 1. In Example 1, the average speed over an interval of 3 seconds was 64 feet per second.

Exercise 4.
Take a closer look at the data for the falling stone by answering the questions below.
a. How many feet did the stone drop between 0 and 1 second?
Answer:
The stone dropped 16 feet between 0 and 1 second.

b. How many feet did the stone drop between 1 and 2 seconds?
Answer:
The stone dropped 48 feet between 1 and 2 seconds.

c. How many feet did the stone drop between 2 and 3 seconds?
Answer:
The stone dropped 80 feet between 2 and 3 seconds.

d. How many feet did the stone drop between 3 and 4 seconds?
Answer:
The stone dropped 112 feet between 3 and 4 seconds.

e. Compare the distances the stone dropped from one time interval to the next. What do you notice?
Answer:
Over each interval, the difference in the distance was 32 feet. For example, 16+32 = 48, 48+32 = 80, and 80+32 = 112.

Exercise 5.
What is the average speed of the stone in each interval 0.5 second? For example, the average speed over the interval from 3.5 seconds to 4 seconds is
\(\frac{\text { distance traveled over a given time interval }}{\text { time interval }}\) = \(\frac{256-196}{4-3.5}\) = \(\frac{60}{0.5}\) = 120;120 feet per second
Repeat this process for every half-second interval. Then, answer the question that follows.
a. Interval between 0 and 0.5 second:
Answer:
\(\frac{4}{0.5}\) = 8;8 feet per second

b. Interval between 0.5 and 1 second:
Answer:
\(\frac{12}{0.5}\) = 24;24 feet per second

c. Interval between 1 and 1.5 seconds:
Answer:
\(\frac{20}{0.5}\) = 40;40 feet per second

d. Interval between 1.5 and 2 seconds:
Answer:
\(\frac{28}{0.5}\) = 56;56 feet per second

e. Interval between 2 and 2.5 seconds:
Answer:
\(\frac{36}{0.5}\) = 72;72 feet per second

f. Interval between 2.5 and 3 seconds:
Answer:
\(\frac{44}{0.5}\) = 88;88 feet per second

g. Interval between 3 and 3.5 seconds:
Answer:
\(\frac{52}{0.5}\) = 104;104 feet per second

h. Compare the average speed between each time interval. What do you notice?
Answer:
Over each interval, there is an increase in the average speed of 16 feet per second. For example, 8 + 16 = 24, 24 + 16 = 40, 40 + 16 = 56, and so on.

Exercise 6.
Is there any pattern to the data of the falling stone? Record your thoughts below.
Engage NY Math Grade 8 Module 5 Lesson 1 Exercise Answer Key 2
Answer:
Accept any reasonable patterns that students notice as long as they can justify their claim. In the next lesson, students learn that y = 16t2.
Each distance has 16 as a factor. For example, 16 = 1(16), 64 = 4(16), 144 = 9(16), and 256 = 16(16).

Eureka Math Grade 8 Module 5 Lesson 1 Problem Set Answer Key

A ball is thrown across the field from point A to point B. It hits the ground at point B. The path of the ball is shown in the diagram below. The x-axis shows the horizontal distance the ball travels in feet, and the y-axis shows the height of the ball in feet. Use the diagram to complete parts (a)–(g).
Eureka Math 8th Grade Module 5 Lesson 1 Problem Set Answer Key 1
Answer:
Eureka Math 8th Grade Module 5 Lesson 1 Problem Set Answer Key 2
a. Suppose point A is approximately 6 feet above ground and that at time t = 0 the ball is at point A. Suppose the length of OB is approximately 88 feet. Include this information on the diagram.
Answer:
Information is noted on the diagram in red.

b. Suppose that after 1 second, the ball is at its highest point of 22 feet (above point C) and has traveled a horizontal distance of 44 feet. What are the approximate coordinates of the ball at the following values of t: 0.25, 0.5, 0.75, 1, 1.25, 1.5, 1.75, and 2.
Answer:
Most answers will vary because students are approximating the coordinates. The coordinates that must be correct because enough information was provided are denoted by a *.
At t = 0.25, the coordinates are approximately (11, 10).
At t = 0.5, the coordinates are approximately (22, 18).
At t = 0.75, the coordinates are approximately (33, 20).
*At t = 1, the coordinates are approximately (44, 22).
At t = 1.25, the coordinates are approximately (55, 19).
At t = 1.5, the coordinates are approximately (66, 14).
At t = 1.75, the coordinates are approximately (77, 8).
*At t = 2, the coordinates are approximately (88, 0).

c. Use your answer from part (b) to write two predictions.
Answer:
Sample predictions:
At a distance of 44 feet from where the ball was thrown, it is 22 feet in the air. At a distance of 66 feet from where the ball was thrown, it is 14 feet in the air.

d. What is happening to the ball when it has coordinates (88,0)?
Answer:
At point (88,0), the ball has traveled for 2 seconds and has hit the ground at a distance of 88 feet from where the ball began.

e. Why do you think the ball is at point (0, 6) when t = 0? In other words, why isn’t the height of the ball 0?
Answer:
The ball is thrown from point A to point B. The fact that the ball is at a height of 6 feet means that the person throwing it must have released the ball from a height of 6 feet.

f. Does the graph allow us to make predictions about the height of the ball at all points?
Answer:
While we cannot predict exactly, the graph allows us to make approximate predictions of the height for any value of horizontal distance we choose.

Eureka Math Grade 8 Module 5 Lesson 1 Exit Ticket Answer Key

Question 1.
A ball is bouncing across the school yard. It hits the ground at (0,0) and bounces up and lands at (1,0) and bounces again. The graph shows only one bounce.
Eureka Math Grade 8 Module 5 Lesson 1 Exit Ticket Answer Key 1
a. Identify the height of the ball at the following values of t: 0, 0.25, 0.5, 0.75, 1.
Answer:
When t = 0, the height of the ball is 0 feet above the ground. It has just hit the ground.
When t = 0.25, the height of the ball is 3 feet above the ground.
When t = 0.5, the height of the ball is 4 feet above the ground.
When t = 0.75, the height of the ball is 3 feet above the ground.
When t = 1, the height of the ball is 0 feet above the ground. It has hit the ground again.

b. What is the average speed of the ball over the first 0.25 seconds? What is the average speed of the ball over the next 0.25 seconds (from 0.25 to 0.5 seconds)?
Answer:
\(\frac{\text { distance traveled over a given time interval }}{\text { time interval }}\) = \(\frac{3-0}{0.25-0}\) = \(\frac{3}{0.25}\) = 12;12 feet per second
\(\frac{\text { distance traveled over a given time interval }}{\text { time interval }}\) = \(\frac{4-3}{0.5-0.25}\) = \(\frac{1}{0.25}\) = 4;4 feet per second

c. Is the height of the ball changing at a constant rate?
Answer:
No, it is not. If the ball were traveling at a constant rate, the average speed would be the same over any time interval.

Eureka Math Grade 7 Module 3 Mid Module Assessment Answer Key

Engage NY Eureka Math 7th Grade Module 3 Mid Module Assessment Answer Key

Eureka Math Grade 7 Module 3 Mid Module Assessment Task Answer Key

Question 1.
Use the expression below to answer parts (a) and (b).
4x-3(x-2y)+\(\frac{1}{2}\)(6x-8y)
a. Write an equivalent expression in standard form, and collect like terms.
Answer:
4x – 3(x – 2y) + \(\frac{1}{2}\)(6x – 8y)
4x – 3x + 6y + 3x – 4y
4x – 3x + 3x + 6y – 4y
4x + 2y

b. Express the answer from part (a) as an equivalent expression in factored form.
Answer:
4x + 2y
2(2x + y)

Question 2.
Use the information to solve the problems below.
a. The longest side of a triangle is six more units than the shortest side. The third side is twice the length of the shortest side. If the perimeter of the triangle is 25 units, write and solve an equation to find the lengths of all three sides of the triangle.
Answer:
Engage NY Math 7th Grade Module 3 Mid Module Assessment Answer Key 2
2x + x + x + 6 = 25
4x + 6 = 25
4x + 6 – 6 = 25 – 6
4x + 0 = 19
\(\frac{1}{4}\)(4x) = \(\frac{1}{4}\)(9)
x = \(\frac{19}{4}\)
x = 4\(\frac{3}{4}\)

Smallest side: x = 4\(\frac{3}{4}\)
Largest side: x + 6 = 10\(\frac{3}{4}\)
Third side: 2x = 9\(\frac{1}{2}\)
3 sides are: 4\(\frac{3}{4}\) units, 10\(\frac{3}{4}\) units, 9\(\frac{1}{2}\) units

b. The length of a rectangle is (x+3) inches long, and the width is 3 \(\frac{2}{5}\) inches. If the area is 15 \(\frac{3}{10}\) square inches, write and solve an equation to find the length of the rectangle.
Answer:
Engage NY Math 7th Grade Module 3 Mid Module Assessment Answer Key 3
Length: x + 3: = 1\(\frac{1}{2}\) + 3 = 4\(\frac{1}{2}\) inches
Width: 3\(\frac{2}{5}\) inches
3\(\frac{2}{5}\)(x + 3) = 15\(\frac{3}{10}\)
3\(\frac{2}{5}\)x + 3(3\(\frac{2}{5}\)) = 15\(\frac{3}{10}\)
\(\frac{17}{5}\)x + 3(\(\frac{17}{5}\)) = 15\(\frac{3}{10}\)
\(\frac{17}{5}\)x + \(\frac{51}{5}\) = 15\(\frac{3}{10}\)
\(\frac{17}{5}\)x + 10\(\frac{1}{5}\) = 15\(\frac{3}{10}\)
\(\frac{17}{5}\)x + 10\(\frac{1}{5}\) – 10\(\frac{1}{5}\) = 15\(\frac{3}{10}\) – 10\(\frac{1}{5}\)
(\(\frac{17}{5}\)x) + 0 = 5\(\frac{1}{10}\)
\(\frac{5}{17}\)(\(\frac{17}{5}\)x) = (\(\frac{51}{10}\))(\(\frac{5}{17}\))
x = \(\frac{3}{2}\)
x = 1\(\frac{1}{2}\)

Question 3.
A picture 10 \(\frac{1}{4}\) feet long is to be centered on a wall that is 14 \(\frac{1}{2}\) feet long. How much space is there from the edge of the wall to the picture?
a. Solve the problem arithmetically.
Answer:
Engage NY Math 7th Grade Module 3 Mid Module Assessment Answer Key 4
(14\(\frac{1}{2}\) – 10\(\frac{1}{4}\)) ÷ 2
(14\(\frac{2}{4}\) – 10\(\frac{1}{4}\)) ÷ 2
4\(\frac{1}{4}\) ÷ 2
\(\frac{17}{4}\) ÷ 2
\(\frac{17}{4}\) ∙ \(\frac{1}{2}\)
\(\frac{17}{8}\)
2\(\frac{1}{8}\)
The picture is 2\(\frac{1}{8}\) inches from the wall.

b. Solve the problem algebraically.
Answer:
Engage NY Math 7th Grade Module 3 Mid Module Assessment Answer Key 5
Let x: distance from one side to the picture
x + 10\(\frac{1}{4}\) + x = 14\(\frac{1}{2}\)
2x + 10\(\frac{1}{4}\) = 14\(\frac{1}{2}\)
2x + 10\(\frac{1}{4}\) – 10\(\frac{1}{4}\) = 14\(\frac{1}{2}\) – 10\(\frac{1}{4}\)
2x + 0 = 4\(\frac{1}{4}\)
(\(\frac{1}{2}\)) (2x) = (4\(\frac{1}{4}\))(\(\frac{1}{2}\))
x = (\(\frac{17}{4}\)) (\(\frac{1}{2}\))
x = \(\frac{17}{8}\) = 2\(\frac{1}{8}\)
The picture is 2\(\frac{1}{8}\) inches from the wall.

c. Compare the approaches used in parts (a) and (b). Explain how they are similar.
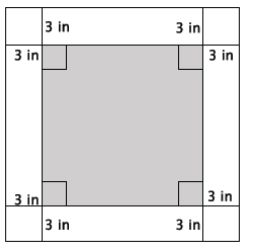
Answer:
The solutions are the same. The actual operations performed in the equation are the same operations done arithmetically.
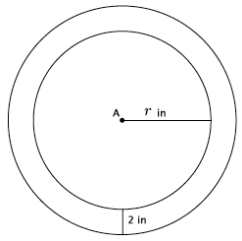
Question 4.
In August, Cory begins school shopping for his triplet daughters.
a. One day, he bought 10 pairs of socks for $2.50 each and 3 pairs of shoes for d dollars each. He spent a total of $135.97. Write and solve an equation to find the cost of one pair of shoes.
Answer:
d: cost of shoes
10(2.50) + 3d = 135.97
25 + 3d = 135.97
3d + 25 = 135.97
3d+ 25 – 25 = 135.97 – 25
3d + 0 = 110.97
(\(\frac{1}{3}\))(3d)= (110.97)(\(\frac{1}{3}\))
d = 36.99
The cost of one pair of shoes is 36.99

b. The following day Cory returned to the store to purchase some more socks. He had $40 to spend. When he arrived at the store, the shoes were on sale for \(\frac{1}{3}\) off. What is the greatest amount of pairs of socks Cory can purchase if he purchases another pair of shoes in addition to the socks?
Answer:
Shoes: \(\frac{1}{3}\)(36.99)
12.33 off
New price
36.99 – 12.33 = 24.66
Socks: d
2.50d + 24.66 ≤ 40
2.50d + 24.66 – 24.66 ≤ 40 – 24.66
2.50d + 0 ≤ 15.34
(\(\frac{1}{2.50}\))(2.50d) ≤ (15.34)(\(\frac{1}{2.50}\))
d ≤ 6.136
The greatest amount of socks he can buy is 6 pairs.

Question 5.
Ben wants to have his birthday at the bowling alley with a few of his friends, but he can spend no more than $80. The bowling alley charges a flat fee of $45 for a private party and $5.50 per person for shoe rentals and unlimited bowling.
a. Write an inequality that represents the total cost of Ben’s birthday for p people given his budget.
Answer:
45 + 5.50p ≤ 80

b. How many people can Ben pay for (including himself) while staying within the limitations of his budget?
Answer:
P: number of people invited
45 + 5.50p ≤ 80
5.50p + 45 ≤ 80
5.50p + 45 – 45 ≤ 80 – 45
(\(\frac{1}{5.50}\))(5.50p) ≤ (35)(\(\frac{1}{5.50}\))
P ≤ \(\frac{350}{55}\)
P ≤ \(\frac{70}{11}\)
P ≤ 6\(\frac{4}{11}\)
6 people can attend the party
P ≤ 6

c. Graph the solution of the inequality from part (a).
Answer:
Engage NY Math 7th Grade Module 3 Mid Module Assessment Answer Key 6

6. Jenny invited Gianna to go watch a movie with her family. The movie theater charges one rate for 3D admission and a different rate for regular admission. Jenny and Gianna decided to watch the newest movie in 3D. Jenny’s mother, father, and grandfather accompanied Jenny’s little brother to the regular admission movie.
a. Write an expression for the total cost of the tickets. Define the variables.
Answer:
d: cost in dollars of 3D admission
r: cost in dollars of regular admission
Jenny Gianna Mother Father Grandfather Brother
d + d + r + r + r + r
2d + 4r

b. The cost of the 3D ticket was double the cost of the regular admission ticket. Write an equation to represent the relationship between the two types of tickets.
Answer:
d = 2r

c. The family purchased refreshments and spent a total of $18.50. If the total amount of money spent on tickets and refreshments was $94.50, use an equation to find the cost of one regular admission ticket.
Answer:
2d + 4r + 18.50 = 94.50
2(2r) + 4r + 18.50 = 94.50
4r + 4r + 18.50 = 94.50
8r + 18.50 = 94.50
8r + 18.50 – 18.50 = 94.50 – 18.50
8r + 0 = 76
(\(\frac{1}{8}\))(8r) = (76)(\(\frac{1}{8}\))
r = 9.5
The cost of one regular admission ticket is $9.50

Question 7.
The three lines shown in the diagram below intersect at the same point. The measures of some of the angles in degrees are given as 3(x – 2)°, \(\frac{3}{5}\) y)°, 12°, 42°.
Engage NY Math 7th Grade Module 3 Mid Module Assessment Answer Key 1
a. Write and solve an equation that can be used to find the value of x.
Answer:
3(x – 2) = 42
3x – 6 = 42
3x – 6 + 6 = 42 + 6
3x + 0 = 48
(\(\frac{1}{3}\))(3x) = (48)(\(\frac{1}{3}\))
x = 16
OR
\(\frac{1}{3}\)(3(x – 2)) = (42)(\(\frac{1}{3}\))
x – 2 = 14
x – 2 + 2 = 14 + 2
x + 0 = 16
x = 16

b. Write and solve an equation that can be used to find the value of y.
Answer:
\(\frac{3}{5}\) y + 12 + 42 = 180
\(\frac{3}{5}\) y + 54 = 180
\(\frac{3}{5}\) y + 54 – 54 = 180 – 54
\(\frac{3}{5}\) y + 0 = 126
(\(\frac{5}{3}\))(\(\frac{3}{5}\) y) = (126)(\(\frac{5}{3}\))
y = (42)(5)
y = 210