Addition of Integers – Definition, Rules, Examples | How to Add Integers?

Addition of Integers

Are you facing any trouble in understanding the concept of Adding Integers? If so, don’t worry as we have covered everything on how we can add two integers. Go through the entire article to be well versed with details like Adding Integers Definition, Rules, Steps for Integers Addition. Furthermore, you can have an insight on the Addition of Integers Examples with Answers for a better understanding of the concept.

Also Read:

What is an Integer?

An integer is a whole number (can have a positive or a negative sign) that completes itself. An integer can never be a fraction number.

Integers Addition Methods

There are various methods to find the addition of integers such as the Concrete Method, Number Line Method, Absolute Value Method. We have explained how to add integers using the Absolute Value Method in detail.

Absolute Value: Absolute value is the magnitude of a real number or a whole number irrespective of its sign or its relation with other values.

Addition of Integers Possibilities

In general, there are three possibilities while adding integers. They are as follows

  • The addition between two positive numbers
  • The addition between two negative numbers
  • The addition between a positive number and a negative number

Rules for Adding Integers

Now that we know what absolute value is, let’s see how we can use this method to add integers. Here in this method, we have to keep two rules in our mind as mentioned below.

Rule 1: If the sign of both the integers is the same you have to add the absolute value and take the same sign for the result.

Rule 2: If the sign of both the integers is different you have to subtract the absolute value of the integers and take the sign of the integer having of larger absolute value as the result.

Addition of Integers Examples with Answers

Example 1: 

Add two positive integers (4) and (5)

Solution:

(4) + (5) = 9

Here in the above example, we took 2 integers having positive sign so we can just simply add both integers and the result will also be positive

Example 2: 

Add two negative integers (-4) & (-5)

Solution:

(-4) + (-5) = -9

Here in the above examples, we took 2 integers negative same sign so we can just simply add both integers and the result will also be negative.

Example 3: 

Add Integers (4) + (-7)?

Solution:

(4) + (-7) = -3

Here both integers are having different signs so we have to subtract the absolute value of the numbers. So here the absolute value of (4) is (4) and (-7) is (7). Now we have to subtract 7 from 4 which is 3.

According to our rule, the number with the largest absolute value is going to determine the sign of the result. So here (-7) is having the largest absolute value so the result is going to be negative.

Example 4: 

Add integers be (-4) + (7)?

Solution:

(-4) + (7) = 3

Here both integers are having different signs so we have to subtract the absolute value of the numbers. So here the absolute value of (-4) is (4) and (7) is (7). Now we have to subtract 7 from 4 which is 3.

According to our rule, the number with the largest absolute value is going to determine the sign of the result. So here (7) is having the largest absolute value so the result is going to be positive.

FAQs on Addition of Integers

1. When two positive integers are added together, then what is the sign of resulted value?

When two positive integers are added together, is the sum of two integers with a positive sign.

2. What are the rules for Adding Integers?

Rules for Addition of Integers is as follows

  • When two integers with positive signs are added the result will also have a positive sign.
  • When two integers with one positive and negative sign are added resultant sign is the value of integer having the largest value.
  • When two integers with negative signs are added the result will also have a negative sign.

3. What is th result when integers 6 and -3 are added?

When integers 6 and -3 are added the sum is 6+(-3) i.e. 3
Non-Terminating Decimal – Definition, Examples | How to Identify if it is a Non Terminating Decimal?

Non Terminating Decimal

A decimal is a number whose decimal part and fractional part are separated using a decimal point. In this article, we have presented all about Non-Terminating Decimals such as Definition How to Identify a Non-Terminating or Recurring Decimal all in one place. Refer to Solved Examples on Non-Terminating Decimals so that you will better understand the concept.

Also, Check:

Non-Terminating Decimal – Definition

While converting a fraction to decimal we usually perform division operation and obtain a certain remainder. If the division procedure doesn’t end and we get a remainder other than zero, then such decimal is called a non-terminating decimal.

Example: 2.666 is a non-terminating repeating decimal and can be written as 2.\( \overline6\)

How to Determine if it is a Non-Terminating Decimal?

Follow the simple guidelines listed below to determine whether a given decimal number a non-terminating decimal or not. They are along the lines

  • Whenever we perform a division we get a certain block of digits that do repeat in the decimal part.
  • Such Decimals are the ones that don’t end and continue and are called as Non-Terminating Decimal or Recurring Decimal.
  • You can represent these decimals by placing a bar on the repeated part.

Examples of Non-Terminating Decimals or Recurring Decimals

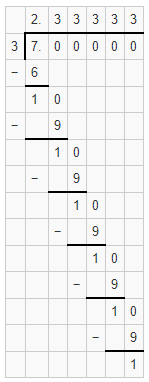
1. Express 7/3 in decimal form and determine whether it is a non-terminating decimal or not?

Solution:

Perform division operation and check if the decimal quotient has finite numbers or infinite numbers. If the digits after the decimal part don’t end and continue then they are called Non-Terminating or Recurring Decimals.

Recurring Decimal Example

Since 7/3 has an infinite number of digits after the decimal point i.e. 2.3333333…. thus it is a non-terminating decimal.

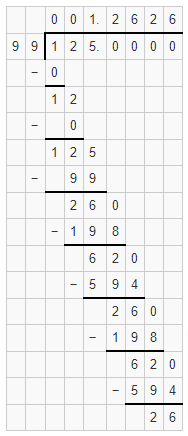
2. Express 125/99 in decimal form and determine whether it is a non-terminating decimal or not?

Solution:

Perform division operation and check if the decimal quotient has finite numbers or infinite numbers. If the digits after the decimal part don’t end and continue then they are called Non-Terminating or Recurring Decimals.

Non Terminating Decimal Sample

Since 125/99 has an infinite number of digits after the decimal point i.e. 1.2626…… thus it is non-terminating.

FAQs on Non-Terminating Decimals

1. What is a Non-Terminating Decimal?

A Non-Terminating Decimal is a decimal number that continues endlessly.

2. How do you know if a decimal is Non-Terminating?

After performing division if you get a certain block of digits that repeat in the decimal part then the decimal part is called a Non-Terminating Decimal.

3. Is 0.544444….. a non-terminating decimal?

Yes, 0.54444…. is a non-terminating decimal as it has an infinite number of terms.

Problems on Frequency Polygon | Frequency Polygon Questions with Answers

Problems on Frequency Polygon

Problems on frequency polygon are here. Check the practice material and solution of frequency polygons. Get the various steps to solve these problems in an easy manner. Follow the step-by-step procedure to solve frequency polygon problems. Know the various polygon concepts and examples. Check the below sections to know the polygon concepts, step-by-step procedure, example problems, etc.

Also, Read:

Polygon – Definition

Any closed 2-D shaped figure bounded by three or more sides is a polygon. If all the sides of the polygon are equal, then it is called the regular polygon. Before going to solve frequency polygon problems, check the formulae here.

Properties of Polygon

  1. Sum of all the interior angles of a regular polygon: (n-2)180°
  2. Each interior angle of a regular polygon: (n-2)180°/n
  3. Number of Diagonals: n(n-3)/2
  4. Sum of all exterior angles of a regular polygon: 360°

Problem 1:

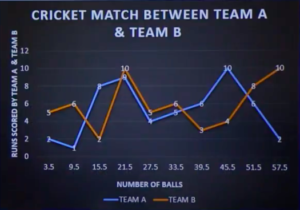
The runs scored by two teams A and B on the first 60 balls in a cricket match are given below.

S. NoNumber of BallsTeam ATeam B
11-625
27-1216
313-1882
419-24910
525-3045
631-3656
737-4263
843-48104
949-5468
1055-60210

Represent the data of both the teams on the same graphs by frequency polygons. [Hint: First make the class intervals continuous]

Solution:

As given in the question,

To make the class intervals continuous, subtract 0.5 from the lowest value and add 0.5 to the highest value

Therefore, the new intervals are

S. NoNumber of BallsTeam ATeam B
10.5-6.525
26.5-12.516
312.5-18.582
419-24.5910
524.5-30.545
630.5-36.556
736.5-42.563
842.5-48.5104
948.5-54.568
1054.5-60.5210

To represent the data on the graph, we require the mean value of the interval i.e.,

1st interval mean value is 0.5 + 6.5 / 2 = 3.5

2nd interval mean value is  6.5+12.5 / 2 = 9.5

3rd interval mean value is  12.5+18.5 / 2 = 15.5

4th interval mean value is 19+24.5 / 2 = 21.75

5th interval mean value is 24.5+30.5 / 2 = 27.5

6th interval mean value is  30.5+36.5 / 2 = 33.5

7th interval mean value is 36.5+42.5 / 2 = 39.5

8th interval mean value is 42.5+48.5 / 2 = 45.5

9th interval mean value is 48.5+54.5 / 2 = 51.5

10th interval mean value is 54.5+60.5 / 2 = 57.5

The final graph is

Hence, the frequency polygons graph data is represented here.

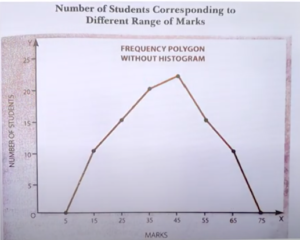
Problem 2:

Represent the data on the same graphs by frequency polygons.

Class Interval (price of pen)10-2020-3030-4040-5050-60
Frequency (Number of pens sold)152030255

Solution:

As given in the above table,

The frequency has gradually increased and then decreased. Hence the graph is as follows.

Hence, the frequency polygons graph data is represented here.

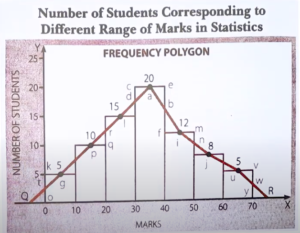
Problem 3:

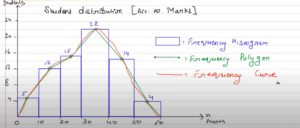
Draw a histogram, a frequency polygon and frequency curve of the following data:

Marks0-1010-2020-3030-4040-5050-60
Number of Students5121522144

 Solution:

By considering the above-given data

Hence, the histogram, frequency polygons graph, and curve are represented here.

Problem 4:

Each interior angle of a regular polygon is three times its exterior angle, then the number of sides of the regular polygon is?

Solution:

As given in the question,

Each interior angle of a regular polygon is three times its exterior angle

Suppose the exterior angle = 1

Then the interior angle = 3

The sum of interior and exterior angle = 4

Each side of a regular polygon = 180°

Therefore, the angle of one side = 180/4 = 45°

The complete angle of a polygon = 360°

No of sides of a polygon = 360º/N

= 360/45

= 8

Therefore, the regular polygon has 8 sides

Problem 5:

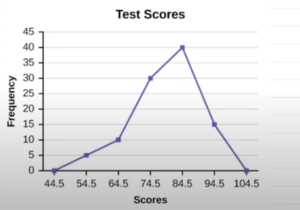
With the help of the frequency distribution for the calculus table, draw the frequency polygon graph?

Lower BoundUpper BoundFrequencyCumulative Frequency
49.559.555
59.569.51015
69.579.53045
79.589.54085
89.599.515100

 Solution:

As given in the question,

We consider the scores and test scores of frequency distribution for the calculus

The frequency polygon distribution graph is

Hence, the frequency polygons graph data is represented here.

Problem 6:

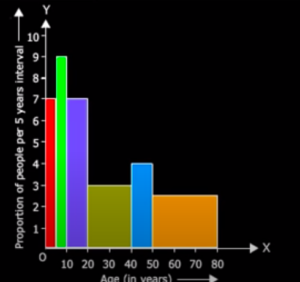
With the help of the frequency distribution, draw the frequency polygon graph?

Age (in years)0-55-1010-2020-4040-5050-80
Number of Persons791412815

 Solution:

As we know,

Adjusted frequency of a class = Minimum class size / Class size * Frequency

The frequency polygon distribution graph is as follows

Hence, the frequency polygons graph data is represented here.

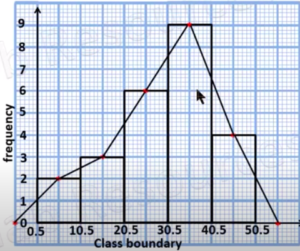
Problem 7:

With the help of the frequency distribution, draw the frequency polygon graph?

CBFrequency
0.5 – 10.52
10.5 – 20.53
20.5 – 30.56
30.5 – 40.59
40.5 – 50.54

 Solution:

As we know,

The frequency polygon distribution graph is as follows

Hence, the frequency polygons graph data is represented here.

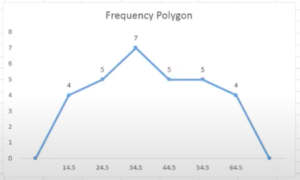
Problem 8:

With the help of the frequency distribution, draw the frequency polygon graph?

Upper BoundLower BoundMidpointFrequency
101914.54
202924.55
303934.57
404944.55
505954.55
606964.54

 Solution:

As we know,

The frequency polygon distribution graph is as follows

Hence, the frequency polygons graph data is represented here.

Problem 9:

The following is the distribution of workers of a factory. On the basis of this information, construct a histogram and convert it into a frequency polygon.

Age (In Years)20-3030-4040-5050-6060-70
No of workers1525752

Solution:

As we know,

The frequency polygon distribution graph is as follows

Hence, the frequency polygons graph data is represented here.

Problem 10:

The following is the distribution of workers of a factory. On the basis of this information, construct a histogram and convert it into a frequency polygon.

MarksMid ValueNumber of Students
10-201510
20-302515
30-403520
40-504522
50-605515
60-706510

Solution:

As we know,

The frequency polygon distribution graph is as follows

Hence, the frequency polygons graph data is represented here.

What is a Proportion – Definition, Types, Properties, Formula, Examples | How to find Proportion?

Proportions

Proportion in Maths is an equation used to find that the two given ratios are equivalent to each other. Generally, we say that proportion defines that the equality of the two fractions of the ratios. If two sets of given numbers are increasing or decreasing in the same ratio with respect to each other, then the ratios are said to be directly proportional to each other. For example, the time taken by car to cover 200km per hour is equal to the time taken by it to cover the distance of 1200km for 6 hours. Such as 200km/hr = 1200km/6hrs.

Also, See:

Proportion – Formula

Let us take, in proportion, the two ratios are x:y and m:n. The two terms m and n are called means or mean terms and x and y are called extremes or extreme terms.

x : y :: m: n
\(\frac { x }{ y } \) = \(\frac { m }{ n } \)

Example:
Let us consider the number of persons in a theater. Our first ratio of the number of girls to boys is 5:7 and that of the other is 3:5, then the proportion can be written as:
5 : 7 :: 3 : 5 or 5/7 = 3/5
Here, 5 & 5 are the extremes, while 7 & 3 are the means.
Note: The ratio value does not affect when the same non-zero number is multiplied or divided on each term.

Important Properties of Proportion

The below are the important properties of proportions.

  • Addendo – If a : b = c : d, then a + c : b + d
  • Subtrahendo – If a : b = c : d, then a – c : b – d
  • Componendo – If a : b = c : d, then a + b : b = c+d : d
  • Dividendo – If a : b = c : d, then a – b : b = c – d : d
  • Invertendo – If a : b = c : d, then b : a = d : c
  • Alternendo – If a : b = c : d, then a : c = b: d
  • Componendo and dividendo – If a : b = c : d, then a + b : a – b = c + d : c – d

Types of Proportions

The Proportions are classified into two types. They are

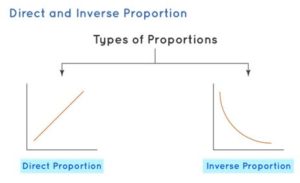
  • Direct Proportion
  • Inverse Proportion

Direct Proportion: The Direct Proportion describes the direct relationship between two quantities. If one of the quantities increases, the other quantity increases and if one of the quantities decreases, the other quantity also decreases.
Example: If the speed of a vehicle increased, then it covers more distance in a fixed amount of time. It is denoted as y ∝ x.

Inverse Proportion: The Inverse Proportion describes the indirect relationship between two quantities. If one quantity increases, the other quantity decreases, and If one quantity decreases the other quantity increases. It is denoted as y ∝ 1/x.
Example: If a vehicle speed increases, then the result in converting a fixed distance in less time.

Types of Proportions

Important Points on Proportion

Check out the important points that need to remember in the proportion concept.

  • Proportion is the comparison between two quantities.
  • The proportions are two types. One is direct proportions and inverse proportions.
  • Formula of proportion is \(\frac { x }{ y } \) = \(\frac { m }{ n } \)
  • The proportion is an equation.

How to Solve Proportions?

Finding proportion is easy if the ratios are given. Follow the below procedure and find out the process to calculate proportions.
1. Multiply the first term with the last term: x x n
2. Multiply the second term with the third term: y x m
3. If the product of extreme terms is equal to the product of mean terms, then the ratios are proportional: x x n = y x m.

Continued Proportions

If we considered three quantities and the ratio of the first and second quantities is equal to the ratio between the second and the third quantities, then the three quantities are in Continued Proportions.

Example:
Let us take the ratios a:b and c:d
If a: b :: b: c, then we can say that a, b, c quantities are in continued proportion. Also, c is the third proportional of a and b.
b is called the mean proportional between a and C.
If a, b, c are in continued proportion then b² = ac or b = √ac.

Proportion Examples with Answers

Example 1.

Determine if 4, 7, 8, 14 are in proportion?

Solution:
Given numbers are 4, 7, 8, 14.
From the given data, extreme terms are 4 and 13, mean terms are 7 and 6.
Find the Product of extreme terms and mean terms.
Product of extreme terms = 4 × 14 = 56
Product of mean terms = 7 × 8 = 56.
Compare the Product of extreme terms and the Product of mean terms.
The product of means = product of extremes
56 = 56

Therefore, 4, 7, 8, 14 are in proportion.

Example 2.

Check if 3, 6, 12 are in proportion.

Solution:
Given numbers are 3, 6, 12.
From the given data, 3 is the first term, 6 is the middle term, and 12 is the third term.
Find the Product of the first term and third term.
Product of first and third term = 3 × 12 = 36
Square of the middle terms = 6 × 6 = 36 = 3 × 12.
Compare the Product of the first and third term and Square of the middle terms.
The Product of first and third term = Square of the middle terms
56 = 56

Therefore, 3, 6, 12 are in proportion, and 6 is called the mean proportional between 3 and 12.

Example 3.

Find the fourth proportional to 3, 19, 21?

Solution:
Given numbers are 3, 19, 21.
To find the fourth Proportional, let us assume the fourth proportional is x.
Then, 3: 19 :: 21: x
Compare the Product of extreme terms and Product of mean terms.
3x = 19 × 21
3x = 399
x = 399/3
x = 133.

Hence, the fourth proportional to 3, 19, 21 is 133.

Example 4.

Find the third proportional to 4 and 8?

Solution:
Given numbers are 4 and 8.
Let the third proportional to 4 and 8 be x.
Compare the Product of the first and third term and Square of the middle terms.
4x = 8 × 8
4x = 64
x = 64/4
x = 16

Therefore, the third proportional to 4 and 8 is 16.

Example 5.

The ratio of income to expenditure is 3: 4. Find the savings if the expenditure is $24,000.

Solution:
Given that the ratio of income to expenditure is 3: 4.
Therefore, income = $ (3 × 24000)/4 = $18000
Savings = Income – Expenditure = $24,000 – $18000 = $6000

The savings are $6000 if the expenditure is $24,000.

Example 6.

Find the mean proportional between 3 and 27?

Solution:
Given numbers are 3 and 27.
Let the mean proportional between 3 and 27 be x.
Then, x × x = 3 × 27
x² = 81
x = √81
x = 9.

Therefore, the mean proportion between 3 and 27 is 9.

Ordered Pair – Definition, Facts, Examples | Equality of Ordered Pairs | How to find Ordered Pairs?

Ordered Pair

Sets are a collection of well-defined objects. In general, we can represent a set in three forms they are statement or description form, roster form, and set builder. The other easy way to represent a set in some situations is an ordered pair. As we already learned that an ordered pair in the coordinate plane has two coordinates namely x-coordinate and y-coordinate. In the same way, ordered pair in the set theory also has two elements. Check the following sections to know more about an ordered pair definition and solved questions.

Also, Read:

What is an Ordered Pair in Math?

The pair of elements that occur in a particular order, separated by a comma and are enclosed in brackets is called a set of ordered pairs. If a, b are two elements of a set, then it is possible to write two different pairs are (a, b) and (b, a). In (a, b) a is called the first component and b is called the second component.

If A and B are two sets and a is an element of set A and b is an element of set B, then the ordered pair of elements is (a, b). Here a is called the 1st component and b is called the 2nd component of the ordered pair. The ordered pair is used to locate a point in the coordinate system. The first integer in the ordered pair s called either x-coordinate or abscissa and the second integer is ordinate or y-coordinate.

Equality of Ordered Pairs

Two ordered pairs are said to be equal if and only if the corresponding 1st components and 2nd components are equal. In case their corresponding components are not equal, then the ordered pairs are not equal. It means (a, b) ≠ (b, a) as their 1st, 2nd components are not equal. For example, two ordered pairs (x, y) and (m, n) are equal if x = m and y = n. Both the elements of an ordered pair can be the same but they are not equal.

Ordered Pairs Examples

Example 1:

Calculate the values of a and b if two ordered pairs (a, b) and (7, 8) are equal.

Solution:

Given two ordered pairs are (a, b) and (7, 8)

Two ordered pairs are equal means their corresponding elements are also equal.

So, 1st components are equal, second components are equal.

a = 7 and b = 8.

Example 2:

If (2x + 5, \(\frac { y }{ 2 } \) – 7) = (10, 16), then find the values of x and y.

Solution:

Given that,

(2x + 5, \(\frac { y }{ 2 } \) – 7) = (10, 16)

Two ordered pairs are equal means their corresponding first components and second components are equal.

So, 2x + 5 = 10 and \(\frac { y }{ 2 } \) – 7 = 16

2x = 10 – 5 and \(\frac { y }{ 2 } \) = 16 + 7

2x = 5 and \(\frac { y }{ 2 } \) = 23

x = \(\frac { 5 }{ 2 } \) and y = 23 x 2

x = \(\frac { 5 }{ 2 } \) and y = 46

Example 3:

Find the values of a, b if both ordered pairs (3a, 3) and (5a – 4, b + 1) are equal.

Solution:

Given two ordered pairs are (3a, 3), (5a – 4, b + 1)

Two ordered pairs are equal means their corresponding first components and second components are equal.

So, Equate 1st components

3a = 5a – 4

5a – 3a – 4 = 0

2a = 4

a = \(\frac { 4 }{ 2 } \)

a = 2

Equate second components

3 = b + 1

b = 3 – 1

b = 2

Therefore, a = 2, b = 2.

FAQ’s on Ordered Pairs

1. What is an ordered pair in the sets?

An ordered pair has a pair of elements that are placed in a particular order and enclosed in brackets. There are formed while doing the cross product of sets.

2. What is the structure of an ordered pair?

The structure of an ordered pair is (a, b). Where a is the 1st component, b is the 2nd component of the ordered pair and a ∈ A, b ∈ B.

3. How to say 2 ordered pairs are equal?

Two ordered pairs are equal only when their corresponding component values are equal. The ordered pair (x, y) is equal to (a, b) means x = a and y = b.

Cartesian Product of Two Sets – Definition, Properties, Examples | How do you find Cartesian Product of Two Sets?

Cartesian Product of Two Sets

Cartesian Product is one of the operations performed on sets. Set is a collection of well-defined objects. Cartesian product is nothing but multiplying two or more sets to get the product set. It is also known as the cross product. Get to know about the Cartesian Product of Two Sets definition, solved examples, and what is an ordered pair and others in the following sections.

Cartesian Product of Two Sets – Definition

The cartesian product of two sets A and B is denoted by A x B. Where A x B is a set of all possible ordered pairs in the form of (a, b), here a ∈ A, b ∈ B. The roster form of the cartesian product of two sets is A x B = {(a, b) | a ∈ A and b ∈ B}. The cartesian product is also called the cross product.

The cartesian product of two sets A x B is not equal to B x A. Because their ordered pairs are not equal. If A = B, then the cartesian product A x B = A x A = A² is called the cartesian square. A² = {(a, b) : a ∈ A and b ∈ A}. Follow these sections to learn the concept of the ordered pair in sets.

Ordered Pairs

Ordered pairs are formed when you perform cross product between two sets. Ordered pairs are the pairs of numbers with coordinates to represent various points on the coordinate place. It is defined as the set of two objects gathered with an order associated with them. These are usually, written in parenthesis and each element are separated by a comma. In an ordered pair (a, b) the element a is called the first component or first entry and element b is called the second component or second entry of the pair.

Two ordered pairs are said to be equal if their corresponding entries are equal. So, (a, b) ≠ (b, a). The equality of ordered pairs is (a, b) = (d, c) only when a = d and b = c.

If an ordered pair has more than two elements in it, then it is called an ordered n-tuple. An ordered n-tuple is formed when a set of n objects are grouped with an order associated with them. Tuples are denoted by (a1, a2, a3, a4, . . . an). Ordered pairs are also called 2-tuples.

Properties of Cross Product

  • The cartesian product is non-commutative.
    • A x B ≠ B x A.
    • A x B = B x A only when A = B.
    • A x B = ∅, if either A = ∅ or B = ∅
  • The cartesian product is non-associative:
    • (A x B) x C ≠ A x (B x C)
  • Distributive Property over Set Union is
    • A x (B U C) = (A x B) U (A x C)
  • Distributive Property over Set Intersection is
    • A x (B ∩ C) = (A x B) ∩ (A x C)
  • Distributive Property over Set Difference is
    • A x (B – C) = (A x B) – (A x C)
  • If A ⊆ B, then A × C ⊆ B × C for any set C.

Cartesian Product of Several Sets

Cartesian product of several sets means the product of more than two sets. The cross product of n non-empty sets is A₁ x A₂ x A₃ x . . . x An is defined as the set of ordered n-tuples (a₁, a₂, a₃, . . an) where ai ∈ Ai. If A₁ = A₂ = A₃ . . . = An = A then A₁ x A₂ x A₃ x . . . x An is the nth cartesian power of set A and is denoted as An.

Also, Read:

Intersection of SetsOperations on Sets
Union of SetsComplement of a Set
Difference of Two Sets

Cartesian Product of Two Sets Examples

Question 1:

If A = {4, 8, 15}, B = {x, y, z}, then find A x B and B x A.

Solution:

Given two finite non-empty sets are

A = {4, 8, 15}, B = {x, y, z}

A x B = {4, 8, 15} x {x, y, z}

= {(4, x), (4, y), (4, z), (8, x), (8, y), (8, z), (15, x), (15, y), (15, z)}

B x A = {x, y, z} x {4, 8, 15}

= {(x, 4), (x, 8), (x, 15), (y, 4), (y, 8), (y, 15), (z, 4), (z, 8), (z, 15)}

The 9 ordered pairs thus formed can represent the position of points in a plane, if A and B are subsets of a set of real numbers.

Question 2:

If A = {a, b, c, d}, then find A x A or A².

Solution:

Given set is A = {a, b, c, d}

A² = A x A = {a, b, c, d} x {a, b, c, d}

= {(a, a), (a, b), (a, c), (a, d), (b, a), (b, b), (b, c), (b, d), (c, a), (c, b), (c, c), (c, d), (d, a), (d, b), (d, c), (d, d)}

The number of ordered pairsare 16.

Question 3:

If A and B are two sets and A × B consists of 6 elements: If three elements of A × B are (2, 5) (3, 7) (4, 7) find A × B.

Solution:

Given that,

A × B consists of 6 elements.

Three elements of A × B are (2, 5) (3, 7) (4, 7)

By observing the above-ordered pairs, we can say that 2, 3, 4 are the elements of setA and 5, 7 are the elements of set B.

So, A = {2, 3, 4}, B = {5, 7}

Then A x B = {(2, 5), (2, 7), (3, 5), (3, 7), (4, 5), (4, 7)}

Thus A x B has 6 elements.

Question 4:

If A = {2, 4, 6}, B = {1, 3, 5}, then find (i) A x B (ii) B x B (iii) B x A (iv) A x A.

Solution:

Given two sets are A = {2, 4, 6}, B = {1, 3, 5}

(i) A x B = {2, 4, 6} x {1, 3, 5}

= {(2, 1), (2, 3), (2, 5), (4, 1), (4, 3), (4, 5), (6, 1), (6, 3), (6, 5)}

(ii) B x B = {1, 3, 5} x {1, 3, 5}

= {(1, 1), (1, 3), (1, 5), (3, 1), (3, 3), (3, 5), (5, 1), (5, 3), (5, 5)}

(iii) B x A = {1, 3, 5} x {2, 4, 6}

= {(1, 2), (1, 4), (1, 6), (3, 2), (3, 4), (3, 6), (5, 2), (5, 4), (5, 6)}

(iv) A x A = {2, 4, 6} x {2, 4, 6}

= {(2, 2), (2, 4), (2, 6), (4, 2), (4, 4), (4, 6), (6, 2), (6, 4), (6, 6)}.

FAQs on Cartesian Product of Two Sets

1. What is the Cartesian product of 3 sets?

The cartesian product of three sets A, B and C are denoted by A x B x C = {(a, b, c) | a ∈ A, b ∈ B, c ∈ C}.

2. What is the cartesian square?

Cartesian square means the cross product of two same sets. A² is the cartesian square.

3. What is the product of two sets?

The product is nothing but the cross product of two sets A and B, denoted A × B. It is the set of all possible ordered pairs where the elements of A are first and the elements of B are second.

4. Write an example for the cartesian product?

Let A = {1, 2, 3}, B = {a, b, c}, C = {apple, grapes, guava} be three sets.

A x B x C = {(1, a, apple), (1, a, grapes), (1, a, guava), (1, b, apple), (1, b, grapes), (1, b, guava), (1, c, apple), (1, c, grapes), , (1, c, guava), (2, a, apple), (2, a, grapes), (2, a, guava), (2, b, apple), (2, b, grapes), (2, b, guava), (2, c, apple), (2, c, grapes), (2, c, guava), (3, a, apple), (3, a, grapes), (3, a, guava), (3, b, apple), (3, b, grapes), (3, b, guava), (3, c, apple), (3, c, grapes), (3, c, guava)}

It has 27 ordered pairs.

Bar Graphs – Types, Properties, Uses, Advantages | How to Draw a Bar Graph? | Bar Graph Questions and Answers

Construction of Bar Graphs

Let us see how to remember easily the marks of every student in all subjects using bar graphs. Suppose your teacher wants to show the comparison of the marks of students in all subjects, then it will take more time for comparing all subjects, to avoid this problem we can use bar graphs concept. In this platform, we can easily learn the bar graph definition, construction of a bar graph, advantages of bar graph, and examples.

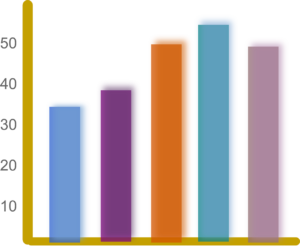
We learned that a bar chart is beneficial for comparing facts. The bars provide a visible display for comparing quantities in several categories. Bar graphs can have horizontal or vertical bars. In this lesson, we’ll show you the steps for constructing a bar chart.

Also, Read:

Bar Graph – Definition

Bar graphs are defined as the pictorial representation of data, it’s within the sort of vertical rectangular bars or horizontal rectangular bars, where the length of bars are proportional to the measure of data. Bar graphs are also called as Bar charts, it is one for data handling in statistics.

Types of Bar Graphs

There are two types of bar graphs, those are namely

  1. Horizontal Bar Graphs
  2. Vertical Bar Graphs

Uses of Bar Graphs

  • Bar graphs are match things between different groups or trace changes over time. when trying to estimate change over time, bar graphs are best suitable when the changes are bigger.
  •  Bar charts possess a discrete domain of divisions and are normally scaled so that all the information can fit on the graph. When there’s no regular order of the divisions being matched, bars on the chart could also be organized in any order.
  • Bar charts organized from the high to the low number are called Pareto charts.

Properties of Bar Graphs

Bar graphs are used for pictorial representation of the data. Some of the properties of Bar Graphs are listed below,

  • In Bar graphs, each column or bar in a bar graph is of equal width.
  • All bar graphs bars have a common base.
  • The height of the bar corresponds to the worth of the information.
  • The distance between each bar is the same.

Advantages of Bar Graphs

The important advantages of the bar graphs are given below and they are along the lines,

  1. Bar graphs are easily understood because of widespread use in business and therefore the media.
  2. Bar graphs show each data category during a frequency distribution.
  3. It summarizes an outsized data set in visual form.
  4. A bar chart is often used with numerical or categorical data.
  5. Bar graph permits a visual check of accuracy.

How to Construct Bar Graph? | Steps to Make a Bar Graph

To represent the information using the bar graph, you need to follow the steps given below.

Step 1: First, keep the title of the bar graph or bar chart.

Step 2: Next, Draw the vertical axis and horizontal axis.

Step 3: Now, we can label the horizontal axis.

Step 4: Write the horizontal axis names.

Step 5: Now, label the vertical axis.

Step 6: Finalise the size range for the given data.

Step 7: Finally, draw the bar graph that ought to represent each category of the information with their respective numbers.

Bar Graph Construction Examples

Let us consider an example, we have four different years of population, such as 1991, 1992, 1993,1994 and the corresponding percentages are 82, 85, 90, and 92 respectively.

To visually representing the given information using the bar graph, we need to follow the steps given below.

Step 1: First, fix the title of the bar chart or bar graph.

Step 2: Draw the horizontal axis and vertical axis. (write, population years)

Step 3: Now, label the horizontal axis.

Step 4: Write the names on the horizontal axis, such as 1991, 1992, 1993, 1994

Step 5: Now, label the vertical axis. (write percentage)

Step 6: Finalise the size range for the given data.

Step 7: Finally, draw the bar graph that should represent each year’s population with their respective percentages.

Example 1:

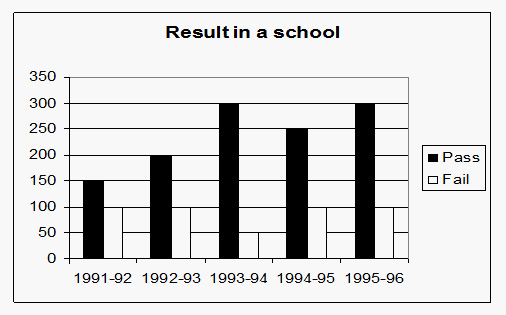
Study the subsequent graph carefully and answer the questions that follow. The results of students in a school graph are as shown

1. What is the difference in the number of students who passed to those who failed is minimum in which year?

2. How many times the number of students are failed as same?

3. What percentage will increase within the total number of students maximum as compared to the previous year?

4. What is the approximate percentage of students who failed during 5 years?

Solution:

Given the results of student in a school in the form of a bar graph

Now we can find the given questions,

(i) In these, first find the difference in all the years

The difference between the number of students passed to those who failed in the year 1991 – 1992 is,

=150 – 100 = 50

The difference between the number of students passed to those who failed in the year 1992 – 1993 is,

=200 – 100 = 100

The difference between the number of students passed to those who failed in the year 1993 – 1994 is,

=300 – 50 = 250

The difference between the number of students passed to those who failed in the year 1994 – 1995 is,

=250 – 100 = 150.

Therefore, considering all the difference the minimum number of students passed to those who failed is, in the year 1991 – 1992 = 50.

(ii) In this, we find the number of times students failed as same,

Based on the observation number of failed students are the same in the years 1991- 1992, 1992- 1993, 1994- 1995, and 1995- 1996.

Therefore, the number of failed students is the same as are Four times.

(iii) In this we are finding how much percentage will be increased compared to the previous year.

Firstly we can find the percentage of every year,

In the year 1992- 1993, percentage(%) increase is

= 100 x (300 – 250) / 250 = 100 x (50)/ 250 = 20%

In the year 1993- 1994, percentage(%) increase is

= 100 x (350 – 300) / 300 = (50 / 3)% = 16.6%

In the year 1994- 1995, percentage (%) increase is,
= 100 x (350 – 350) / 350 = 0%

In the year 1995-1996, percentage(%) increase is

= 100 x (400 – 350) / 350 = 100 x (50)/350 = 14.2%.

Therefore, considering all the percentage 20% is higher than the previous year.

(iv) In this we are finding the total number of failed students,

The total number of failed students is,

= 50+100+100+100+100 = 450

Therefore, the Required average of students is = 450/5 = 90.

FAQs on Construction of Bar Graph

1. What are the various types of Bar graphs?

Bar graphs are of two types, namely:

  1. Horizontal Bar Graph
  2. Vertical Bar Graph

Based on these two types, again bar graphs are two types

  1. Grouped Bar Graph
  2. Stacked Bar Graph

2. List the advantages of a Bar Graph?

  •  Bar graphs are easily understood due to widespread use in business and therefore the media.
  • It summarizes an outsized data set in visual form.
  • A bar chart is often used with numerical or categorical data.
  • Bar graph permits a visual check of accuracy.

3. How do you calculate a bar graph?

Draw two perpendicular lines intersecting each other at a point O. The vertical line is that the y-axis and therefore the horizontal is that the x-axis. Choose an appropriate scale to work out the peak (height) of every bar. On the horizontal line, draw the bars at equal distances with corresponding heights.

Comparison of Three Digit Numbers – Definition, Rules, Examples | How to Compare 3-Digit Numbers?

Comparison of Three Digit Numbers

If you find any difficulty in understanding three-digit numbers, here you can have good knowledge of three-digit numbers like its definition, comparison of three-digit numbers. Learn How to arrange 3 digit numbers in ascending order and descending order. For a better understanding of this concept check the examples on comparison of three-digit numbers.

Also, Read:

What are Three-Digit Numbers?

Three-digit numbers have only three digits. In three-digit numbers, the numbers are placed at one’s, ten’s, and hundred’s place. In the right of the number the last digit is one’s place, then the second digit is ten’s place and to the left of it, there is a hundred’s place. The digits have their face value in a given number. Three-digit numbers are from 100 to 999.

For example, in 635 the place value of 6 is 600, 3 is 30, and 5 is 5. In other words, we can write this as six hundred thirty-five.

How to Compare Three-Digit Numbers?

Know the procedure on how to compare 3 digit numbers by going through the below-listed steps. They are along the lines

(i) The numbers which have less than three digits are always smaller than the numbers having three digits as:

128 > 73 , 120 > 7 or 7 < 120 , 58 < 158

175 > 65 , 529 > 59 , 703 > 8 , etc.

(ii) If both the numbers have the same number (three) of digits, then the digits of the hundred-place and tens place are compared.

a) If the third digit from the right (Hundred-place digit) of a number is greater than the third digit from the right (Hundred-place digit) of the other number then the number having the greater is the greater one.

855>713, 984>981, 100>9,100>99.

b) If the numbers have the same third digit from the right, then the digits at ten’s place are compared and follow the rules of comparison of two-digit numbers.

967 > 929 , 586 > 567 , 462 > 449

c) If the digits at Hundred-place and ten’s place are equal, then follow the rules of comparison of single-digit numbers.

958 > 953 , 876 > 872 , 634 > 631

Comparing 3 Digit Numbers Examples

Example1:

Compare three digit numbers 534, 345

Solution:

In 534 ,5 is in hundreds place.

3 is in the tens place.
4 is in one’s place.

In 345,3 is in the hundreds place.

4 is in the tens place.

5 is in one’s place.

since two numbers have three digits compare the hundreds place of two numbers.

5 is greater than 3.

so 534 greater than(>) 345.

Example 2.

Compare three-digit numbers 583, 526

Solution:

In 583,5 is in the hundreds place.

8 is in the tens place.

3 is in one’s place.
In 526, 5 is in the hundreds place.

2 is in the tens place.

6 is in one’s place.

since the hundreds place of both the numbers are same compare tens place.

8>2

So 583>526.

Numbers can be arranged in two ways.1) Ascending order 2) Descending Order.

Ascending Order

Ascending order means the numbers are arranged from smallest to largest. the smallest number comes first and then the largest numbers.

How to arrange 3-Digit Numbers in Ascending Order?

1. Arrange the numbers 100,150,567,120,852,480 in ascending order.

The numbers in ascending order are 100,120,150,480,567,852.

2. Arrange the numbers 354,764,120,967,534,423 in ascending order.

The numbers in ascending order are 120, 354, 423, 534, 764, 967.

3. Arrange the numbers 220,560,420,678,168,934 in ascending order.

The numbers in ascending order are 168, 220,420,560,678,934.

Descending Order

Descending order means the numbers are arranged from largest to smallest. the largest number comes first and then the smallest numbers.

How to arrange 3-Digit Numbers in Descending Order?

1. Arrange the numbers 345,567,987,213,621,789 in descending order.

The numbers in descending order are 987,789,621,567,345,213.

2. Arrange the numbers 150,533,189,256,876,323 in descending order.

The numbers in descending order are 876,533,323,256,189,150.

3. Arrange the numbers 100,623,345,750,923,420 in descending order.

The numbers in descending order are 923, 750, 623, 420, 345, 100.

FAQ’s on Three Digits Numbers Comparison

1. What is the greatest three-digit number?

The greatest three-digit number is 999.

2. What is the smallest three-digit number?

The smallest three-digit number is 100.

3. Is a three-digit number greater than any single-digit number?

Yes, any Three-digit number is greater than any single-digit number.

4. Is a three-digit number greater than any two-digit number?

Yes, a three-digit number is greater than any two-digit number.

Comparison of Two Digit Numbers – Definition, Examples | How to Compare 2 Digit Numbers?

Comparison of Two Digit Numbers

If you are looking for the concept of two-digit numbers, you have landed on the correct page. This page gives you clear information about two-digit numbers,two-digit number definition, comparison of two-digit numbers, arranging 2 digit numbers in ascending order, descending order. Also, find examples of comparison of two-digit numbers so that you can solve related problems on your own.

Also, Read:

Two-Digit Numbers – Definition

Two-digit numbers have two digits. The last digit from the right-hand side represents one’s place and the other digit represents tens place. Two-digit numbers start from 10 and end with 99. Example of two-digit numbers are 10,14, 17, 19, 25, 50, 100 etc.

How do you Compare Two-Digit Numbers?

When comparing two-digit numbers we use greater than symbol(>) for greater values and less than a symbol for lesser values. When both the numbers are equal then we use equal to (=). The two other symbols used for comparison are ≥ (greater than or equal to) and ≤ (less than or equal to).

When comparing two digits we must consider the following rules.
  • The number which has greater valued digit at ten’s place is greater as compared to other:85 > 24, 98 > 53 , 65 > 29 ,72>33,49>14 etc.
  •  If the digits at ten’s place of both the numbers are equal, then the digits at one’s place of both the numbers are compared. The number which has the greater digit at one’s place is greater than the other.43>42, 65>61, 15>11,29>25,38>36 etc.consider other examples on comparison of two-digit numbers.

Comparing 2 Digit Numbers Examples

Example 1.

Compare Two-digit numbers 72, 47.

Solution:

In 72 7 is in the tens place and 2 is in one’s place.

In 47 4 is in the tens place and 7 is in one’s place.

When we compare tens place of both the numbers 7>4.So 72>47.

Example 2.

Compare two digit numbers 95, 68.

Solution:

In 95 9 is in the tens place and 5 is in one’s place.

In 68 6 is in the tens place and 8 is in one’s place.

when we compare tens place of both the numbers 9>6.So 95>68.

Example 3.

Compare two digits 65, 84.

Solution:

In 65 6 is in the tens place and 5 is in one’s place.

In 84 8 is in the tens place and 4 is in one’s place.

when we compare tens place of both the numbers 8>6.So 84>65

Example 4.

Compare two digits 69, 63.

Solution:

In 69 6 is in the tens place and 9 is in one’s place.

In 63 6 is in the tens place and 3 is in one’s place.
When we compare, tens place of both the numbers are same i.e.  6. so compare one’s digit of both the numbers. one’s digit of 69 is 9 and one’s digit of 63 is 3.
9>3.

So 69 is greater than 63.

Example 5.

Compare two digit numbers 81, 85.

Solution:

In 81 8 is in the tens place and 1 is in one’s place.

In 85 8 is in the tens place and 5 is in one’s place.

when we compare, the tens place of both the numbers is the same. Compare one’s place of both the numbers5>1. So 85 is greater than 81.

Example 6.

Compare two digit numbers 71, 78?

Solution:

In 71 7 is in the tens place and 1 is in one’s place.

In 78 7 is in the tens place and 8 is in one’s place.

when we compare, the tens place of both the numbers is the same. compare one’s place of both the numbers8>1. So 78 is greater than 71.

Two-Digit numbers are always greater than the one-digit number. Consider the following examples

15>9, 25>5, 33>6, 68>8, 18>9, 12>4 etc.

Numbers can be arranged in two ways. One is in Ascending Order and the other one is Descending Order.

Arranging 2 Digit Numbers in Ascending Order

Ascending order means to arrange numbers from smallest to largest. i.e. smaller digit numbers come first and then larger numbers.

For example Arrange the numbers 15,92,27,87,62,23,48,63,76 in ascending order.

Ascending order are 15, 23,27, 48,62, 63, 76,

Arrange the numbers 12,22,66,43,56,85,14,10,38 in ascending order.

Ascending order are 10, 12, 14, 22, 38, 43, 56, 66, 85.

Arrange the numbers 52,22,66,14,56,85,64,70,38 in ascending order.

Ascending order are 14, 22, 38, 52, 56, 64, 66, 70, 85.

Arrange the numbers 85,12,76,41,96,58,44,20,68 in ascending order.

Ascending order are 12, 20, 41, 44, 58, 68, 76, 85, 96.

Arranging 2 Digits Numbers in Descending Order

Descending order means arranging numbers from largest to smallest. i.e. larger digit numbers come first and then smaller numbers.

Consider the following examples

Arrange the numbers 75,32,66,11,96,58,34,20,48 in Descending order.

Descending order are 96, 75, 66, 58, 48, 34, 32, 20, 11.

Arrange the numbers 15,72,66,11,69,28,54,20,98 in Descending order.

Descending order are 98, 72, 69, 66, 54, 28, 20, 15, 11.

Arrange the numbers 13,32,46,10,29,78,42,60,88 in Descending order.

Descending order are 88, 78, 60, 46, 42, 32, 29, 13, 10.

Arrange the numbers 18,62,36,48,29,78,42,20,80in Descending order.

Descending order are 80, 78, 62, 48, 42, 36, 29, 20, 18.

FAQ’S on 2 Digits Comparison

1. What is a two-digit number?

A two-digit number has two digits.

2. What is the smallest two-digit number?

The smallest two-digit number is 10.

3. What is the largest two-digit number?

The largest two-digit number is 99.

4. How many two-digit numbers are there?

There are 90 two-digit numbers.

H.C.F. and L.C.M. of Decimals Problems with Solutions | How to find HCF and LCM of Decimals?

HCF and LCM of Decimals

Are you worried about how to calculate the Highest Common Factor and Least Common Multiple of Decimals? If so, don’t panic as we will give you the entire information on LCM, HCF Definitions, How to Calculate LCM and HCF of Decimals, etc. Solved Problems on HCF and LCM of Decimals explained in the later modules will help you to understand the concepts better.

Also, Read: Worksheet on LCM

Least Common Multiple & Highest Common Factor – Definitions

Highest Common Factor: Greatest Common Divisor or Highest Common Factor for two or more positive integers is the largest positive integer that divides the numbers exactly and leaves a remainder zero.

Least Common Multiple: Least Common Multiple or LCM of two or more numbers is the smallest or least positive integer that is divisible by both the numbers.

How to find HCF and LCM of Decimals?

While solving the Problems related to Highest Common Factor and Least Common Multiple follow the simple steps listed below. They are in the following fashion

  • Firstly, convert unlike decimals to like decimals.
  • Later, find the Least Common Multiple and Highest Common Factor using the regular procedure as if there is no decimal point.
  • Once you obtain the HCF, LCM places the decimal point in the result as the same number of decimal places in the like decimals.

Worked Out Examples on HCF and LCM of Decimal Numbers

Example 1.

Find the HCF and LCM of 1.20 and 3.6?

Solution:

Given Decimals are 1.20 and 3.6

Since they are unlike decimals firstly convert them to like decimals by annexing them with the required number of zeros. The maximum number of decimal places is 2 and converting to like decimals we get

1.20 → 1.20

3.6 → 3.60

Now, find the LCM, HCF of Numbers without considering the decimal point as if they are regular numbers.

LCM(120, 360) = 360

HCF(120, 360) = 120

Now that you found the Least Common Multiple and Highest Common Factor place the decimal point the same number of places in the like decimals.

Thus, LCM of Decimals 1.20 and 3.60 is 3.60

HCF of Decimals  1.20 and 3.60 is 1.20

Therefore, LCM, HCF of Decimals 1.20 and 3.60 are 3.60, 1.20 respectively.

Example 2.

Find the H.C.F. and the L.C.M. of 0.24, 0.48, and 0.72?

Solution:

Given Decimals are 0.24, 0.48, 0.72

Since they are all like decimals we need not convert them again.

Find the LCM, HCF of given decimals considering them as regular numbers, and neglect the decimal point.

LCM(24, 48, 72) = 144

HCF(24,48,72) = 24

Since you found the Least Common Multiple and Greatest Common Factor place the decimal point the same number of places equal to the like decimals

Thus LCM of 0.24, 0.48, 0.72 is 1.44

HCF of 0.24, 0.48, 0.72 is 0.24

Thus, LCM and HCF of 0.24, 0.48, 0.72 are 1.44 and 0.24

Example 3.

Find the LCM, HCF of 0.5, 1.5, 0.27, and 3.6?

Solution:

Given Decimals are 0.5, 1.5, 0.27 and 3.6

Convert the given decimals to like decimals by simply placing the required number of zeros. The maximum number of decimal places is 2 so we will annex with the required zeros.

0.5 → 0.50

1.5 → 1.50

0.27 → 0.27

3.6 → 3.60

Find the LCM, GCF without considering the decimal point as if they are regular numbers.

LCM(50, 150, 27, 360) = 5400

HCF(50, 150, 27, 360) = 1

Now, place the decimal point in the result obtained the same number of decimal places as in the like decimals

LCM(0.5, 1.5, 0.27, 3.6) = 54.00

HCF(0.5, 1.5, 0.27, 3.6) = 0.01

Therefore, LCM and HCF of Decimals 0.5, 1.5, 0.27 and 3.6 are 54.00 and 0.01 respectively.

Rounding Decimals to the Nearest Hundredths – Definition, Examples | How to Round a Decimal to Nearest Hundredths?

Rounding Decimals to the Nearest Hundredths

Wanna make some estimations and round decimals as a part of your calculations? If so, you will get a complete idea of Rounding Decimals to the Nearest Hundredths such as definition, rules for rounding decimals to the nearest hundredths, solved examples on explaining how to round decimals to hundredths. Rounding Decimals to the Hundredths Place is nothing but rounding to the two decimal places or correcting to two decimal places.

Also, Read:

What is Rounding Decimals to the Nearest Hundredths?

Rounding Decimals to the Nearest Hundredths is nothing but rounding the decimal to hundredths place value or two digits after the decimal point. Rounding doesn’t give accurate values but will provide approximate values of our number. Calculations will become quite easier if we round decimals. For Example, 12.658 rounded to nearest hundredths is 12.66

Rules for Rounding Decimals to the Nearest Hundredths | How to Round Decimals to the Nearest Hundredths?

Follow the simple and easy steps provided below for rounding decimals to the nearest hundredths. They are in the following fashion

  • Identify the number you want to round and mark the digit in the hundredths column.
  • To round a decimal to nearest hundredths analyze the digit in the thousandths place value.
  • If the digits in the thousandths column are 0, 1, 2, 3, 4 round down the value in the hundredths column to the nearest hundredths.
  • If the digits in the thousandths column are 5, 6, 7, 8, or 9 round up the value in the hundredths column to the nearest hundredths.
  • Remove all the digits after the hundredths place and the resultant is the desired answer.

Examples of Rounding Decimals to the Nearest Hundredths

Example 1.

Round off the number 14.567 to the nearest hundredth?

Solution:

Given Decimal Number is 14.567

Since we are rounding decimals to the nearest hundredths check the digit in the thousandths place. The digit in the thousandths place is 7, round up the hundredths column value to the nearest hundredths.

Thus, the digit in hundredths place increases by 1 i.e. 6 → 7

Remove all the digits after the hundredths place.

14.567 →14.57

Therefore, 14.657 rounded to hundredths place is 14.57

Example 2.

Round off the number 50.284 to the nearest hundredths?

Solution:

Given Decimal Number is 50.284

Since we are rounding decimals to the nearest hundredths check the digit in the thousandths place. The digit in the thousandths place is 4, round down the hundredths column value to the nearest hundredths.

Remove all the digits after the hundredths place.

50.284 → 50.28

Therefore, 50.284 rounded to nearest hundredths is 50.28

Example 3.

Round off 65.3426 to the nearest hundredth?

Solution:

Given Decimal is 65.3426

Analyze the digit in thousandths places i.e. the digit to the right of a hundredths place. In this case, 2 is the digit in thousandths place as it is less than 5 we will keep the digit in hundredths place as it is. Remove all the digits after the hundredths place.

65.3426 → 65.34

Therefore, 65.3426 rounded to nearest hundredths is 65.34

Example 4.

Round 7.687 to the nearest hundredth?

Solution:

Given Decimal is 7.687

Analyze the digit in the thousandths place i.e. the digit to the right of the hundredths place. In this case, 7 is in thousandths place as it is greater than 5 we will round up the digit in the hundredths place and then remove all the digits next to the hundredths place.

7.687 → 7.69

Therefore, 7.687 rounded to the nearest hundredths is 7.69

Rounding Decimals to the Nearest Tenths | How to Round Decimals to the Nearest Tenths?

Rounding Decimals to the Nearest Tenths

Rounding Decimals to the Nearest Tenths is the same as Rounding Decimals to One Decimal Place. Go through the entire article to be familiar with every detail such as Round Off Decimals Definition, Rules for Rounding Decimals, Steps on How to Round Decimals to the Nearest Tenths, etc. Check out Solved Examples on Rounding Decimals in the later modules and get a complete idea on the concept.

Also, Read:

Rounding Decimals – Definition

We can round decimals to a certain accuracy or limit them to number of places. By doing so, your calculations can be made much faster and results can be easily understood. You can go for rounding decimals technique when exact values aren’t much important.

How to Round Decimals to the Nearest Tenths?

Follow the simple steps provided below to round decimals to the nearest tenths. They are in the below fashion

  • Firstly, check the decimal number you wanted to round.
  • To round, a decimal to the nearest tenths check the hundredths place digit, and if it is less than 4 or 4 remove all the digits to the right.
  • If the hundredths place digit is 5 or greater than 5 simply add 1 to the digit in the tenths place.
  • The decimal number left over is the resultant value rounded to the nearest tenths.

Solved Examples on Rounding Decimals to the Nearest Tenths

Example 1.

What is 8.05 rounded to the nearest tenths?

Solution:

Given Decimal Number is 8.05

Analyze the digit in the hundredths place. In this case the digit in hundredths place is 5 so we will add 1 to the digit in the tenths place. Remove all the digits to the right.

8.05 → 8.1

Therefore 8.05 rounded to the nearest tenths is 8.1

Example 2.

What is 12.456 rounded to the nearest tenths?

Solution:

Given Decimal Number is 12.456

Analyze the digit in hundredths place. In this case digit in hundredths place is 5 so we will add 1 to the digit in tenths place. Remove all the digits to the right.

12.456 →12.5

Therefore, 12.456 rounded to nearest tenths is 12.5

Example 3.

Round 8.234 to the nearest tenths?

Solution:

Given Decimal Number is 8.234

Now, we want to round to the nearest tenths analyze the digit in hundredths place. Hundredths Place is 3 i.e. <5 so the digits in tenths place remain unchanged and digits at hundredths place and thereafter becomes zero.

8.234 → 8.2

Therefore, 8.234 rounded to the nearest tenths is 8.2

Example 4.

Round 13.04 to the nearest tenths?

Solution:

Given Decimal Number is 13.04

Now, we want to round to the nearest tenths analyze the digit in the hundredths place. In this case, Hundredths place is 4 i.e. <5 so the digits in tenths place remain unchanged and digits in hundredths place and thereafter becomes zero.

13.04 → 13.1

Therefore, 13.04 rounded to the nearest tenths is 13.1

Worksheet on Functions or Mapping | Functions Mapping Worksheet with Answers

Worksheet on Functions or Mapping

Get better practice by referring to the Worksheet on Functions or Mapping. Students who are interested in learning the complete concept of Functions or Mapping can learn it from Functions Mapping Worksheets. These Worksheets help you to have better practice for exams. We have included different problems along with solutions and explanations for your better preparation.

Easily improve your preparation level with the help of or Functions Worksheet. Check out the step-by-step solution and get complete knowledge of the concept. Mainly domain, co-domain, and range of functions are covered in the Worksheet on Mapping or Functions.

Do Read: Worksheet on Math Relation

Functions or Mapping Worksheet with Solutions

1. Which of the following represents a mapping?
(a) {(5, 3); (6, 4); (8, 6); (10, 8)}
(b) {(3, 9); (4, 13); (5, 17)}
(c) {(4, 8); (4, 12); (5, 10); (6, 12)}
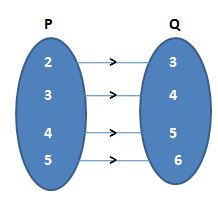
(d) {(2, 3); (3, 4); (4, 5); (5, 6)}
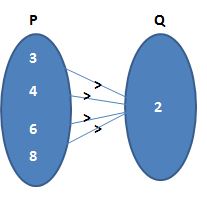
(e) {(3, 2); (4, 2); (6, 2); (8, 2)}
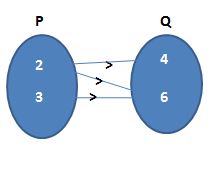
(f) {(2, 4); (2, 6); (3, 6)}

Solution:

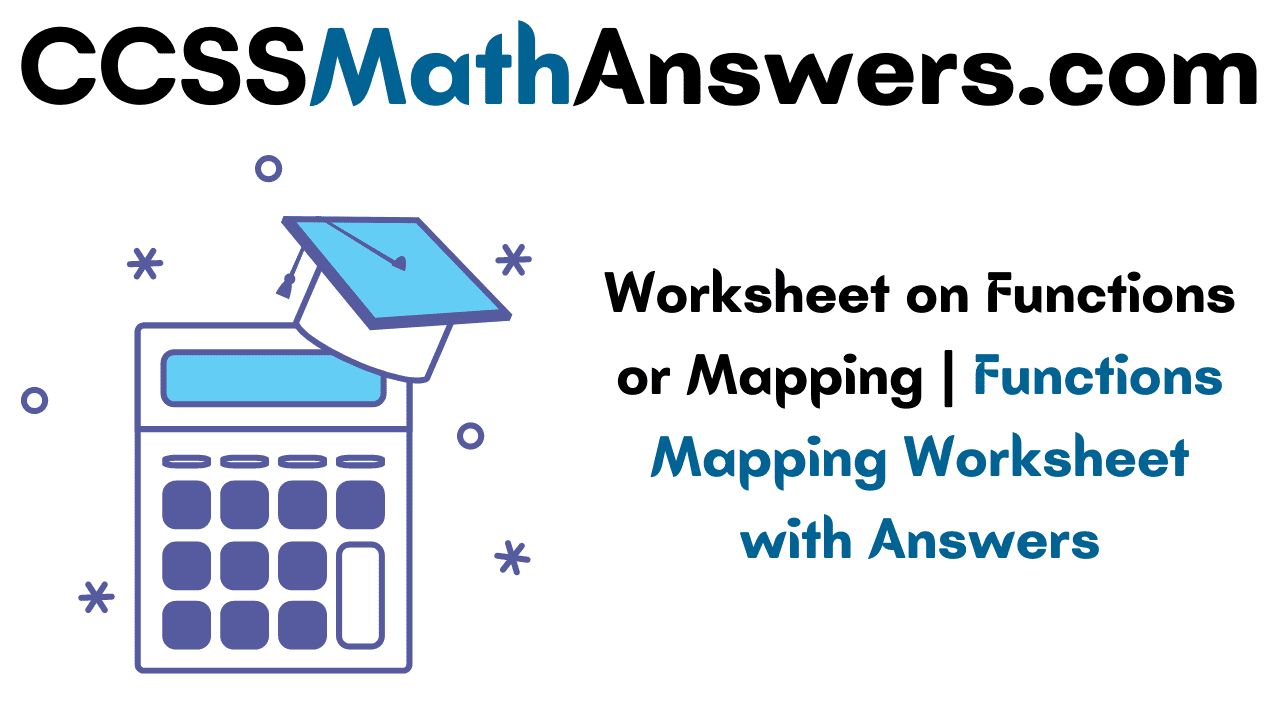
(a) Given that {(5, 3); (6, 4); (8, 6); (10, 8)}
Let the two sets are P and Q.
The required diagram is
Worksheet on Functions or Mapping
Different elements of P can have the same image in Q. Adjoining figure represents a mapping.
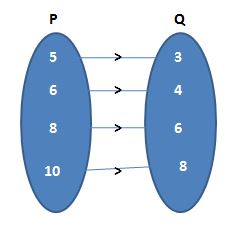
(b) Given that {(3, 9); (4, 13); (5, 17)}
Let the two sets are P and Q.
The required diagram is
Worksheet on Functions or Mapping Question
Different elements of P can have the same image in Q. Adjoining figure represents a mapping.
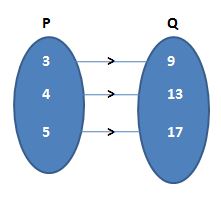
(c) Given that {(4, 8); (4, 12); (5, 10); (6, 12)}
Let the two sets are P and Q.
The required diagram is
Worksheet on Functions or Mapping Questions
No element of P must have more than one image. The adjoining figure does not represent a mapping since element 4 in set P is associated with two elements 8, 12 of set Q.
(d) Given that {(2, 3); (3, 4); (4, 5); (5, 6)}
Let the two sets are P and Q.
The required diagram is
Worksheet on Functions or Mapping Question and answer
Different elements of P can have the same image in Q. Adjoining figure represents a mapping.
(e) Given that {(3, 2); (4, 2); (6, 2); (8, 2)}
Let the two sets are P and Q.
The required diagram is
Worksheet on Functions or Mapping Question and answers
Different elements of P can have the same image in Q. Adjoining figure represents a mapping.
(f) Given that {(2, 4); (2, 6); (3, 6)}
Let the two sets are P and Q.
The required diagram is
Worksheet on Functions or Mapping Questions and answers
No element of P must have more than one image. The adjoining figure does not represent a mapping since element 2 in set P is associated with two elements 4, 6 of set Q.

Therefore, (a), (b), (d), (e) represents a mapping.


2. Which of the following arrow diagrams represents a mapping?
(a) Worksheet on Functions or Mapping problems
(b) Functions or Mapping Worksheet
(c) Functions or Mapping Worksheets
(d) Functions or Mapping Worksheet problems

Solution:

(a) Different elements of P can have the same image in Q. Adjoining figure represents a mapping.

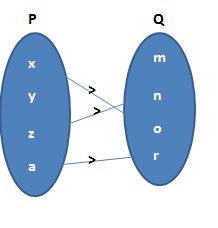
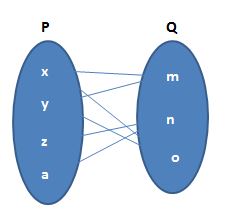
(b) Every element of P must have an image in Q. Adjoining figure does not represent a mapping since the element z in set P is not associated with any element of set Q.
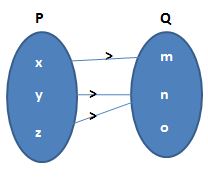
No element of P must have more than one image. The adjoining figure does not represent a mapping since element x in set P is associated with two elements m, n of set Q.

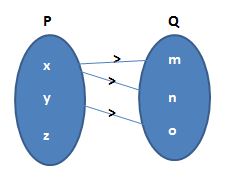
(c) Every element of P must have an image in Q. Adjoining figure does not represent a mapping since the element y in set P is not associated with any element of set Q.

(d) No element of P must have more than one image. The adjoining figure does not represent a mapping since element x in set P is associated with two elements m, o of set Q.

Therefore, (a) represents a mapping.


3. A function f is defined by f(x) = 3x – 5. Write the values of
(a) f(0)
(b) f(-3)
(c) f(4)
(d) f(-2)

Solution:

Given that a function f is defined by f(x) = 3x – 5.
(a) f(0)
To find the f(0), substitute 0 in the place of the x.
The given equation is f(x) = 3x – 5
f(0) = 3 (0) – 5 = 0 – 5 = -5
f(0) = -5

Therefore, the answer is f(0) = -5

(b) f(-3)
To find the f(-3), substitute -3 in the place of the x.
The given equation is f(x) = 3x – 5
f(-3) = 3 (-3) – 5 = -9 – 5 = -14
f(-3) = -14

Therefore, the answer is f(-3) = -14

(c) f(4)
To find the f(4), substitute 4 in the place of the x.
The given equation is f(x) = 3x – 5
f(4) = 3 (4) – 5 = 12 – 5 = 7
f(4) = 7

Therefore, the answer is f(4) = 7

(d) f(-2)
To find the f(-2), substitute -2 in the place of the x.
The given equation is f(x) = 3x – 5
f(-2) = 3 (-2) – 5 = -6 – 5 = -11
f(-2) = -11

Therefore, f(0) = -5; f(-3) = -14; f(4) = 7; f(-2) = -11


4. Find the range of each of the following functions.
(a) f(x) = 7 – x, x ∈ N, x > 0
(b) f(x) = x² + 4, x ∈ R

Solution:

(a) Given that f(x) = 7 – x, x ∈ N, x > 0
x > 0
Multiply -1 on both sides.
– x < 0
Add 7 on both sides
7 – x < 0 + 7
7 – x < 7
We know that f(x) = 7 – x
f(x) < 7
We know that value of f(x) is less than 7

Hence, Range = (-∞, 7)

(b) Given that f(x) = x² + 4, x ∈ R
x² ≥ 0
Add 4 on both sides.
x² + 4 ≥ 0 + 4
x² + 4 ≥ 4
We know that f(x) = x² + 4
f(x) ≥ 4

Hence, Range of f(x) = (4, ∞)


5. Let M = {2, 4, 8, 7} and N = {5, 9, 17, 18, 19}
Consider the rule f(x) = x + 3, where x ∈ A.
Represent the mapping in the roster form.
Also, find the domain and range of the mapping.

Solution:

Given that M = {2, 4, 7, 8} and N = {5, 9, 17, 18, 19}
Consider the rule f(x) = x + 3, where x ∈ A.
For the required Relation we have to find the ordered pairs where x co-ordinate is from set M which is mapped to the y co-ordinate from set N.
If f(2) = 2 + 3 = 5
f(4) = 4 + 3 = 7
f(7) = 7 + 3 = 10
f(8) = 8 + 3 = 11
A set of ordered pairs r = {(2, 5); (4, 7); (7, 10); (8, 11)}
Domain = Set of all first elements in a relation = {2, 4, 7, 8}
Range = Set of all second elements in a relation = {5, 7, 10, 11}


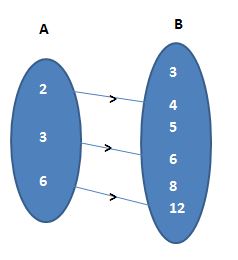
6. Let A = {2, 3, 6} B = {3, 4, 5, 6, 8, 12}
Draw the arrow diagram to represent the rule f(x) = 2x from A to B.

Solution:

Given that A = {2, 3, 6} B = {3, 4, 5, 6, 8, 12}
Consider the rule f(x) = 2x from A to B
For the required Relation we have to find the ordered pairs where x co-ordinate is from set A which is mapped to the y co-ordinate from set B.
If f(2) = 2 (2) = 4
f(3) = 2 (3) = 6
f(6) = 2 (6) = 12
A set of ordered pairs r = {(2, 4); (3, 6); (6, 12)}
Functions or Mapping Worksheet problems with answers


7. Let A = {4, 9, 12} and B = {2, 3, 4}
(a) Show that the relation R = {(4, 2), (9, 3)} is not a mapping from A to B.
(b) Show that the relation R = {(4, 2); (4, 4); (9, 3); (12, 2); (12, 4)} from A to B is not a mapping from A to B.

Solution:

Given that A = {4, 9, 12} and B = {2, 3, 4}
(a) R = {(4, 2), (9, 3)} is not a mapping from A to B.
Every element of A must have an image in B. From the given information, set A element 12 is not associated with any element of set B.

Therefore, R = {(4, 2), (9, 3)} is not a mapping from A to B.

(b) R = {(4, 2); (4, 4); (9, 3); (12, 2); (12, 4)} from A to B
No element of A must have more than one image. From the given information, set A elements 4 and 12 are associated with two elements of set B. Element 4 of Set A associated with 2 and 4. Also, the 12 of Set A associated with 2 and 4.

Therefore, R = {(4, 2); (4, 4); (9, 3); (12, 2); (12, 4)} from A to B is not a mapping from A to B.


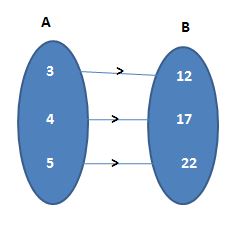
8. Let A = {3, 4, 5} and B = {12, 17, 22}
Consider the rule f(x) = 5x – 3, where x ∈ A
(a) Show that f is a mapping from A to B.
(b) Find the domain and range of the mapping.
(c) Represent the mapping in the roster form.
(d) Draw the arrow diagram to represent the mapping.

Solution:

Given that A = {3, 4, 5} and B = {12, 17, 22}
(a) If f(x) = 5x – 3, where x ∈ A
Substitute elements of A in f(x)
f(3) = 5 (3) – 3 = 12
f(4) = 5 (4) – 3 = 17
f(5) = 5 (5) – 3 = 22
Different elements of A can have the same image in B. Adjoining figure represents a mapping.

Therefore, f is a mapping from A to B.

(b) Domain = Set of all first elements in a relation = {3, 4, 5}
Range = Set of all second elements in a relation = {12, 17, 22}

(c) The mapping in the roster form r = {(3, 12); (4, 17); (5, 22)}

(d) Functions or Mapping Worksheet problems with solutions

Cardinal Properties of Sets – Definition, Formula, Diagrams, Examples | How to find the Cardinal Number of a Set?

Cardinal Properties of Sets

A set is a collection of well-defined elements. Every element in a set is enclosed between the curly braces and separated by a comma. Cardinality means the size of the set. Sets size is nothing but the number of elements present in the given set. Here we will learn more about the Cardinal Properties of Sets. Get the useful formulas and example questions in the following sections.

Cardinal Properties of Sets – Definition

The various basic properties of sets deal with the union, intersection of two or three sets. We already know that the cardinal number of sets means the number of elements of members or well defined-objects available in the set. Similarly, cardinal properties of sets handle with the sets union, intersection along with the number of sets properties. The various formulas that describe sets cardinal properties are listed here.

Formulas

If A and B are two finite sets, then

  • n(A ∪ B) = n(A) + n(B) – n(A ∩ B)
  • If A ∩ B = ф , then n(A ∪ B) = n(A) + n(B)
  • n(A – B) = n(A) – n(A ∩ B)
  • n(B – A) = n(B) – n(A ∩ B)

Cardinal Properties of Sets

Also, Read:

SetsRepresentation of a SetOperations on SetsLaws of Algebra of Sets
Pairs of SetsCardinal Number of a SetComplement of a SetStandard Sets of Numbers
Proof of De Morgan’s LawTypes of SetsSubsetObjects Form a Set
Subsets of a Given SetIntersection of SetsDifference of Two SetsBasic Concepts of Sets
Elements of a SetBasic Properties of SetsUnion of SetsDifferent Notations in Sets

Cardinal Properties of Sets Examples

Question 1:

It was found that out of 70 students, 20 students have passed in mathematics and failed in science and 30 students have passed in mathematics. How many students passed in science and failed in mathematics? How many students passed both subjects?

Solution:

Let M = {Number of students who have passed in mathematics}

S = {Number of students who have passed in science}

Number of students who passed science and failed mathematics = Total number of students – Number of students who passed mathematics

= 70 – 30

= 40

Given that,

n(M – S) = 20, n(M) = 30

Then n(M – S) = n(M) – n(M ∩ S)

n(M ∩ S) = n(M) – n(M – S)

= 30 – 20

= 10

Therefore, the number of students who have passed both subjects is 10 and the number of students who have passed in science and failed in mathematics is 40.

Question 2:

If P and Q are two finite sets such that n(P) = 25, n(Q) = 11 and n(P ∪ Q) = 32, find n(P ∩ Q).

Solution:

Given that,

n(P) = 25, n(Q) = 11 and n(P ∪ Q) = 32

We know that n(P ∪ Q) = n(P) + n(Q) – n(P ∩ Q)

n(P ∩ Q) = n(P) + n(Q) – n(P ∪ Q)

= 25 + 11 – 32

= 36 – 32

= 4

Therefore, n(P ∩ Q) = 4.

Question 3:

In a group of 80 people, 30 like jogging, 20 like swimming and 9 like jogging and swimming both.

Find:

(a) how many like jogging only?

(b) how many like swimming only?

(c) how many like at least one of them?

(d) how many like none of them?

Solution:

Given that,

Total number of people in the group = 80

Let J be the set of people who like jogging, S be the set of people who like swimming.

Number of people like jogging n(J) = 30

Number of people like swimming n(S) = 20

Number of people who like jogging and swimming n(J ∩ S) = 9

(a)

The number of people who like jogging only means n(J – S)

n(J – S) = n(J) – n(J ∩ S)

= 30 – 9

= 21

So, 21 people like jogging only.

(b)

The number of people who like swimming only means n(S – J)

n(S – J) = n(S) – n(J ∩ S)

= 20 – 9

= 11

So, 11 people like only swimming.

(c)

The number of people who like at least jogging or swimming means n(J ∪ S)

n(J ∪ S) = n(J) + n(S) – n(J ∩ S)

= 20 + 30 – 9

= 50 – 9

= 41

Therefore, 41 people like at least one of them

(d)

The number of people who like none of them = Total number of people in the group – number of people who like at least one of them

= 80 – 41

= 39

Therefore, 39 people like none of them.

FAQs on Cardinal Properties of Sets

1. How do you find the cardinal number of a set?

The number of elements in a set is called the cardinal number of a set. The cardinal number for an empty or null set is always zero. If the elements of a set A are {1, 2, 41, 55, 68, 78, 90, 52}, then the cardinal number for A is 8 and it is represented as n(A) = 8.

2. What is the purpose of sets?

The purpose of sets is to collect related objects together. Sets are important everywhere in mathematics because it uses and refers sets in some or other way.

3. What are the various cardinal properties of sets?

The different cardinal properties of sets are n(A ∪ B) = n(A) + n(B) – n(A ∩ B), n(A – B) = n(A) – n(A ∩ B) and if A ∩ B = ф , then n(A ∪ B) = n(A) + n(B).

4. What is a Cardinal Set?

The number of distinct members of a set is called the cardinal set. The cardinality of a set A is represented as n(A), it counts the number of different elements in a set. We can find the cardinality only for the finite sets.

Venn Diagrams Examples with Solutions | How to Draw Venn Diagrams for Set Operations?

Concept of Venn Diagrams

A Venn diagram is a graph that has closed curves especially circles to represent a set. In general, the sets are the collection of well-defined objects. The Venn diagram shows the relationship bets the sets. Circles overlap means they have common things. Venn diagrams are now used as illustrations in business and in many academic fields. Get the definition of the Venn diagram and diagrams for set operations in the following sections.

What is Venn Diagram?

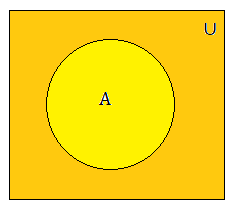
A Venn diagram is a diagram used to represent the relations between various sets. A Venn diagram can be represented by any closed figure, it can be a circle or polygon. Generally, we use circles to represent one set.

Venn Diagrams

In the above diagram, circle A represents the set and the rectangle ∪ represents the universal set. It is a Venn diagram of one set. You can also draw a Venn diagram for different sets and to represent their relationships.

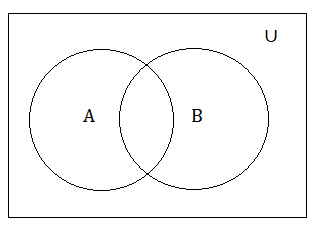
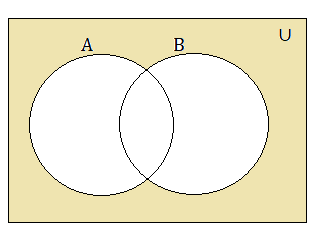
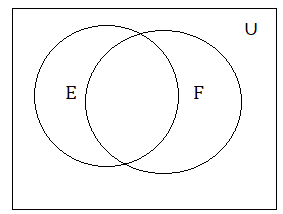
The Venn diagram for two sets is provided here.

Venn Diagrams 7

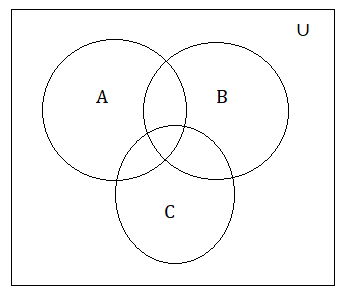
The Venn diagram for three sets is given here.

Venn Diagrams 8

How to Draw a Venn Diagram?

Follow the below-mentioned rules and instructions to draw a Venn diagram for the sets easily.

  • At first, you need to know the universal set. Every set is the subset of the universal set which is denoted by U. It states that every other set will be inside the rectangle which represents the universal set.

Venn Diagrams for Set Operations

The various set of operations in the set theory are listed here.

  • Union of Sets
  • Intersection of Sets
  • Complement of sets
  • Difference of Sets

Let us have a look at the Venn diagrams for all the set operations.

Union of Two Sets

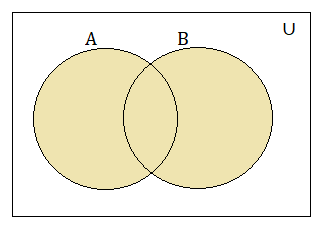
Union of two sets A and B are given as A ∪ B = {x: x ∈ A or x ∈ B}. Include all the elements of A and B to get the union.

Some of the properties of the union are

  • A ∪ B = B ∪ A
  • (A ∪ B) ∪ C = A ∪ (B ∪ C)
  • A ∪ Φ = A
  • A ∪ A = A
  • U ∪ A = U

The Venn diagram for A ∪ B is given here. The shaded region represents the result set.

Venn Diagrams 1

Complement of Sets

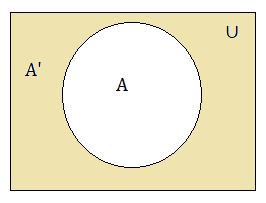
The complement of a set A is A’ which means {∪ – A} includes the elements of a universal set that not elements of set A.

The Venn diagram for A’ is provided below.

Venn Diagrams 2

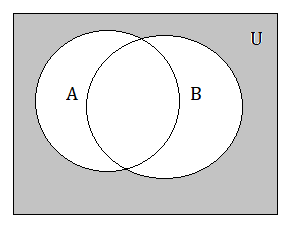
Complement of Union of Sets

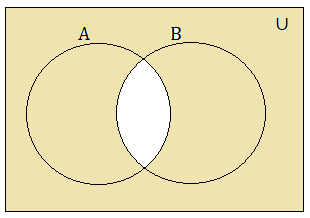
(A ∪ B)’ means the elements which are neither in set A nor in set B. The shaded region in the Venn diagram represents the complement of A union B.

Venn Diagrams 3

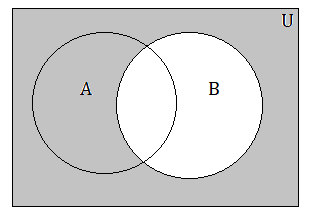
Complement of Intersection of Sets

(A ∩ B)’ means the elements of the universal set which are not common between two sets A and B. The shaded region of the diagram represents the complement of A intersection B.

Venn Diagrams 4

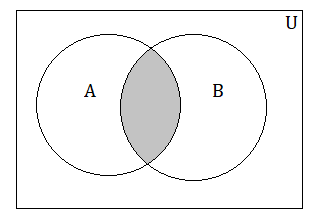
The Intersection of Two Sets

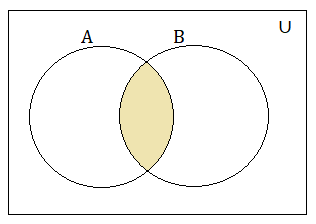
The intersection of two finite sets A and B is given as A ∩ B = {x: x ∈ A and x ∈ B}. Here, include the common elements of A and B.

venn diagrams 5

The properties of set intersection are

  • A ∩ B = B ∩ A
  • (A ∩ B) ∩ C = A ∩ (B ∩ C)
  • Φ ∩ A = Φ
  • U ∩ A = A
  • A ∩ A = A
  • A ∩ (B ∪ C) = (A ∩ B) ∪ (A ∩ C)
  • A ∪ (B ∩ C) = (A ∪ B) ∩ (A ∪ C)

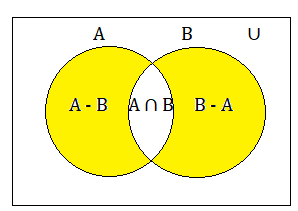
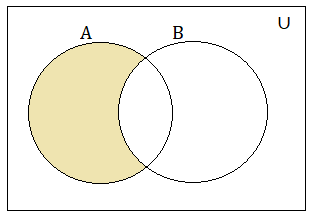
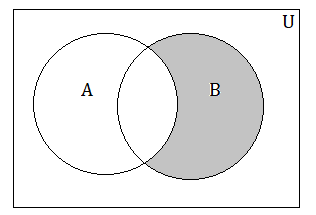
Difference Between Two Sets

The difference between two sets A and B is A – B. It represents the elements of A which are not in B. The shaded region in the diagram represents the difference between the two sets.

Venn Diagrams 6

Also, Read

Difference of Two SetsSetsRepresentation of a SetOperations on Sets
Pairs of SetsCardinal Number of a SetComplement of a SetStandard Sets of Numbers
Proof of De Morgan’s LawTypes of SetsUnion of SetsObjects Form a Set
Subsets of a Given SetIntersection of SetsBasic Concepts of SetsLaws of Algebra of Sets
Elements of a SetSubsetBasic Properties of SetsDifferent Notations in Sets

Venn Diagram Questions and Answers

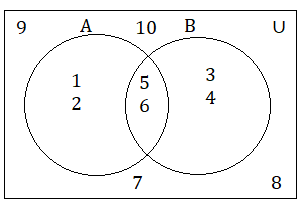
Question 1:

Read the Venn diagram and answer the following questions.

Venn Diagrams 9

(a) A, B

(b) A’, B’

(c) A ∪ B, A ∩ B

(d) B – A

Solution:

From the Venn diagram, we can say that

(a) A = {1, 2, 5, 6}

B = {3, 4, 5, 6}

(b) A’ = U – A

= {1, 2, 3, 4, 5, 6, 7, 8, 9, 10} – {1, 2, 5, 6}

= {3, 4, 7, 8, 9, 10}

B’ = U – B

= {1, 2, 3, 4, 5, 6, 7, 8, 9, 10} – {3, 4, 5, 6}

= {1, 2, 7, 8, 9, 10}

(c) A ∪ B = {1, 2, 5, 6} ∪ {3, 4, 5, 6}

= {1, 2, 3, 4, 5, 6}

A ∩ B = {1, 2, 5, 6} ∩ {3, 4, 5, 6}

= {5, 6}

(d) B – A = {3, 4, 5, 6} – {1, 2, 5, 6}

= {3, 4}

Question 2:

Draw Venn diagrams to show the relationship between the following pairs of sets.

(i) A = {All girls in the School}

B = {All girls in the class}

(ii) C = {First 10 multiples of 5}

D = {First 10 multiples of 3}

(iii) E = {x : x is an odd number, less than 20}

F = {x : x is a prime number, less than 20}

Solution:

(i) Venn Diagrams 11

(ii) The first 10 multiples of 5 are C = {5, 10, 15, 20, 25, 30, 35, 40, 45, 50}

The first 10 multiples of 3 are D = {3, 6, 9, 12, 15, 18, 21, 24, 27, 30}

Venn Diagrams 10

(iii) The set of odd numbers less than 20 are E = {1, 3, 5, 7, 9, 11, 13, 15, 17, 19}

The set of prime numbers less than 20 are F = {1, 2, 3, 5, 7, 11, 13, 17, 19}

Venn Diagrams 12

Question 3:

What set is represented by the shaded portion in the following Venn diagrams?

(a) Venn Diagrams 13

(b) Venn Diagrams 14

(c) Venn Diagrams 15

(d) Venn Diagrams 16

(e) Venn Diagrams 17

Solution:

The representation of sets for the shaded regions is given here.

(a) A U B means both sets are shaded.

(A U B)’

(b) B is a proper subset of A

B ⊂ A.

(c) A ∩ B’

(d) B – A

(e) A ∩ B

Frequently Asked Questions on Venn Diagrams

1. What is a Venn Diagram?

A Venn diagram is the pictorial representation of sets. It shows the relationship between two or more mathematical sets.

2. If a Venn diagram shows two circles which do not touch each other, then what does it mean?

In a Venn diagram, if two circles in a rectangle show that two independent sets. And those sets don’t intersect at any point means they are disjoint sets.

3. What are the applications of a Venn Diagram?

Venn Diagrams are used to describe how items relate to each other against a universe, environment or data set. A Venn diagram can be used to compare two companies within the same industry by illustrating the products.

4. Why are they called Venn Diagrams?

They are called Venn Diagrams because those diagrams were developed by John Venn an English logician. So, in the name of the logician, they are called Venn Diagrams.

5. How do you read a Venn Diagram?

A Venn diagram can be read by all circles in the whole diagram. Each circle is a set. The portions of circles overlap mean that area is common amongst the different elements. if portions do not overlap means unique elements.