Eureka Math Grade 4 Module 7 Lesson 6 Answer Key

Engage NY Eureka Math 4th Grade Module 7 Lesson 6 Answer Key

Eureka Math Grade 4 Module 7 Lesson 6 Problem Set Answer Key

Question 1.
Determine the following sums and differences. Show your work.
a. 3 qt + 1 qt = _______ gal
b. 2 gal 1 qt + 3 qt = _______ gal
c. 1 gal – 1 qt = _______ qt
d. 5 gal – 1 qt = _______ gal _______ qt
e. 2 c + 2 c = _______ qt
f. 1 qt 1 pt + 3 pt = _______ qt
g. 2 qt – 3 pt = _______ pt
h. 5 qt – 3 c _______ qt _______ c
Answer:

a. 3 qt + 1 qt = 1 gal
b. 2 gal 1 qt + 3 qt = 3 gal
c. 1 gal – 1 qt = 3 qt
d. 5 gal – 1 qt = 4 gal 3 qt
e. 2 c + 2 c = 1 qt
f. 1 qt 1 pt + 3 pt = 2 qt
g. 2 qt – 3 pt = 1 pt
h. 5 qt – 3 c = 4 qt 1 c

Question 2.
Find the following sums and differences. Show your work.
a. 6 gal 3 qt + 3 qt = _______ gal _______ qt
b. 10 gal 3 qt + 3 gal 3 qt = _______ gal _______ qt
c. 9 gal 1 pt – 2 pt = _______ gal _______ pt
d. 7 gal 1 pt – 2 gal 7 pt = _______ gal _______ pt
e. 16 qt 2 c + 4 c = _______ qt _______ c
6 gal 5 pt + 3 gal 3 pt = _______ gal _______ pt
Answer:

a. 6 gal 3 qt + 3 qt = 7 gal 2 qt
b. 10 gal 3 qt + 3 gal 3 qt = 14 gal 2 qt
c. 9 gal 1 pt – 2 pt = 8 gal 7 pt
d. 7 gal 1 pt – 2 gal 7 pt = 4 gal 2 pt
e. 16 qt 2 c + 4 c = 17 qt 2 c
6 gal 5 pt + 3 gal 3 pt = 10 gal 0 pt

Question 3.
The capacity of a pitcher is 3 quarts. Right now, it contains 1 quart 3 cups of liquid. How much more liquid can the pitcher hold?
Answer:

Given that,

The capacity of a pitcher = 3 quarts

Which means, 2 qt+4 cup

Also given, the pitcher contains 1 quart 3 cups of liquid

Now, 3 qt – 1 quart 3 cups =

1 qt 1 c

Therefore, the pitcher can hold 1 quart 1 cup more liquid.

Question 4.
Dorothy follows the recipe in the table to make her grandma’s cherry lemonade.
a. How much lemonade does the recipe make?

Cherry Lemonade

Ingredient

Amount

Lemon Juice5 pints
Sugar Syrup2 cups
Water1 gallon 1 quart
Cherry Juice3 quarts

Answer:

Give, 5 pints of lemon juice

2 cups = 2 pints of sugar syrup

1 gallon 1 quart = 10 pints of water

3 quarts = 6 pints of cherry juice

Total : 5 + 2 +10 +6 = 22

Therefore,the recipe makes 22 pints or 2 gallons 3 quarts of lemonade.

b. How many more cups of water could Dorothy add to the recipe to make an exact number of gallons of lemonade?
Answer:

The number of pints lemonade make = 22 pints or 2 gallons 3 quarts

1 qt = 4 cups

2 gallons 3 quarts + 1 qt = 3 gal

Therefore, Dorothy need to add 4 cups to make an exact number of gallons of lemonade.

Eureka Math Grade 4 Module 7 Lesson 6 Exit Ticket Answer Key

Question 1.
Find the following sums and differences. Show your work.
a. 7 gal 2 qt + 3 gal 3 qt = _______ gal _______ qt
b. 9 gal 1 qt – 5 gal 3 qt = _______ gal _______ qt
Answer:

a. 7 gal 2 qt + 3 gal 3 qt = 11 gal 1 qt
b. 9 gal 1 qt – 5 gal 3 qt = 3 gal 2 qt

Question 2.
Jason poured 1 gallon 1 quart of water into an empty 2-gallon bucket. How much more water can be added to reach the bucket’s 2-gallon capacity?
Answer:

Given that, 1 gallon 1 quart water is poured into 2 gallon bucket

2 gal – 1 gal 1 quart

= 1 gal 1 qt

We , know that, 1 gal = 4 qt

So, 4 qt – 1 qt = 3 qt

Therefore, Jason need to add 3 quarts more water to reach the bucket’s 2 gallon capacity.


Eureka Math Grade 4 Module 7 Lesson 6 Homework Answer Key

Question 1.
Determine the following sums and differences. Show your work.
a. 5 qt + 3 qt = _______ gal
b. 1 gal 2 qt + 2 qt = _______ gal
c. 1 gal – 3 qt =_______ qt
d. 3 gal – 2 qt = _______ gal _______ qt
e. 1 c + 3 c =_______ qt
f. 2 qt 3 c + 5 c = _______ qt
g. 1 qt – 1 pt = _______ pt
h. 6 qt – 5 pt = _______ qt _______ pt
Answer:

a. 5 qt + 3 qt = 2 gal
b. 1 gal 2 qt + 2 qt = 2 gal
c. 1 gal – 3 qt = 1 qt
d. 3 gal – 2 qt = 2 gal 2 qt
e. 1 c + 3 c = 1 qt
f. 2 qt 3 c + 5 c = 4 qt
g. 1 qt – 1 pt = 1 pt
h. 6 qt – 5 pt = 3 qt 1 pt

Question 2.
Find the following sums and differences. Show your work.
a. 4 gal 2 qt + 3 qt = _______ gal _______ qt
b. 12 gal 2 qt + 5 gal 3 qt = _______ gal _______ qt
c. 7 gal 2 pt – 3 pt = _______ gal _______ pt
d. 11 gal 3 pt – 4 gal 6 pt = _______ gal _______ pt
e. 12 qt 5 c + 6 c = _______ qt _______ c
f. 8 gal 6 pt + 5 gal 4 pt = _______ gal _______ pt
Answer:

a. 4 gal 2 qt + 3 qt = 5 gal 1 qt
b. 12 gal 2 qt + 5 gal 3 qt = 18 gal 1 qt
c. 7 gal 2 pt – 3 pt = 6 gal 7 pt
d. 11 gal 3 pt – 4 gal 6 pt = 6 gal 5 pt
e. 12 qt 5 c + 6 c = 14 qt 3 c
f. 8 gal 6 pt + 5 gal 4 pt = 14 gal 2 pt

Question 3.
The capacity of a bucket is 5 gallons. Right now, it contains 3 gallons 2 quarts of liquid. How much more liquid can the bucket hold?
Answer:

Given that ,

The quantity of the bucket = 5 gallons

The the quantity of water the bucket contains now = 3 gallons 2 quarts

3 gal 2 quarts + 2 qt = 4 gallons

4 gal + 1 gal = 5 gallons

Therefore, the bucket can holds 1 gal 2 qt of more water.

Question 4.
Grace and Joyce follow the recipe in the table to make a homemade bubble solution.
a. How much solution does the recipe make?

Homemade Bubble Solution

Ingredient

Amount

Water2 gallons 3 pints
Dish Soap2 quarts 1 cup
Corn Syrup2 cups

Answer:

Given

2 gallons 3 pints of water

2 quarts 1 cup of dish soap and

2 cups of corn syrup

Total :

2 gal 3 pt + 2 qt 1 c + 2 c = 3 gallons 1 cup

Therefore, the recipe make 3 gal 1 cup of solution.

b. How many more cups of solution would they need to fill a 4-gallon container?
Answer:

The quantity of the recipe = 3 gal 1 cup

We know that, 1 gal = 4 qt

and 1 qt = 2 pt which means, 4 x 2 = 8 pt

1 pt = 2 cups which means, 8 x 2 = 16

Therefore, 3 gal 1 cup + 15 more cups can make 4 gallons of the recipe.

Eureka Math Grade 4 Module 7 Lesson 5 Answer Key

Engage NY Eureka Math 4th Grade Module 7 Lesson 5 Answer Key

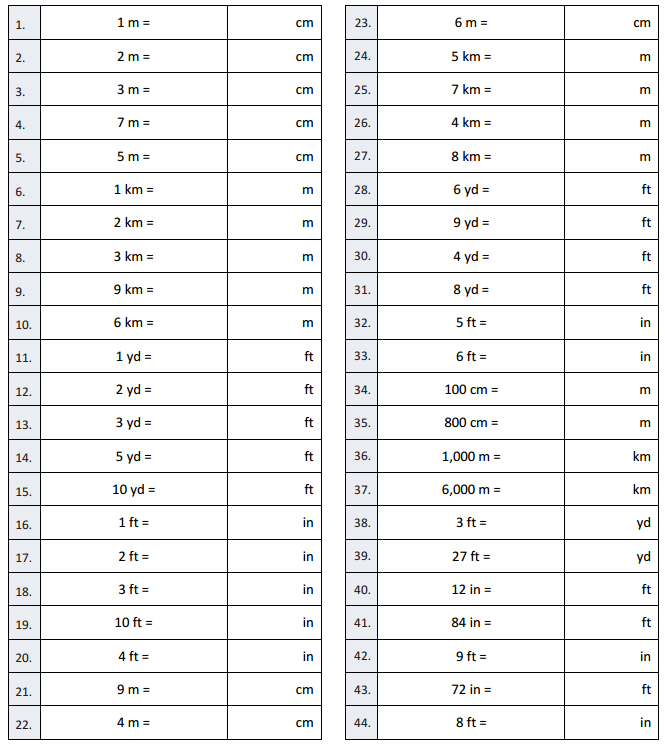
Eureka Math Grade 4 Module 7 Lesson 5 Sprint Answer Key

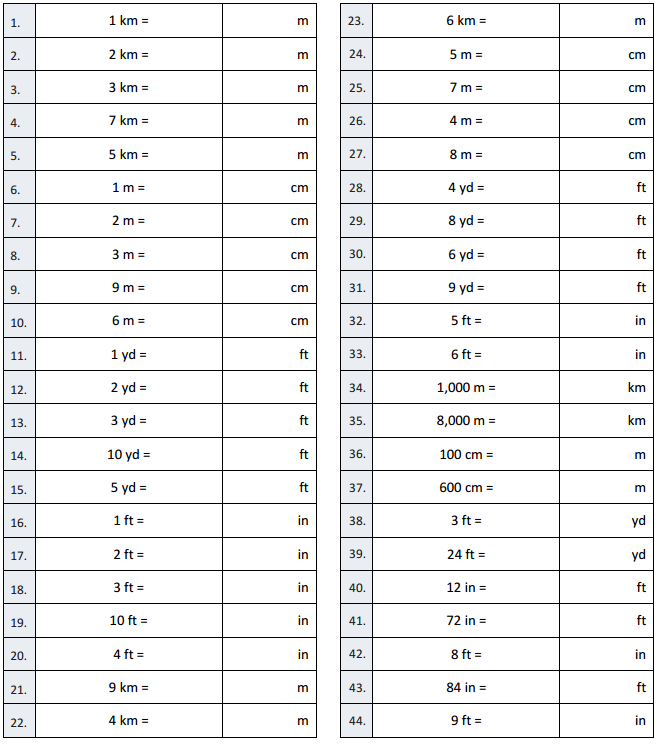
A
Convert Length Units
Engage NY Math 4th Grade Module 7 Lesson 5 Sprint Answer Key 1
Question 1.
1 km =
Answer:
1000 m

Question 2.
2 km =
Answer:
2000 m

Question 3.
3 km =
Answer:
3000 m

Question 4.
7 km =
Answer:
7000 m

Question 5.
5 km =
Answer:
5000 m

Question 6.
1 m =
Answer:
100 cm

Question 7.
2 m =
Answer:
200 cm

Question 8.
3 m =
Answer:
300 cm

Question 9.
9 m =
Answer:
900 cm

Question 10.
6 m =
Answer:
600 cm

Question 11.
1 yd =
Answer:
3 ft

Question 12.
2 yd =
Answer:
6 ft

Question 13.
3 yd =
Answer:
9 ft

Question 14.
10 yd =
Answer:

30 ft

Question 15.
5 yd =
Answer:
15 ft

Question 16.
1 ft =
Answer:
12 in

Question 17.
2 ft =
Answer:
24 in

Question 18.
3 ft =
Answer:
36 in

Question 19.
10 ft =
Answer:
120 in

Question 20.
4 ft =
Answer:
48 in

Question 21.
9 km =
Answer:
9000 m

Question 22.
4 km =
Answer:
4000 m

Question 23.
6 km =
Answer:
6000 m

Question 24.
5 m =
Answer:
500 cm

Question 25.
7 m =
Answer:
700 cm

Question 26.
4 m =
Answer:
400 cm

Question 27.
8 m =
Answer:
800 cm

Question 28.
4 yd =
Answer:
12 ft

Question 29.
8 yd =
Answer:
24 ft

Question 30.
6 yd =
Answer:
18 ft

Question 31.
9 yd =
Answer:
27 ft

Question 32.
5 ft =
Answer:
60 in

Question 33.
6 ft =
Answer:
72 in

Question 34.
1,000 m =
Answer:
1 km

Question 35.
8,000 m =
Answer:
8 km

Question 36.
100 cm =
Answer:
1 m

Question 37.
600 cm =
Answer:
6 m

Question 38.
3 ft =
Answer:
1 yd

Question 39.
24 ft =
Answer:
8 yd

Question 40.
12 in =
Answer:
1 ft

Question 41.
72 in =
Answer:
6 ft

Question 42.
8 ft =
Answer:
96 in

Question 43.
84 in =
Answer:
7 ft

Question 44.
9 ft =
Answer:
108 in

B
Convert Length Units
Engage NY Math 4th Grade Module 7 Lesson 5 Sprint Answer Key 2
Question 1.
1 m =
Answer:
100 cm

Question 2.
2 m =
Answer:
200 cm

Question 3.
3 m =
Answer:
300 cm

Question 4.
7 m =
Answer:
700 cm

Question 5.
5 m =
Answer:
500 cm

Question 6.
1 km =
Answer:
1000 m

Question 7.
2 km =
Answer:
2000 m

Question 8.
3 km =
Answer:
3000 m

Question 9.
9 km =
Answer:
9000 m

Question 10.
6 km =
Answer:
6000 m

Question 11.
1 yd =
Answer:
3 ft

Question 12.
2 yd =
Answer:
6 ft

Question 13.
3 yd =
Answer:
9 ft

Question 14.
5 yd =
Answer:
15 ft

Question 15.
10 yd =
Answer:
30 ft

Question 16.
1 ft =
Answer:
12 in

Question 17.
2 ft =
Answer:
24 in

Question 18.
3 ft =
Answer:
36 in

Question 19.
10 ft =
Answer:
120 in

Question 20.
4 ft =
Answer:
48 in

Question 21.
9 m =
Answer:
900 cm

Question 22.
4 m =
Answer:
400 cm

Question 23.
6 m =
Answer:
600 cm

Question 24.
5 km =
Answer:
5000 m

Question 25.
7 km =
Answer:
7000 m

Question 26.
4 km =
Answer:
4000 m

Question 27.
8 km =
Answer:
8000 m

Question 28.
6 yd =
Answer:
18 ft

Question 29.
9 yd =
Answer:
27 ft

Question 30.
4 yd =
Answer:
12 ft

Question 31.
8 yd =
Answer:
24 ft

Question 32.
5 ft =
Answer:
60 in

Question 33.
6 ft =
Answer:
72 in

Question 34.
100 cm =
Answer:
1 m

Question 35.
800 cm =
Answer:
8 m

Question 36.
1000 m =
Answer:
1 km

Question 37.
6000 m =
Answer:
6 km

Question 38.
3 ft =
Answer:
1 yd

Question 39.
27 ft =
Answer:
9 yd

Question 40.
12 in =
Answer:
1 ft

Question 41.
84 in =
Answer:
7 ft

Question 42.
9 ft =
Answer:
108 in

Question 43.
72 in =
Answer:
6 ft

Question 44.
8 ft =
Answer:
96 in

Eureka Math Grade 4 Module 7 Lesson 5 Problem Set Answer Key

Question 1.
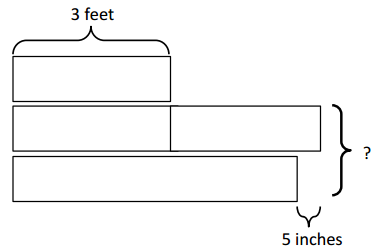
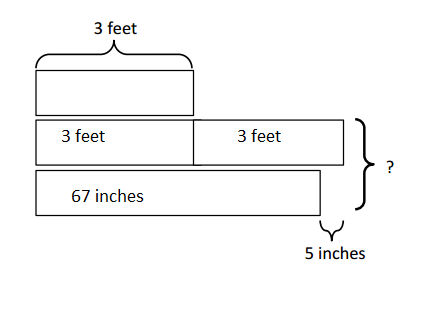
a. Label the rest of the tape diagram below. Solve for the unknown.
Engage NY Math Grade 4 Module 7 Lesson 5 Problem Set Answer Key 1

3 feet + 3 feet = 6 feet

1 feet = 12 inches

6 feet = 6 x 12 = 72 inches

72 inches – 5 inches = 67 inches

b. Write a problem of your own that could be solved using the diagram above.
Answer:

Maria, knitted a cloth of length 3 feet. Mark knitted a cloth as twice as long as Maria. Jacob knitted a cloth which is 5 inches shorter than Mark. Calculate the length of Mark and Jacob altogether

Question 2.
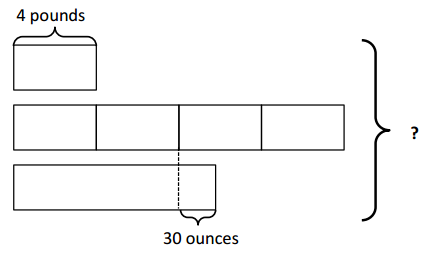
Create a problem of your own using the diagram below, and solve for the unknown.
Engage NY Math Grade 4 Module 7 Lesson 5 Problem Set Answer Key 2
Answer:

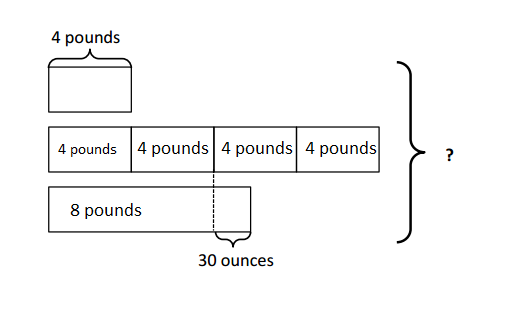
Harry have 3 dogs. First dog weighs 4 pounds. Second dog weighs 4 times more than the first dog and the third dog weighs 30 ounces more than the half of second dog. Calculate the total weight of three dogs.

4 pounds x 7 = 28 pounds

30 ounces = 1 pound 14 ounces

Total : 28 pounds + 1 pound 14 ounces

= 29 pounds 14 ounces


Eureka Math Grade 4 Module 7 Lesson 5 Exit Ticket Answer Key

Caitlin ran 1,680 feet on Monday and 2,340 feet on Tuesday. How many yards did she run in those two days?
Answer:

The total distance Caitlin ran on Monday = 1680

The total distance she ran on Tuesday = 2, 340

Total : 1680 + 2340

= 4,020

We know that, 1 yard = 3 feet

Now, 4020 / 3 = 1340

Therefore, Caitlin ran 1340 yards in two days.

Eureka Math Grade 4 Module 7 Lesson 5 Homework Answer Key

Draw a tape diagram to solve the following problems.
Question 1.
Timmy drank 2 quarts of water yesterday. He drank twice as much water today as he drank yesterday. How many cups of water did Timmy drink in the two days?
Answer:

The amount of water he drank today = 2 quarts

1 quart = 4 cups

So, 2 quarts = 2 x 4 = 8 cups

Also given, he drank twice as much water today as he drank yesterday

Now, 4 quarts = 4 x 4 = 16

Total : 8 cups + 16 cups = 24 cups

Therefore, Timmy drank 24 cups of water in two days altogether.

Question 2.
Lisa recorded a 2-hour television show. When she watched it, she skipped the commercials. It took her 84 minutes to watch the show. How many minutes did she save by skipping the commercials?
Answer:

The time period of television show = 2 hours

We know that, 1 hour = 60 minutes

2 hours = 2 x 60 = 120 minutes

The time period of commercials Lisa skipped= 84 minutes

Now, 120 minutes – 84 minutes = 36 minutes

Therefore, Lisa saved 36 minutes.

Question 3.
Jason bought 2 pounds of cashews. Sarah ate 9 ounces. David ate 2 ounces more than Sarah. How many ounces were left in Jason’s bag of cashews?
Answer:

The amount of cashews Jason bought = 2 pounds

2 pounds = 2 x 16 = 32 ounces

The amount of cashews Sarah ate = 9

The amount of cashews David ate is 2 ounces more than Sarah

That is 9 + 2 = 11

Total cashews they ate all together = 9 + 11 = 20

Now,

32 – 20 = 12

Therefore, 12 ounces of cashews were left in Jason bag

Question 4.
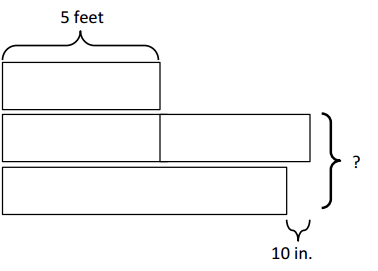
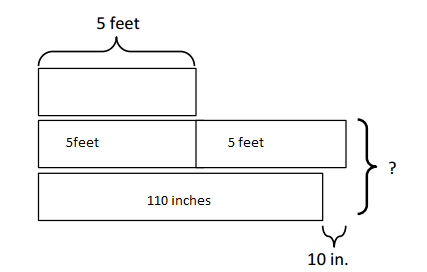
a. Label the rest of the tape diagram below. Solve for the unknown.
Eureka Math Grade 4 Module 7 Lesson 5 Homework Answer Key 1

5 feet + 5 feet = 10 feet

1 feet = 12 inches

10 feet = 10 x 12 = 120 inches

Now, 120 – 10 = 110 inches.

b. Write a problem of your own that could be solved using the diagram above.
Answer:

Harry, Henry and Ron each throw a stone. Harry stone flies 5 feet. Henry’s stone flies twice as far as Harry’s stone. Ron’s stone flies 10 inches shorter than Henry. Calculate the total distance flown by Henry and Ron?

Question 5.
Create a problem of your own using the diagram below, and solve for the unknown.
Eureka Math Grade 4 Module 7 Lesson 5 Homework Answer Key 2
Answer:

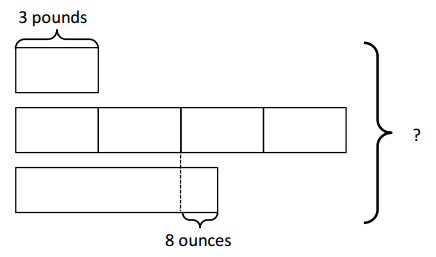
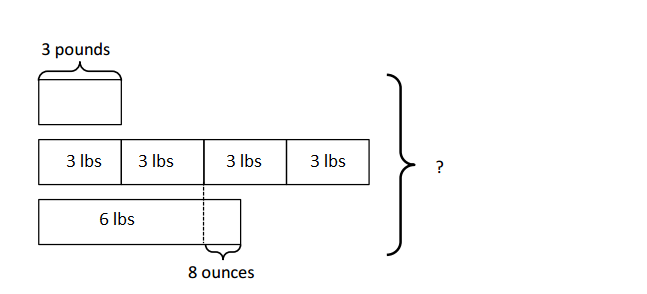
Leo weight = 3 pounds

Bailey weight = 4 x 3 = 12 pounds

Rio weight = 6 pounds 8 ounces

Total :

3 pounds + 12 pounds + 6 pounds 8 ounces

= 21 pounds 8 ounces .

I have 3 cats. Leo weighs 3 pounds. Bailey weighs 4 times as much as Leo. Rio weighs 10 ounces more than the half of Bailey. Calculate the total weight of the three cats.


Eureka Math Grade 4 Module 7 Lesson 4 Answer Key

Engage NY Eureka Math 4th Grade Module 7 Lesson 4 Answer Key

Eureka Math Grade 4 Module 7 Lesson 4 Problem Set Answer Key

Use RDW to solve the following problems.
Question 1.
Beth is allowed 2 hours of TV time each week. Her sister is allowed 2 times as much. How many minutes of TV can Beth’s sister watch?
Answer: 240 minutes

Explanation :

1 hour= 60 minutes

Number of minutes = Number of hours x 60

2 x 60 = 120 minutes

Given, Beth’s sister is allowed 2 as much =

120 x 2 = 240 minutes

Therefore, Beth’s sister can watch TV for 240 minutes i.e, 4 hours

Question 2.
Clay weighs 9 times as much as his baby sister. Clay weighs 63 pounds. How much does his baby sister weigh in ounces?
Answer: 112 ounces

Explanation :

1 pound = 16 ounces

Which means, 63 pounds = 63 x 16 = 1008 ounces

Given that, Clay weighs 9 times as much as his baby sister

1008 / 9 = 112

Therefore, His baby sister weight 112 ounces.

Question 3.
Helen has 4 yards of rope. Daniel has 4 times as much rope as Helen. How many more feet of rope does Daniel have compared to Helen?
Answer: 36 feet

Explanation :

1 yard = 3 feet

Which means, 4 x 3 = 12

Given that, Daniel has 4 times as much rope as Helen

12 x 4 = 48 feet

Now, 48 – 12 = 36

Therefore, Daniel has 36 feet more than Helen.

Question 4.
A dishwasher uses 11 liters of water for each cycle. A washing machine uses 5 times as much water as a dishwasher uses for each load. Combined, how many millilitres of water are used for 1 cycle of each machine?
Answer: 66,000

Explanation:

1 litre = 1000 millilitres

11 litres = 1000 x 11 = 11,000

Given that, a washing machine uses 5 times as much water as a dishwasher

11,000 x 5 = 55,000

Combined, The number of millilitres of water both the machines used for 1 cycle

11,000 + 55,000 = 66,000 millilitres.

Question 5.
Joyce bought 2 pounds of apples. She bought 3 times as many pounds of potatoes as pounds of apples. The melons she bought were 10 ounces lighter than the total weight of the potatoes. How many ounces did the melons weigh?
Answer: 86 ounces

Explanation :

1 pound = 16 ounces

Which means, 2 pounds of apples = 2 x 16 =32 ounces

Given that,

She bought 3 times as many of potatoes as pounds of apples

3 x 32 ounces = 96 ounces

Also given,

The melons she bought were 10 ounces lighter than the total weight of potatoes

So, 96 – 10 = 86 ounces

Therefore, The weight of melons = 86 ounces

Eureka Math Grade 4 Module 7 Lesson 4 Exit Ticket Answer Key

Use RDW to solve the following problem.
Brian has a melon that weighs 3 pounds. He cut it into six equal pieces. How many ounces did each piece weigh?
Answer: 8 ounces

Explanation:

1 pound = 16 ounces

Which means, 3 pounds = 16+16+16 = 48 ounces

Given that, melon is cut into 6 equal parts

So, 48 divided by 6

48 / 6 = 8

Therefore, each piece weighs 8 ounces.

Eureka Math Grade 4 Module 7 Lesson 4 Homework Answer Key

Use RDW to solve the following problems.
Question 1.
Sandy took the train to New York City. The trip took 3 hours. Jackie took the bus, which took twice as long. How many minutes did Jackie’s trip take?
Answer: 360 hours

Explanation :

1 hour = 60 minutes

Given that, The time took for sandy’s trip by train = 3 hours

Number of minutes= number of hours x 60

3 x 60 = 180

Also given, By bus,Jackie’s trip time is twice than Sandy’s trip

180 x 2 = 360

Therefore, the time taken for Jackie’s trip = 360 minutes.

Question 2.
Coleton’s puppy weighed 3 pounds 8 ounces at birth. The vet weighed the puppy again at 6 months, and the puppy weighed 7 pounds. How many ounces did the puppy gain?
Answer: 56 ounces

Explanation :

Initial weight of the puppy = 3 pounds 8 ounces

1 pound = 16 ounces

3 pounds = 16+16+16 = 48 ounces

Total initial weight : 48 + 8 = 56

Given that, The weight of the puppy after 6 months = 7 pounds

Which means, 7 x 16 = 112

The weight gained by puppy =

112 – 56 = 56

Therefore, the puppy gained 56 ounces.

Question 3.
Jessie bought a 2-liter bottle of juice. Her sister drank 650 millilitres. How many millilitres were left in the bottle?
Answer:

1 litre = 1000 millilitres

Which means, 2 litres = 1000+1000 = 2000 millilitres

Given that her sister drank 650 millilitres

Now, the quantity of leftover water =

2000 – 650 = 1350

Therefore, The number of millilitres were left in bottle = 1350 millilitres.

Question 4.
Hudson has a chain that is 1 yard in length. Myah’s chain is 3 times as long. How many feet of chain do they have in all?
Answer: 12 feet

Explanation :

1 yard = 3 feet

Given that, Myah’s chain is 3 times long than Hudson

So, 1 x 3 = 3 yards

3 yards = 3+ 3+ 3 = 9  feet

The length of the chain they have in both :  3 + 9 = 12

Therefore,  12 feet of chain they have in all.

Question 5.
A box weighs 8 ounces. A shipment of boxes weighs 7 pounds. How many boxes are in the shipment?
Answer: 14

Given that,

Each box weighs 8 ounces

The total weight of shipment of boxes = 7 pounds

1 pound = 16 ounces

Which means, 7 pounds = 7 x 16 = 112 ounces

Now, the number of boxes in shipment : 112 / 8 =14

Therefore, total number of boxes in the shipment = 14

Question 6.
Tracy’s rain barrel has a capacity of 27 quarts of water. Beth’s rain barrel has a capacity of twice the amount of water as Tracy’s rain barrel. Trevor’s rain barrel can hold 9 quarts of water less than Beth’s barrel.
a. What is the capacity of Trevor’s rain barrel?
b. If Tracy, Beth, and Trevor’s rain barrels were filled to capacity, and they poured all of the water into a 30-gallon bucket, would there be enough room? Explain.
Answer:

Given,

The capacity of Tracy’s barrel = 27 quarts

The capacity of Beth’s rain barrel is twice the amount of Tracy

Which means, 27 + 27 = 54 quarts

a.

The capacity of Trevor’s rain barrel is 9 quarts less than Beth’s barrel

Which means, 54 – 9 = 45 quarts

Therefore, the capacity of Trevor’s rain barrel is 54 quarts.

b.

Total capacity of Tracy, Beth and Trevor is 27 + 54 + 45 = 126 quarts

According to given condition, if they are poured into 30 gallon bucket

Now, 1 gallon = 4 quarts

30 gallons = 30 x 4 = 120 quarts

Therefore, there is no enough room in the 30 gallons bucket because there will be a shortage of 6 quarts.

Eureka Math Grade 4 Module 7 Lesson 3 Answer Key

Engage NY Eureka Math 4th Grade Module 7 Lesson 3 Answer Key

Eureka Math Grade 4 Module 7 Lesson 3 Practice Sheet Answer Key

a.

Minutes

Seconds

160
2120
3180
4240
5300
6360
7420
8480
9540
10600

The rule for converting minutes to seconds is ______________

Number of minutes x 60 = Number of seconds

b.

Hours

Minutes

160
2120
3180
4240
5300
6360
7420
8480
9540
10600

The rule for converting hours to minutes is ____________

Number of hours x 60 = Number of minutes.

c.

Days

Hours

124
248
372
496
5120
6144
7168
8192
9216
10240

The rule for converting days to hours is ______________
Answer:

Number of days x 24 = Number of hours.

Eureka Math Grade 4 Module 7 Lesson 3 Problem Set Answer Key

Use RDW to solve Problems 1–2.
Question 1.
Courtney needs to leave the house by 8:00 a.m. If she wakes up at 6:00 a.m., how many minutes does she have to get ready? Use the number line to show your work.
Engage NY Math Grade 4 Module 7 Lesson 3 Problem Set Answer Key 1
Answer: 120 minutes

Explanation :

8 – 6 = 2 hours

1 hour = 60 minutes

2 hours = 2 x 60 = 120

So, Courtney have 120 minutes to get ready

Question 2.
Giuliana’s goal was to run a marathon in under 6 hours. What was her goal in minutes?
Answer: 360 minutes.

Explanation :

Number of minutes = Number of hours x 60

Number of hours = 6

So, 6 x 60 = 360

Therefore, Giuliana’s goal to rum a marathon in under 360 minutes.


Question 3.
Complete the following conversion tables and write the rule under each table.
a.

Hours

Minutes

160
3180
6360
10600
15900

The rule for converting hours to minutes and minutes to seconds is ___________

To calculate number of minutes,

Number of hours x 60 = Number of minutes

b.

Days

Hours

124
248
5120
7168
10240

The rule for converting days to hours is ____________
Answer:

To calculate number of hours,

Number of days x 24 = Number of hours.

Question 4.
Solve.
a. 9 hours 30 minutes = __________ minutes
b. 7 minutes 45 seconds = _______ seconds
c. 9 days 20 hours = __________ hours
d. 22 minutes 27 seconds = ______ seconds
e. 13 days 19 hours = __________ hours
f. 23 hours 5 minutes = _______ minutes
Answer:

a. 9 hours 30 minutes = 570 minutes
b. 7 minutes 45 seconds = 465 seconds
c. 9 days 20 hours = 236 hours
d. 22 minutes 27 seconds = 1,347 seconds
e. 13 days 19 hours = 331 hours
f. 23 hours 5 minutes = 1,385 minutes

Question 5.
Explain how you solved Problem 4(f).
Answer:

Given, 23 hours 5 minutes.

1 hour = 60 minutes

Number of minutes = Number of hours x 60

So, 23 x 60 = 1380

and 1380 + 5 = 1385

Therefore, 23 hours 5 minutes = 1350 minutes.

Question 6.
How many seconds are in 14 minutes 43 seconds?
Answer:

Given,

14 minutes 43 seconds

1 minutes = 60 seconds

Number of seconds = Number of minutes x 60

14 x 60 = 840 seconds

And 840 + 43 = 883 seconds

Therefore, 14 minutes 43 seconds = 883 seconds.

Question 7.
How many hours are there in 4 weeks 3 days?
Answer:

Given,

4 weeks 3 days

1 week = 7 days

So, 7 x 4 = 28 days

So, 28 + 3 = 31 days

1 day = 24 hours

Number of hours = Number of days x 24

31 x 24 = 744 hours

Therefore, 4 weeks 3 days = 744 hours

Eureka Math Grade 4 Module 7 Lesson 3 Exit Ticket Answer Key

The astronauts from Apollo 17 completed 3 spacewalks while on the moon for a total duration of 22 hours 4 minutes. How many minutes did the astronauts walk in space?
Answer:

Given,

22 hours 4 minutes is the total duration

1 hour = 60 minutes

Number of minutes = Number of hours x 60

So, 22 x 60 = 1,320

1320 + 4 = 1324

Therefore, 22 hours 4 minutes = 1324 minutes

So, The time duration required for astronaut to walk in space = 1324 minutes.


Eureka Math Grade 4 Module 7 Lesson 3 Homework Answer Key

Use RDW to solve Problems 1–2.
Question 1.
Jeffrey practiced his drums from 4:00 p.m. until 7:00 p.m. How many minutes did he practice? Use the number line to show your work.
Eureka Math Grade 4 Module 7 Lesson 3 Homework Answer Key 1
Answer: 180

Explanation :

7 – 4 = 3

1 hour = 60 minutes

Number of minutes = Number of hours x 60

3 x 60 = 180 minutes

Therefore, Jeffrey practiced his drums for 180 minutes.

Question 2.
Isla used her computer for 5 hours over the weekend. How many minutes did she spend on the computer?
Answer: 300 minutes

Explanation :

1 hour = 60 minutes

Number of minutes = Number of hours x 60

5 x 60 = 300

Therefore, Isla used her computer for 300 minutes

5 hours = 300 minutes.

Question 3.
Complete the following conversion tables and write the rule under each table.
a.

Hours

Minutes

160
2120
5300
9540
12720

The rule for converting hours to minutes is ________________

Number of minutes = Number of hours x 60

b.

Days

Hours

124
372
6144
8192
20480

The rule for converting days to hours is _________________
Answer:

Number of hours = number of days  x  24

Question 4.
Solve.
a. 10 hours 30 minutes = ________ minutes
b. 6 minutes 15 seconds = ________ seconds
c. 4 days 20 hours = ________ hours
d. 3 minutes 45 seconds = ________ seconds
e. 23 days 21 hours = ________ hours
f. 17 hours 5 minutes = ________ minutes
Answer:

a. 10 hours 30 minutes = 630 minutes
b. 6 minutes 15 seconds = 375 seconds
c. 4 days 20 hours = 116 hours
d. 3 minutes 45 seconds = 225 seconds
e. 23 days 21 hours = 573 hours
f. 17 hours 5 minutes = 1,025 minutes

Question 5.
Explain how you solved Problem 4(f).
Answer:

17 hours 5 minutes

1 hour = 60 minutes

Number of minutes = Number of hours x 60

17 x 60 = 1020

So, 1020 + 5 = 1025

Therefore, 17 hours 5 minutes = 1025 minutes

Question 6.
It took a space shuttle 8 minutes 36 seconds to launch and reach outer space. How many seconds did it take?
Answer:

Given, 8 minutes 36 seconds

1 minute = 60 seconds

Number of seconds = Number of minutes x 60

8 x 60 = 480 seconds

So, 480 + 8 = 488 seconds

8 minutes 36 seconds = 488 seconds.

Question 7.
Apollo 16’s mission lasted just over 1 week 4 days. How many hours are there in 1 week 4 days?
Answer:

Given,

1 week 4 days

1 week = 7 days

So, 7 + 4 = 11

1 day = 24 hours

Number of hours = number of days x 24

So, 11 x 24 = 264 hours

Therefore, 1 week 4 days = 264 hours.

Eureka Math Grade 4 Module 7 Lesson 2 Answer Key

Engage NY Eureka Math 4th Grade Module 7 Lesson 2 Answer Key

Eureka Math Grade 4 Module 7 Lesson 2 Core Fluency Practice Set A Answer Key

Practice Set A Part 1: Multi-Digit Addition Fluency
Question 1.
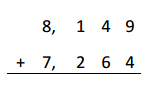
Engage NY Math 4th Grade Module 7 Lesson 2 Core Fluency Practice Set A Answer Key 1
Answer:


   8149
 +7264

_____________________

= 15,413

Question 2.
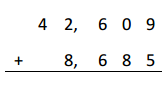
Engage NY Math 4th Grade Module 7 Lesson 2 Core Fluency Practice Set A Answer Key 2
Answer:

42,609 + 8685

=  51,294

Question 3.
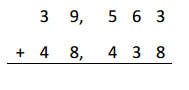
Engage NY Math 4th Grade Module 7 Lesson 2 Core Fluency Practice Set A Answer Key 3
Answer:

39,563 +

48, 438

= 88, 001

Question 4.
Engage NY Math 4th Grade Module 7 Lesson 2 Core Fluency Practice Set A Answer Key 4
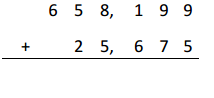
Answer:

658,199

+ 25675

= 683, 874

Question 5.
Engage NY Math 4th Grade Module 7 Lesson 2 Core Fluency Practice Set A Answer Key 5
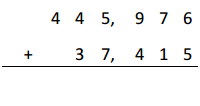
Answer:

445, 976

+  37, 415

= 483, 391

Question 6.
Engage NY Math 4th Grade Module 7 Lesson 2 Core Fluency Practice Set A Answer Key 6
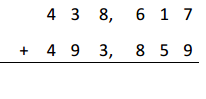
Answer:

438 , 617

+493, 859

= 932, 476

Practice Set A Part 2: Multi-Digit Addition Fluency
Question 1.
Engage NY Math 4th Grade Module 7 Lesson 2 Core Fluency Practice Set A Answer Key 7
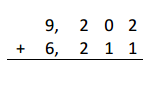
Answer:

9202

+ 6211

= 15413

Question 2.
Engage NY Math 4th Grade Module 7 Lesson 2 Core Fluency Practice Set A Answer Key 8
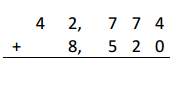
Answer:

42, 774

+8, 520

= 51,294

Question 3.
Engage NY Math 4th Grade Module 7 Lesson 2 Core Fluency Practice Set A Answer Key 9
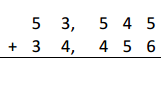
Answer:

53,545

+34,456

= 88,001

Question 4.
Engage NY Math 4th Grade Module 7 Lesson 2 Core Fluency Practice Set A Answer Key 10
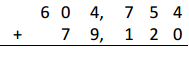
Answer:

604, 754

+  79,120

= 683,874

Question 5.
Engage NY Math 4th Grade Module 7 Lesson 2 Core Fluency Practice Set A Answer Key 11
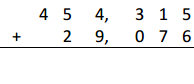
Answer:

454, 315

+   29, 076

=  483,391

Question 6.
Engage NY Math 4th Grade Module 7 Lesson 2 Core Fluency Practice Set A Answer Key 12
Answer:

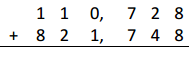
110, 728

+ 821, 748

= 932, 476

Eureka Math Grade 4 Module 7 Lesson 2 Core Fluency Practice Set B Answer Key

Practice Set B Part 1: Multi-Digit Subtraction Fluency
Question 1.
Engage NY Math 4th Grade Module 7 Lesson 2 Core Fluency Practice Set B Answer Key 13
Answer:

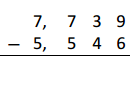
7,739

– 5, 546

= 2193

Question 2.
Engage NY Math 4th Grade Module 7 Lesson 2 Core Fluency Practice Set B Answer Key 14
Answer:

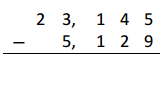
23, 145

–  5, 129

= 18,016

Question 3.
Engage NY Math 4th Grade Module 7 Lesson 2 Core Fluency Practice Set B Answer Key 15
Answer:

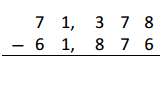
71, 378

– 61,876

=

Question 4.
Engage NY Math 4th Grade Module 7 Lesson 2 Core Fluency Practice Set B Answer Key 16
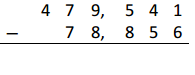
Answer:

479,541

–  78,856

= 400,685

Practice Set B Part 2: Multi-Digit Subtraction Fluency
Question 1.
Engage NY Math 4th Grade Module 7 Lesson 2 Core Fluency Practice Set B Answer Key 17
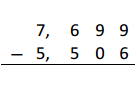
Answer:

7699

– 5506

= 2193

Question 2.
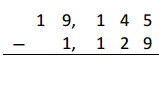
Engage NY Math 4th Grade Module 7 Lesson 2 Core Fluency Practice Set B Answer Key 18
Answer:

19,145

–   1, 129

=12,016

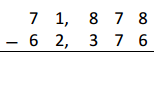
Question 3.
Engage NY Math 4th Grade Module 7 Lesson 2 Core Fluency Practice Set B Answer Key 19
Answer:

71, 878

+62, 376

= 9, 502

Question 4.
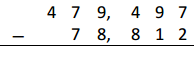
Engage NY Math 4th Grade Module 7 Lesson 2 Core Fluency Practice Set B Answer Key 20
Answer:

479, 497

– 78, 812

= 400, 685

Eureka Math Grade 4 Module 7 Lesson 2 Core Fluency Practice Set C Answer Key

Practice Set C Part 1: Multi-Digit Subtraction with Zeros Fluency
Question 1.
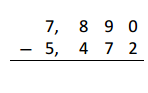
Engage NY Math 4th Grade Module 7 Lesson 2 Core Fluency Practice Set C Answer Key 21
Answer:

7890

-5472

=2418

Question 2.
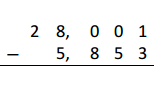
Engage NY Math 4th Grade Module 7 Lesson 2 Core Fluency Practice Set C Answer Key 22
Answer:

28,001

–   5, 853

= 22,148

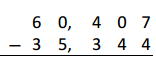
Question 3.
Engage NY Math 4th Grade Module 7 Lesson 2 Core Fluency Practice Set C Answer Key 23
Answer:

60, 407

– 35, 344

= 25,063

Question 4.
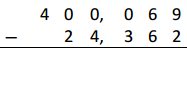
Engage NY Math 4th Grade Module 7 Lesson 2 Core Fluency Practice Set C Answer Key 24
Answer:

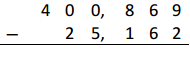
400, 069

–   24,362

= 375, 707

Practice Set C Part 2: Multi-Digit Subtraction with Zeros Fluency
Question 1.
Engage NY Math 4th Grade Module 7 Lesson 2 Core Fluency Practice Set C Answer Key 25
Answer:

7890

-5472

= 2418

Question 2.
Engage NY Math 4th Grade Module 7 Lesson 2 Core Fluency Practice Set C Answer Key 26
Answer:

28, 609

–   6461

= 22,148

Question 3.
Engage NY Math 4th Grade Module 7 Lesson 2 Core Fluency Practice Set C Answer Key 27
Answer:

60, 497

– 35,434

= 25,063

Question 4.
Engage NY Math 4th Grade Module 7 Lesson 2 Core Fluency Practice Set C Answer Key 28
Answer:

400, 869

–    25162

= 375,707

Eureka Math Grade 4 Module 7 Lesson 2 Core Fluency Practice Set D Answer Key

Practice Set D Part 1: Multi-Digit Addition and Subtraction Fluency
Question 1.
Engage NY Math 4th Grade Module 7 Lesson 2 Core Fluency Practice Set D Answer Key 29
Answer:

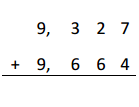
9327

+ 9664

= 18991

Question 2.
Engage NY Math 4th Grade Module 7 Lesson 2 Core Fluency Practice Set D Answer Key 30
Answer:

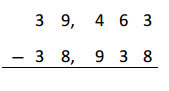
39,463

– 38938

= 00,525

Question 3.
Engage NY Math 4th Grade Module 7 Lesson 2 Core Fluency Practice Set D Answer Key 31
Answer:

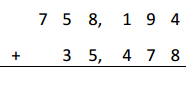
758, 194

+ 35,478

=793,672

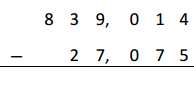
Question 4.
Engage NY Math 4th Grade Module 7 Lesson 2 Core Fluency Practice Set D Answer Key 32
Answer:

839,014

–  27075

= 811, 939

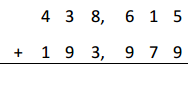
Question 5.
Engage NY Math 4th Grade Module 7 Lesson 2 Core Fluency Practice Set D Answer Key 33
Answer:

438, 615

+ 193,979

= 632,594

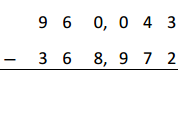
Question 6.
Engage NY Math 4th Grade Module 7 Lesson 2 Core Fluency Practice Set D Answer Key 34
Answer:

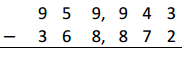
960, 043

-368,972

= 591,071

Practice Set D Part 2: Multi-Digit Addition and Subtraction Fluency
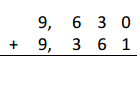
Question 1.
Engage NY Math 4th Grade Module 7 Lesson 2 Core Fluency Practice Set D Answer Key 35
Answer:

9630

+ 9361

=18,991

Question 2.
Engage NY Math 4th Grade Module 7 Lesson 2 Core Fluency Practice Set D Answer Key 36
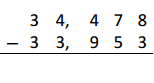
Answer:

34, 478

– 33, 953

= 00,525

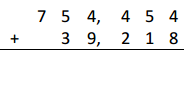
Question 3.
Engage NY Math 4th Grade Module 7 Lesson 2 Core Fluency Practice Set D Answer Key 37
Answer:

754 , 454

+  39, 218

= 793, 672

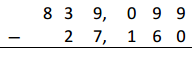
Question 4.
Engage NY Math 4th Grade Module 7 Lesson 2 Core Fluency Practice Set D Answer Key 38
Answer:

839, 099

–  27, 160

= 811,939

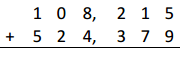
Question 5.
Engage NY Math 4th Grade Module 7 Lesson 2 Core Fluency Practice Set D Answer Key 39
Answer:

108,215

– 524,379

= 632,584

Question 6.
Engage NY Math 4th Grade Module 7 Lesson 2 Core Fluency Practice Set D Answer Key 40
Answer:

959 , 943

– 368, 872

= 591,071

Eureka Math Grade 4 Module 7 Lesson 2 Practice Sheet Answer Key

a.

Gallons

Quarts

14
28
312
416
520
624
728
832
936
1040

The rule for converting gallons to quarts is ______________

To convert gallons into quarts,

The number of gallons x 4 = number of quarts

b.

Quarts

Pints

12
24
36
48
510
612
714
816
918
1020

The rule for converting quarts to pints is ________________

To convert, quarts into pints,

The number of quarts x 2 = number of pints

c.

Pints

Cups

12
24
36
48
510
612
714
816
918
1020

The rule for converting pints to cups is ________________

To convert pints into cups

Number of pints x 2 = number of cups.

d.
1 gallon = ________ pints
1 quart = ________ cups
1 gallon = ________ cups

Answer :

1 gallon = 8 pints

1 quart =  4 cups
1 gallon = 16 cups

Eureka Math Grade 4 Module 7 Lesson 2 Problem Set Answer Key

Use RDW to solve Problems 1–3.
Engage NY Math Grade 4 Module 7 Lesson 2 Problem Set Answer Key 1
Question 1.
Susie has 3 quarts of milk. How many pints does she have?
Answer:

1 quarts = 2 pints

So, 3 quarts = 3 x 2 = 6

Therefore, Susie has 3 pints

Question 2.
Kristin has 3 gallons 2 quarts of water. Alana needs the same amount of water but only has 8 quarts. How many more quarts of water does Alana need?
Answer:

Given that, Kristin has 3 gallon 2 quarts of water

1 gallon = 4 quarts

3 gallons 2 quarts = 14 quarts

Also given, Alana needs same amount of water but only has 8 quarts

So, 14 quarts – 8 quarts = 6 quarts

Therefore, Alana needs 6 more quarts.

Question 3.
Leonard bought 4 liters of orange juice. How many milliliters of juice does he have?
Answer:

1 litre = 1,000 millilitres

4 litres = 4 x 1000 = 4000 millilitres

Therefore, Leonard has 4000 millilitres of juice.

Question 4.
Complete the following conversion tables and write the rule under each table.
a.

GallonsQuarts
14
312
520
1040
1352

The rule for converting gallons to quarts is ___________

To convert, gallons x quarts

Number of gallons x 4 = number of quarts

b.

QuartsPints
12
36
510
1020
1326

The rule for converting quarts to pints is ___________
Answer:

To convert quarts into pints ,

Number of quarts x 2 = number of pints

Question 5.
Solve.
a. 8 gallons 2 quarts = __________ quarts
b. 15 gallons 2 quarts = __________ quarts
c. 8 quarts 2 pints = __________ pints
d. 12 quarts 3 pints = __________ cups
e. 26 gallons 3 quarts = __________ pints
f. 32 gallons 2 quarts = __________ cups
Answer:

a. 8 gallons 2 quarts =34  quarts
b. 15 gallons 2 quarts = 62 quarts
c. 8 quarts 2 pints = 18 pints
d. 12 quarts 3 pints = 54 cups
e. 26 gallons 3 quarts = 214 pints
f. 32 gallons 2 quarts = 520 cups

Question 6.
Answer true or false for the following statements. If your answer is false, make the statement true.
a. 1 gallon > 4 quarts _________
b. 5 liters = 5,000 milliliters ________
c. 15 pints < 1 gallon 1 cup _________
Answer:

a.

1 gallon > 4 quarts

False, 1 gallon = 4 quarts

b. 5 liters = 5,000 milliliters ________

True

c. 15 pints < 1 gallon 1 cup _________

False

15 pints > 1 gallon 1 cup.

Question 7.
Russell has 5 liters of a certain medicine. If it takes 2 milliliters to make 1 dose, how many doses can he make? Answer:

Total number of litres = 5 litres

1 litre = 1,000 millilitres

5 litres = 1000 x 5 = 5000

Given, 2 millilitres will make 1 dose

5000 / 2 = 2500 ml

Therefore, Russel can make 2500 doses

Question 8.
Each month, the Moore family drinks 16 gallons of milk and the Siler family goes through 44 quarts of milk. Which family drinks more milk each month?
Answer:

1 gallon = 4 quarts

Given, Moore family drink 16 gallons of milk

So, 16 gallons = 64 quarts

Siler family drinks 44 quarts of milk

Now, 64 – 44 = 20

Therefore, Moore family drinks more milk than Siler family.

Moore family drinks 20 quarts more than Siler.

Question 9.
Keith’s lemonade stand served lemonade in glasses with a capacity of 1 cup. If he had 9 gallons of lemonade, how many cups could he sell?
Answer:

1 gallon = 16 cups

Now, 9 gallons =

16 x 9 = 144 cups

Therefore, Keith can sold 144 cups of lemonade.

Eureka Math Grade 4 Module 7 Lesson 2 Exit Ticket Answer Key

Question 1.
Complete the table.

Quarts

Cups

14
28
416

Answer:

Question 2.
Bonnie’s doctor recommended that she drink 2 cups of milk per day. If she buys 3 quarts of milk, will it be enough milk to last 1 week? Explain how you know.
Answer:

Given, Bonnie’s is recommended to drink 2 cups of milk

The amount of milk she bought = 3 quarts

1 quart = 4 cups

So, 3 quarts = 3 x 4 = 12 cups

1 week = 7 days

7 days x 2 cups = 14 cups

14 cups – 12 cups = 2 cups

Therefore,  Bonnie do not have mil to drink for 1 week . there is a shortage of 2 cups.


Eureka Math Grade 4 Module 7 Lesson 2 Homework Answer Key

Use the RDW process to solve Problems 1–3.
Question 1.
Dawn needs to pour 3 gallons of water into her fish tank. She only has a 1-cup measuring cup. How many cups of water should she put in the tank?
Answer:

Total quantity of water Dawn needs to pour in fish tank = 3 gallons

We know that,

1 gallon = 16 cups

3 gallons = 16 x 3 = 48

Therefore, Dawn should put 48 cups of water in to the tank.

Question 2.
Julia has 4 gallons 2 quarts of water. Ally needs the same amount of water but only has 12 quarts. How much more water does Ally need?
Answer:

Given that,

The amount of water Julia has = 4 gallons 2 quarts

The amount of water Ally have = 12 quarts

12 quarts = 3 gallons

Now, 3 gallons – 4 gallons 2 quarts = 1 gallon  2 quarts

Therefore, Ally needs 1 gallon 2 quarts.

Question 3.
Sean drank 2 liters of water today, which was 280 milliliters more than he drank yesterday. How much water did he drink yesterday?
Answer:

Given,

The amount of water Sean drink today = 2 litres

1 litre = 1000 millilitres

2 litres = 1000 x 2 = 2000 millilitres

Also given, she drank 280 millilitres more than yesterday

Now, 2000 – 280 = 1720

Therefore, the amount of water she drank yesterday = 1720 millilitres.

Question 4.
Complete the tables.
a.

GallonsQuarts
14
28
416
1248
1560

b.

QuartsPints
12
24
612
1020
1632

Answer:

Question 5.
Solve.
a. 6 gallons 3 quarts = __________ quarts
b. 12 gallons 2 quarts = __________ quarts
c. 5 quarts 1 pint = __________ pints
d. 13 quarts 3 pints = __________ cups
e. 17 gallons 2 quarts = __________ pints
f. 27 gallons 3 quarts = __________ cups
Answer:

a. 6 gallons 3 quarts = 27 quarts
b. 12 gallons 2 quarts = 50 quarts
c. 5 quarts 1 pint = 11 pints
d. 13 quarts 3 pints = 58 cups
e. 17 gallons 2 quarts = 140 pints
f. 27 gallons 3 quarts = 444 cups

Question 6.
Explain how you solved Problem 5(f).
Answer:

27 gallons 3 quarts = 444 cups

1 gallon = 4 quarts

27 gallons = 27 x 4 = 108 quarts

108 + 3 = 111

1 quart = 4 cups

111 cups = 111 x 4 = 444

Therefore, 27 gallons 3 quarts = 444 Cups.

Question 7.
Answer true or false for the following statements. If your answer is false, make the statement true by correcting the right side of the comparison.
a. 2 quarts > 10 pints __________
b. 6 liters = 6,000 milliliters __________
c. 16 cups < 4 quarts 1 cup ___________
Answer:

a. 2 quarts > 10 pints __________

False, 1 quart = 2 pints

So, 2 quarts = 4 pints

Therefore, 2 quarts < 10 pints
b. 6 liters = 6,000 milliliters __________

True.
c. 16 cups < 4 quarts 1 cup ___________

False,

1 quart = 4 cups

4 quarts = 4 x 4 = 16 cups

Therefore, 16 cups = 4 quarts.

Question 8.
Joey needs to buy 3 quarts of chocolate milk. The store only sells it in pint containers. How many pints of chocolate milk should he buy? Explain how you know.
Answer:

We know that,

1 quart = 2 pints

Now, the amount of chocolate milk Joey needs to buy = 3 quarts

3 quarts = 3 x 2 = 6 pints

Therefore, Joey should buy 6 pints of chocolate milk.

Question 9.
Granny Smith made punch. She used 2 pints of ginger ale, 3 pints of fruit punch, and 1 pint of orange juice. She served the punch in glasses that had a capacity of 1 cup. How many cups can she fill?
Answer:

We know that,

1 pint = 2 cups

The amount of ginger ale granny used = 2 pints

The amount of fruit punch she used = 3

The amount of orange juice she used = 1 pint

Total : 2+3+1 = 6  pints

Now, 6 pints x 2 = 12 cups

Therefore, she can fill 12 cups.

Eureka Math Grade 4 Module 7 Lesson 1 Answer Key

Engage NY Eureka Math 4th Grade Module 7 Lesson 1 Answer Key

Eureka Math Grade 4 Module 7 Lesson 1 Sprint Answer Key

A
Convert to Dollars
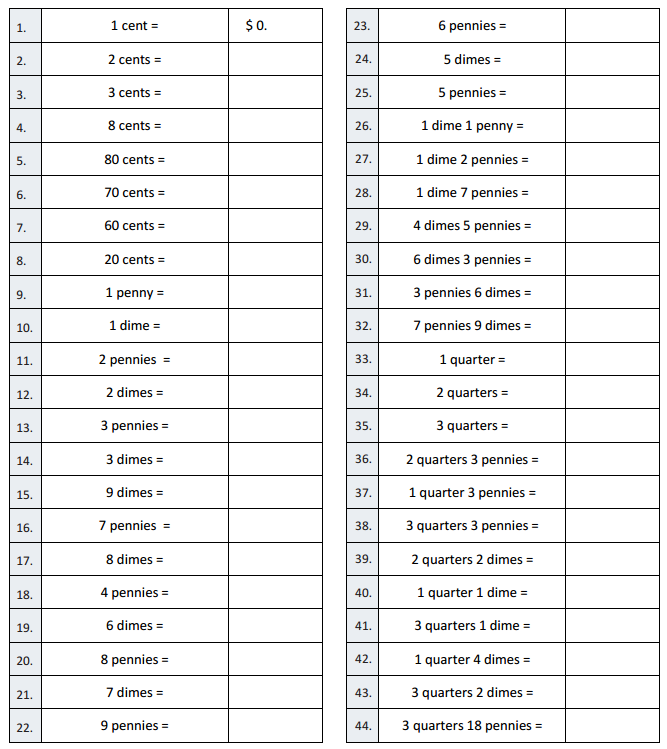
Engage NY Math 4th Grade Module 7 Lesson 1 Sprint Answer Key 1
Question 1.
1 cent =
Answer:
$ 0.01

Question 2.
2 cents =
Answer:

$0.02

Question 3.
3 cents =
Answer:

$0.03

Question 4.
8 cents =
Answer:

$0.08

Question 5.
80 cents =
Answer:

$0.8

Question 6.
70 cents =
Answer:

$0.7

Question 7.
60 cents =
Answer:

$0.6

Question 8.
20 cents =
Answer:

$0.2

Question 9.
1 penny =
Answer:

1 penny = 1 cent

$0.01

Question 10.
1 dime =
Answer:

1 dime = 10 cents

$0.1

Question 11.
2 pennies =
Answer:

2 pennies = 2 cents

$0.02

Question 12.
2 dimes =
Answer:

2 dimes = 10 +10 = 20 cents

$0.2

Question 13.
3 pennies =
Answer:

3 pennies = 3 cents

$0.03

Question 14.
3 dimes =
Answer:

3 dimes = 10+10+10+ = 30 cents

$0.3

Question 15.
9 dimes =
Answer:

9 dimes = 10+10+10+10+10+10+10+10+10+ = 90 cents

$0.9

Question 16.
7 pennies =
Answer:

7 pennies = 7 cents

$ 0.07

Question 17.
8 dimes =
Answer:

8 dimes = 10+10+10+10+10+10+10+10 = 80

$0.8

Question 18.
4 pennies =
Answer:

4 pennies = 4 cents

$0.04

Question 19.
6 dimes =
Answer:

6 dimes = 10+10+10+10+10+10 = 60

$0.6

Question 20.
8 pennies =
Answer:

8 pennies = 8 cents

$0.08

Question 21.
7 dimes =
Answer:

7 dimes = 10+10+10+10+10+10+10 = 70 cents

$0.7

Question 22.
9 pennies =
Answer:

9 pennies = 9 cents

$0.09

Question 23.
6 pennies =
Answer:

6 pennies = 6 cents

$0.06

Question 24.
5 dimes =
Answer:

5 dimes = 10+10+10+10+10 = 50 cents

$0.5

Question 25.
5 pennies =
Answer:

5 pennies = 5 cents

$0.05

Question 26.
1 dime 1 penny =
Answer:

1 dime = 10 cents

1 penny = 1 cents

Total : 10 +1 = 11

$0.11

Question 27.
1 dime 2 pennies =
Answer:

1 dime = 10 cents

2 pennies = 2 cents

Total : 10+2 = 12

$0.12

Question 28.
1 dime 7 pennies =
Answer:

1 dime = 10 cents

7 pennies = 7 cents

Total : 10+7 = 17

$0.17

Question 29.
4 dimes 5 pennies =
Answer:

4 dimes = 10+10+10+10 = 40 cents

5 pennies = 5 cents

Total : 40+5 = 45

$0.45

Question 30.
6 dimes 3 pennies =
Answer:

6 dimes = 10+10+10+10+10+10 = 60

3 pennies = 3 cents

Total : 60 + 3 = 63

$0.63

Question 31.
3 pennies 6 dimes =
Answer:

3 pennies = 3 cents

6 dimes = 10+10+10+10+10+10 = 60

Total : 3 + 60 = 63

$0.63

Question 32.
7 pennies 9 dimes =
Answer:

7 pennies = 7 cents

9 dimes = 10+10+10+10+10+10+10+10+10 = 90

Total : 7 + 90 = 97

$0.97

Question 33.
1 quarter =
Answer:

1 quarter = 25 cents

$0.25

Question 34.
2 quarters =
Answer:

2 quarters = 25 + 25 = 50 cents

$0.50

Question 35.
3 quarters =
Answer:

3 quarters = 25+ 25+ 25 = 75 cents

$0.75

Question 36.
2 quarters 3 pennies =
Answer:

2 quarters = 25+ 25 = 50 cents

3 pennies = 3 cents

Total : 50 + 3 = 53

$0.53

Question 37.
1 quarter 3 pennies =
Answer:

1 quarters = 25 cents

3 pennies = 3 cents

Total : 25 + 3 = 28

$0.28

Question 38.
3 quarters 3 pennies =
Answer:

3 quarters = 25 + 25+ 25 = 75 cents

3 pennies = 3 cents

Total : 75 + 3 = 78

$0.78

Question 39.
2 quarters 2 dimes =
Answer:

2 quarters = 25+25 = 50 cents

2 dimes = 10 + 10 = 20 cents

Total : 50+ 20 = 70

$0.70

Question 40.
1 quarter 1 dime =
Answer:

1 quarter = 25 cents

1 dime = 10 cents

Total : 25 + 10 = 35 cents

$0.35

Question 41.
3 quarters 1 dime =
Answer:

3 quarters = 25+25+25 = 75 cents

1 dime = 10 cents

Total : 75 + 10 = 85

$0.85

Question 42.
1 quarter 4 dimes =
Answer:

1 quarter = 25 cents

4 dimes = 10+10+10+10 = 40 cents

Total : 25+40 =65

$0.65

Question 43.
3 quarters 2 dimes =
Answer:

3 quarters = 25+25+25 = 75 cents

2 dimes = 10+10 = 20

Total : 75 + 20 = 95

$0.95

Question 44.
3 quarters 18 pennies =
Answer:

3 quarters = 25+25+25 = 75 cents

18 pennies = 18 cents

Total : 75 + 18 = 93

$0.93

B
Convert to Dollars
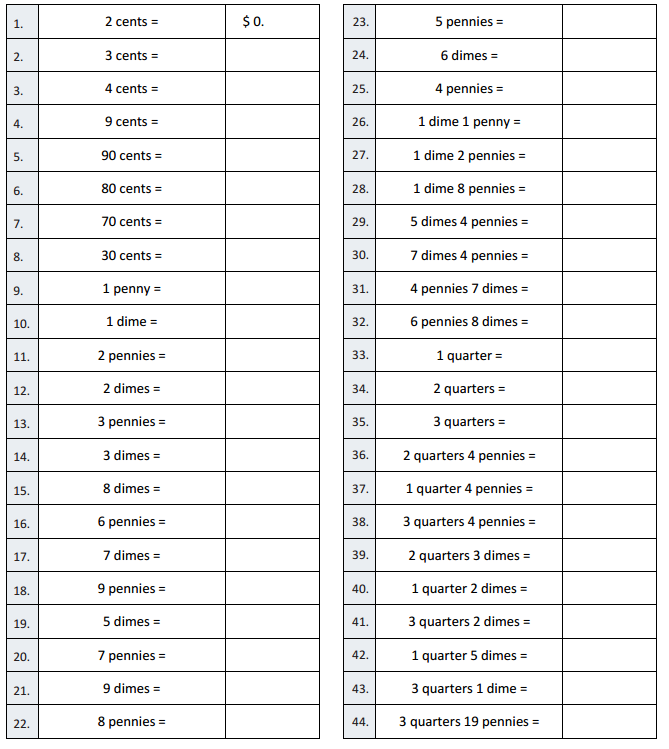
Engage NY Math 4th Grade Module 7 Lesson 1 Sprint Answer Key 2
Question 1.
2 cent =
Answer:
$ 0.2

Question 2.
3 cents =
Answer:

$0.03

Question 3.
4 cents =
Answer:

$0.04

Question 4.
9 cents =
Answer:

$0.09

Question 5.
90 cents =
Answer:

$0.90

Question 6.
80 cents =
Answer:

$0.80

Question 7.
70 cents =
Answer:

$0.70

Question 8.
30 cents =
Answer:

$0.30

Question 9.
1 penny =
Answer:

$0.01

Question 10.
1 dime =
Answer:

1 dime = 10 cents

$0.10

Question 11.
2 pennies =
Answer:

2 pennies = 2 cents

$0.02

Question 12.
2 dimes =
Answer:

2 dimes = 10 + 10 = 20

$0.20

Question 13.
3 pennies =
Answer:

3 pennies = 3 cents

$0.03

Question 14.
3 dimes =
Answer:

3 dimes = 10+10+10 =30

$0.30

Question 15.
8 dimes =
Answer:

8 dimes = 10+10+10+10+10+10+10+10 = 80

$0.80

Question 16.
6 pennies =
Answer:

6 pennies = 6 cents

$0.06

Question 17.
7 dimes =
Answer:

7 dimes = 10+10+10+10+10+10+10 = 70 cents

$0.70

Question 18.
9 pennies =
Answer:

9 pennies = 9 cents

$0.09

Question 19.
5 dimes =
Answer:

5 dimes = 10+10+10+10+10 =50 cents

$0.50

Question 20.
7 pennies =
Answer:

7 pennies = 7 cents

$0.07

Question 21.
9 dimes =
Answer:

9 dimes = 10+10+10+10+10+10+10+10+10 = 90 cents

$0.90

Question 22.
8 pennies =
Answer:

8 pennies = 8 cents

$0.08

Question 23.
5 pennies =
Answer:

5 pennies = 5 cents

$0.05

Question 24.
6 dimes =
Answer:

6 dimes = 10+10+10+10+10+10 = 60

$0.60

Question 25.
4 pennies =
Answer:

4 pennies = 4 cents

$0.04

Question 26.
1 dime 1 penny =
Answer:

1 dime = 10 cents

1 penny = 1 cent

Total : 10 + 1 = 11

$0.11

Question 27.
1 dime 2 pennies =
Answer:

1 dime = 10 cents

2 pennies = 2 cents

Total : 10 + 2 = 12

$0.12

Question 28.
1 dime 8 pennies =
Answer:

1 dime = 10 cents

8 pennies = 8 cents

Total : 10+8= 18

$0.18

Question 29.
5 dimes 4 pennies =
Answer:

5 dimes = 10+10+10+10+10 = 50 cents

4 pennies = 4 cents

Total : 50 + 4 = 54

$0.54

Question 30.
7 dimes 4 pennies =
Answer:

7 dimes = 10+10+10+10+10+10+10 = 70

4 pennies = 4 cents

Total : 70 + 4 = 74

$0.74

Question 31.
4 pennies 7 dimes =
Answer:

4 pennies = 4 cents

7 dimes = 10+10+10+10+10+10+10 = 70 cents

Total ; 4 + 70 = 74

$0.74

Question 32.
6 pennies 8 dimes =
Answer:

6 pennies = 6 cents

8 dimes = 10+10+10+10+10+10+10+10 = 80

Total : 6 + 80 = 86

$0.86

Question 33.
1 quarter =
Answer:

1 quarter = 25 cents

$0.25

Question 34.
2 quarters =
Answer:

2 quarters = 25+ 25 = 50

$0.50

Question 35.
3 quarters =
Answer:

3 quarters = 25+25+25 = 75

$0.75

Question 36.
2 quarters 4 pennies =
Answer:

2 quarters = 25+25=50

4 pennies = 4 cents

Total : 50+4 = 54

$0.54

Question 37.
1 quarter 4 pennies =
Answer:

1 quarter = 25 cents

4 pennies = 4 cents

Total : 25 + 4 = 29

$0.29

Question 38.
3 quarters 4 pennies =
Answer:

3 quarters = 25+ 25+ 25 = 75

4 pennies = 4 cents

Total : 75 + 4 = 79

$0.79

Question 39.
2 quarters 3 dimes =
Answer:

2 quarters = 25+25 = 50 cents

3 dimes = 10+10 + 10 = 30 cents

Total : 50+ 30 = 80

$0.80

Question 40.
1 quarter 2 dime =
Answer:

1 quarter = 25 cents

2 dimes = 10+10 = 20 cents

Total : 25 +20 = 45

$0.45

Question 41.
3 quarters 2 dime =
Answer:

3 quarters = 25+25+25 = 75 cents

2 dimes = 10+10 = 20

Total : 75 + 20 = 95

$0.95

Question 42.
1 quarter 5 dimes =
Answer:

1 quarter = 25 cents

5 dimes = 10+10+10+10+10 = 50

Total : 25+50 = 75

$0.75

Question 43.
3 quarters 1 dimes =
Answer:

3 quarters = 25 + 25 + 25 = 75

1 dime = 10 cents

Total : 75 + 10 = 85

$0.85

Question 44.
3 quarters 19 pennies =
Answer:

3 quarters = 25+ 25 + 25 = 75

19 pennies = 19 cents

Total : 75 + 19 = 94

$0.94

Eureka Math Grade 4 Module 7 Lesson 1 Practice Sheet Answer Key

a.

Pounds

Ounces

116
232
348
464
580
696
7112
8128
9144
10160

The rule for converting pounds to ounces is _______ .

To convert pounds into ounces, multiply pounds value by 16

b.

Yards

Feet

13
26
39
412
515
618
721
824
927
1030

The rule for converting yards to feet is ________.

To convert yards into feet, multiply yards value by 3

c.

Feet

Inches

112
224
336
448
560
672
784
896
9108
10120

The rule for converting feet to inches is __________.

To convert feet to inches, multiply feet value by 12

Eureka Math Grade 4 Module 7 Lesson 1 Problem Set Answer Key

Use RDW to solve Problems 1–3.
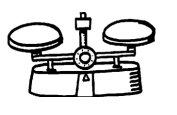
Engage NY Math Grade 4 Module 7 Lesson 1 Problem Set Answer Key 1
Question 1.
Evan put a 2-pound weight on one side of the scale. How many 1-ounce weights will he need to put on the other side of the scale to make them equal?
Answer:

1 pound = 16 ounces

Which means , 2 pounds = 16 + 16 = 32

Therefore, Evan need 32 weight on other side to make them equal.

Question 2.
Julius put a 3-pound weight on one side of the scale. Abel put 35 1-ounce weights on the other side. How many more 1-ounce weights does Abel need to balance the scale?
Answer:

1 lb = 16 oz

Which means, 3 lb = 48 oz

48 – 35 = 13

Therefore, Able needs 13 more 1- ounce weights to balance the scale.

Question 3.
Mrs. Upton’s baby weighs 5 pounds and 4 ounces. How many total ounces does the baby weigh?
Answer:

1 pound = 16 ounces

Which means, 5 pounds = 5 x 16 = 80 oz

So, 80 + 4 = 84 oz

Therefore, Mrs. Upton’s baby weigh 84 ounces.

Question 4.
Complete the following conversion tables, and write the rule under each table.
a.

Pounds

Ounces

116
348
7112
10160
17272

The rule for converting pounds to ounces is __________

To convert pounds to ounces, multiply pounds value by 16

b.

Feet

Inches

112
224
560
10120
15180

The rule for converting feet to inches is __________

To convert Feet into inches, multiply feet value by 12.

c.

Yards

Feet

13
26
412
1030
1442

The rule for converting yards to feet is ___________
Answer:

To convert yard to feet, multiply yard value by 3.

Question 5.
Solve.
a. 3 feet 1 inch = _______ inches
b. 11 feet 10 inches = _______ inches
c. 5 yards 1 foot = _______ feet
d. 12 yards 2 feet = _______ feet
e. 27 pounds 10 ounces = _______ ounces
f. 18 yards 9 feet = _______ feet
g. 14 pounds 5 ounces = _______ ounces
h. 5 yards 2 feet = _______ inches
Answer:

a. 3 feet 1 inch = 37 inches
b. 11 feet 10 inches  142 inches
c. 5 yards 1 foot = 16 feet
d. 12 yards 2 feet =  38 feet
e. 27 pounds 10 ounces = 442 ounces
f. 18 yards 9 feet =63 feet
g. 14 pounds 5 ounces = 229 ounces
h. 5 yards 2 feet = 17 inches

Question 6.
Answer true or false for the following statements. If the statement is false, change the right side of the comparison to make it true.
a. 2 kilograms > 2,600 grams ___________
b. 12 feet < 140 inches ___________
c. 10 kilometres = 10,000 meters ___________
Answer:

a. False , 2 kg = 2000 grams

So, 2 kilograms < 2,600 grams

b. False, 12 feet = 144 inches

So, 12 feet > 140 inches

c. True

Eureka Math Grade 4 Module 7 Lesson 1 Exit Ticket Answer Key

Question 1.
Solve.
a. 8 feet = _________ inches
b. 4 yards 2 feet = _________ feet
c. 14 pounds 7 ounces = ________ ounces
Answer:

a. 8 feet = 96 inches
b. 4 yards 2 feet = 14 feet
c. 14 pounds 7 ounces = 231 ounces

Question 2.
Answer true or false for the following statements. If the statement is false, change the right side of the comparison to make it true.
a. 3 pounds > 60 ounces __________
b. 12 yards < 40 feet _________
Answer:

a. False , 3 pounds = 48 ounces

so, 3 pounds < 60 ounces

b. True

Eureka Math Grade 4 Module 7 Lesson 1 Homework Answer Key

Question 1.
Complete the tables.
a.

Yards

Feet

13
26
39
515
1030

b.

Feet

Inches

112
224
560
10120
15180

c.

Yards

Inches

136
3108
6216
10360
12432

Answer:

Question 2.
a. 2 yards 2 inches = ________ inches
b. 9 yards 10 inches = ________ inches
c. 4 yards 2 feet = ________ feet
d. 13 yards 1 foot = ________ feet
e. 17 feet 2 inches = ________ inches
f. 11 yards 1 foot = ________ feet
g. 15 yards 2 feet = ________ feet
h. 5 yards 2 feet = ________ inches
Answer:

a. 2 yards 2 inches = 74 inches
b. 9 yards 10 inches =  334 inches
c. 4 yards 2 feet =  14 feet
d. 13 yards 1 foot = 40 feet
e. 17 feet 2 inches = 206 inches
f. 11 yards 1 foot = 34 feet
g. 15 yards 2 feet = 47 feet
h. 5 yards 2 feet = 17 inches

Question 3.
Ally has a piece of string that is 6 yards 2 feet long. How many inches of string does she have?
Answer:

6 yards = 36+36+36+36+36+36 = 216 inches

2 feet =  12+12 = 24 inches

Total :  216 + 24 = 240

Therefore, she have 240 inches of string

Question 4.
Complete the table.

Pounds

Ounces

116
232
464
10160
12192

Answer:

Question 5.
Renee’s baby sister weighs 7 pounds 2 ounces. How many ounces does her sister weigh?
Answer:

7 pounds = 16+16+16+16+16+16+16 = 112 ounces

and 2 ounces

Total : 112 + 2 = 114

Therefore, Renee’s baby sister weighs 114 ounces

Question 6.
Answer true or false for the following statements. If the statement is false, change the right side of the comparison to make it true.
a. 4 kilograms < 4,100 grams ________
b. 10 yards < 360 inches ________
c. 10 liters = 100,000 millilitres ________
Answer:

a. True

b. False , 10 yards = 360 inches

c. False , 10 litres = 10000 millilitres.
Eureka Math Grade 6 Module 6 Lesson 5 Answer Key

Engage NY Eureka Math Grade 6 Module 6 Lesson 5 Answer Key

Eureka Math Grade 6 Module 6 Lesson 5 Example Answer Key

Example 1: Relative Frequency Table

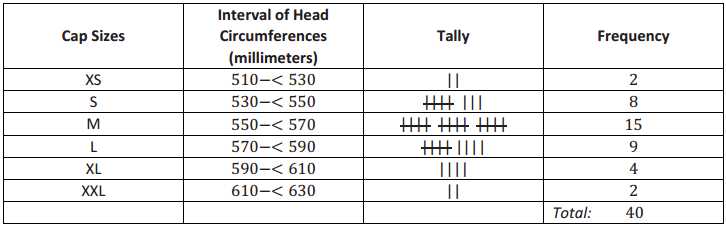
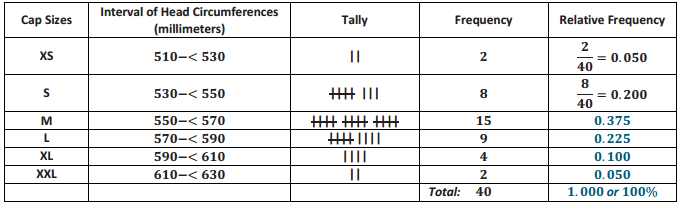
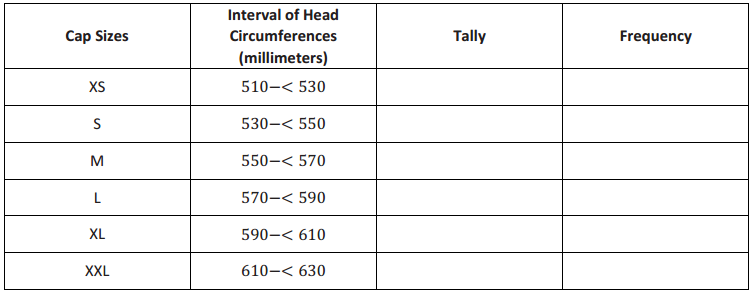
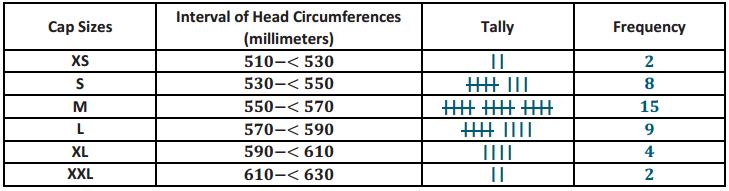
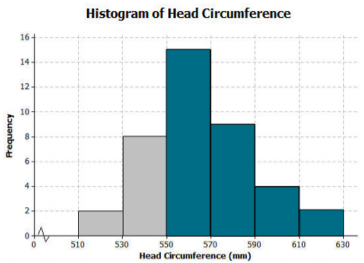
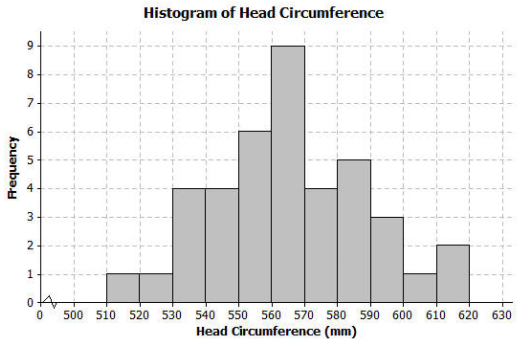
In Lesson 4, we investigated the head circumferences that the boys’ and girls’ basketball teams collected. Below is the frequency table of the head circumferences that they measured.

Eureka Math Grade 6 Module 6 Lesson 5 Example Answer Key 1

Isabel, one of the basketball players, indicated that most of the caps were small (S), medium (M), or large (L). To decide if Isabel was correct, the players added a relative frequency column to the table.

Relative frequency is the frequency for an interval divided by the total number of data values. For example, the relative frequency for the extra small (XS) cap is 2 divided by 40, or 0.05. This represents the fraction of the data values that were XS.

Exercises 1 – 4:

Exercise 1.
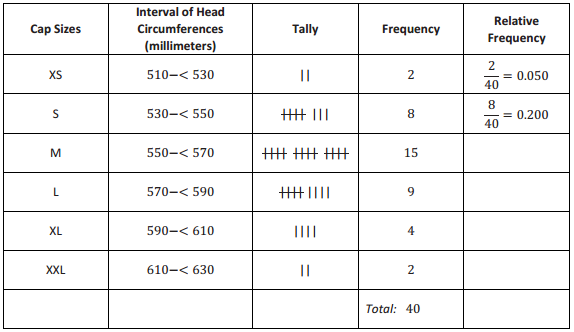
Complete the relative frequency column in the table below.
Eureka Math Grade 6 Module 6 Lesson 5 Example Answer Key 2
Answer:
Eureka Math Grade 6 Module 6 Lesson 5 Example Answer Key 3

Exercise 2.
What is the total of the relative frequency column?
Answer:
The total of the relative frequency column is 1.000, or 100%.

Exercise 3.
Which interval has the greatest relative frequency? What is the value?
Answer:
The interval with the greatest relative frequency is the medium-sized caps, 550—569, which has a relative frequency of 0. 375, or 37. 5%.

Exercise 4.
What percentage of the head circumferences are between 530 and 589 mm? Show how you determined the
answer.
Answer:
0.200 + 0.375 + 0.225 = 0.800, or 80%

Example 2: Relative Frequency Histogram

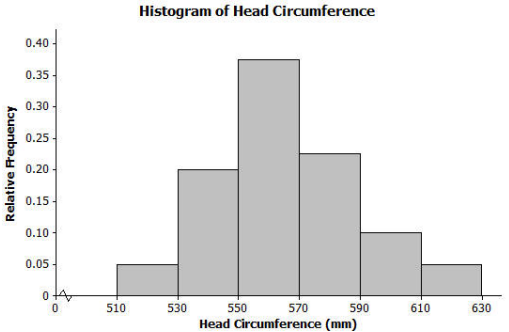
The players decided to construct a histogram using the relative frequencies instead of the frequencies. They noticed that the relative frequencies in the table ranged from close to 0 to about 0.40. They drew a number line and marked off the intervals on that line. Then, they drew the vertical line and labeled it Relative Frequency. They added a scale to this line by starting at 0 and counting by 0.05 until they reached 0.40.

They completed the histogram by drawing the bars so the height of each bar matched the relative frequency for that interval. Here is the completed relative frequency histogram:

Eureka Math Grade 6 Module 6 Lesson 5 Example Answer Key 4

Exercises 5 – 6:

Exercise 5.

a. Describe the shape of the relative frequency histogram of head circumferences from Example 2.
Answer:
The shape of the relative frequency is slightly skewed to the right.

b. How does the shape of this relative frequency histogram compare with the frequency histogram you drew in Exercise 5 of Lesson 4?
Answer:
The shape is the same in both histograms.

c. Isabel said that most of the caps that needed to be ordered were small (S), medium (M), and large (L). Was she right? What percentage of the caps to be ordered are small, medium, or large?
Answer:
She was right. The total percentage of the small, medium and large cops was 80% (20% small, 37.5% medium, and 22. 5% large, for a total of 80%).

Exercise 6.
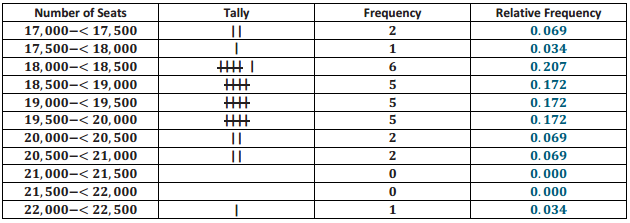
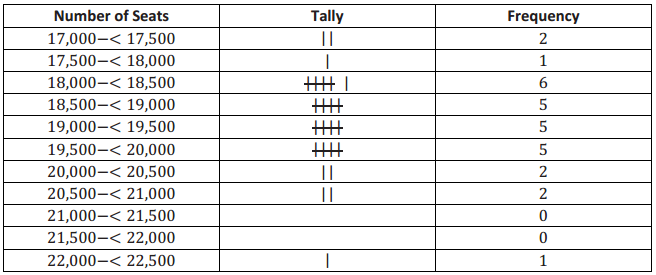
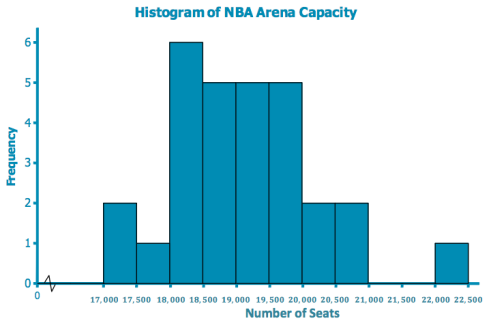
Here is the frequency table of the seating capacity of arenas for the NBA basketball teams.
Eureka Math Grade 6 Module 6 Lesson 5 Example Answer Key 5

a. What is the total number of NBA arenas?
Answer:
There are 29 NBA arenas in total.

b. Complete the relative frequency column. Round the relative frequencies to the nearest thousandth.
Answer:
See the table above.

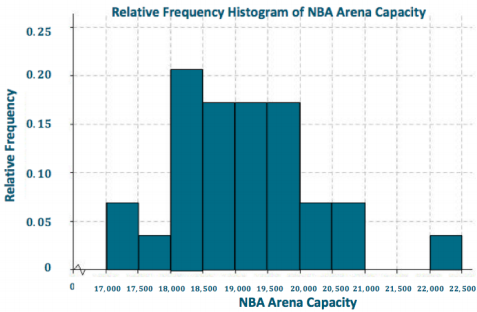
c. Construct a relative frequency histogram.
Answer:
Eureka Math Grade 6 Module 6 Lesson 5 Example Answer Key 6

d. Describe the shape of the relative frequency histogram.
Answer:
The shape is slightly skewed to the right.

e. What percentage of the arenas have a seating capacity between 18, 500 and 19.999 seats?
Answer:
Approximately 0.516, or 51.6%, of the arenas have a seating capacity between 18,500 and 19,999 seats.

f. How does this relative frequency histogram compare to the frequency histogram that you drew in Problem 2 of the Problem Set in Lesson 4?
Answer:
Both histograms have the same shape.

Eureka Math Grade 6 Module 6 Lesson 5 Problem Set Answer Key

Question 1.
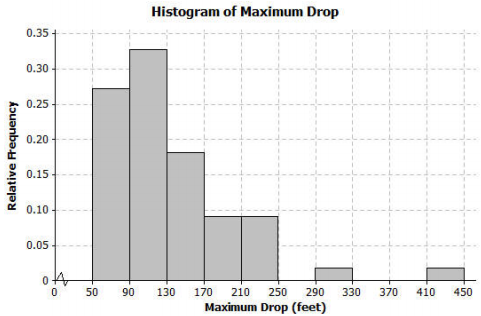
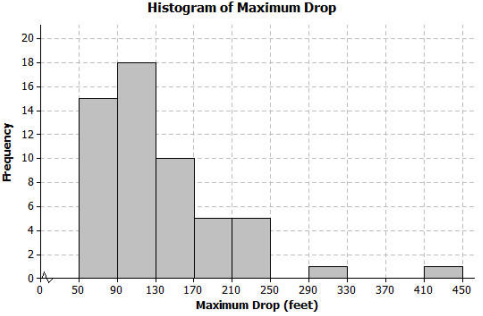
Below is a relative frequency histogram of the maximum drop (in feet) of a selected group of roller coasters.

Eureka Math Grade 6 Module 6 Lesson 5 Problem Set Answer Key 7

a. Describe the shape of the relative frequency histogram.
Answer:
The shape is skewed to the right.

b. What does the shape tell you about the maximum drop (in feet) of roller coasters?
Answer:
The shape tells us most of the roller coasters have o maximum drop that is between 50 and 170 feet but that some roller coasters have a maximum drop that is quite a bit larger than the others.

c. Jerome said that more than half of the data values are in the interval from 50 to 130 feet. Do you agree with Jerome? Why or why not?
Answer:
I agree with Jerome because that interval contains 60% of the data.

Question 2.
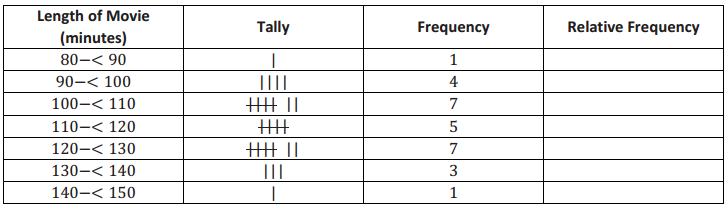
The frequency table below shows the length of selected movies shown in a local theater over the past 6 months.

Eureka Math Grade 6 Module 6 Lesson 5 Problem Set Answer Key 8


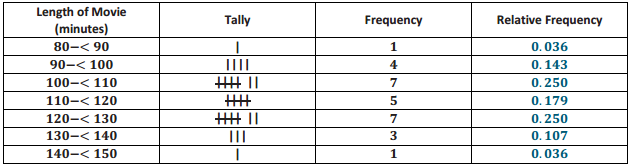
a. Complete the relative frequency column. Round the relative frequencies to the nearest thousandth.
Answer:
Eureka Math Grade 6 Module 6 Lesson 5 Problem Set Answer Key 9

b. What percentage of the movie lengths are greater than or equal to 130 minutes?
Answer:
0.107 + 0.036 = 0. 143, or 14.3% of the movie lengths are greater than or equal to 130 minutes.

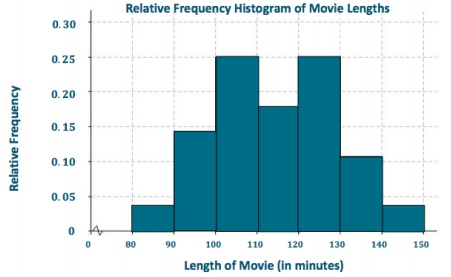
c. Draw a relative frequency histogram. (Hint: Label the relative frequency scale starting at O and going up to 0.30, marking off intervals of 0.05.)
Answer:
Eureka Math Grade 6 Module 6 Lesson 5 Problem Set Answer Key 10

d. Describe the shape of the relative frequency histogram.
Answer:
The histogram is mound shaped and approximately symmetric.

e. What does the shape tell you about the length of movie times?
Answer:
The shape tells us the length of most movies is between 100 and 130 minutes.

Question 3.
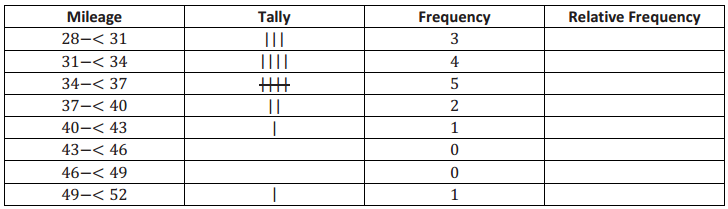
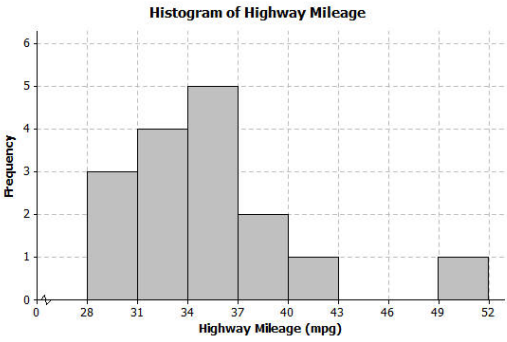
The table below shows the highway miles per gallon of different compact cars.
Eureka Math Grade 6 Module 6 Lesson 5 Problem Set Answer Key 11


a. What is the total number of compact cars?
Answer:
The total number of compact cars is 16.

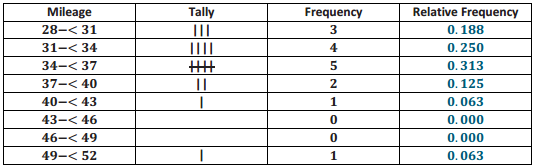
b. Complete the relative frequency column. Round the relative frequencies to the nearest thousandth.
Answer:
Eureka Math Grade 6 Module 6 Lesson 5 Problem Set Answer Key 12

c. What percentage of the cars get between 31 and up to but not including 37 miles per gallon on the highway?
Answer:
0.250 + 0.313 = 0.563, or 56.3% of the cars get between 31 and up to 37 miles per gallon on the highway.

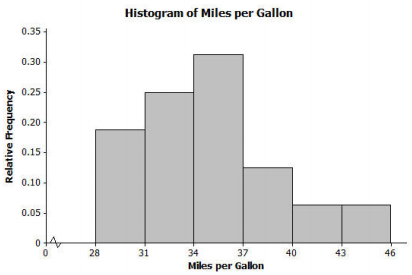
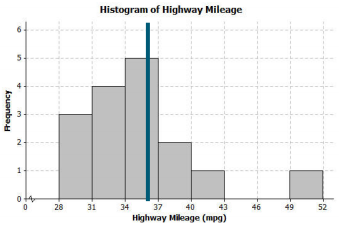
d. Juan drew the relative frequency histogram of the highway miles per gallon for the compact cars, 0.35 shown on the right. Did Juan draw the histogram correctly? Explain your answer.
Eureka Math Grade 6 Module 6 Lesson 5 Problem Set Answer Key 13
Answer:
Juan did not draw the histogram correctly because he did not leave spaces far intervals 43-< 46 and 46-< 49. These spaces are needed to represent the relative frequency of zero. He also forgot to draw a bar for the final interval, 49-< 52.

Eureka Math Grade 6 Module 6 Lesson 5 Exit Ticket Answer Key

Question 1.
Calculators are allowed for completing your problems.

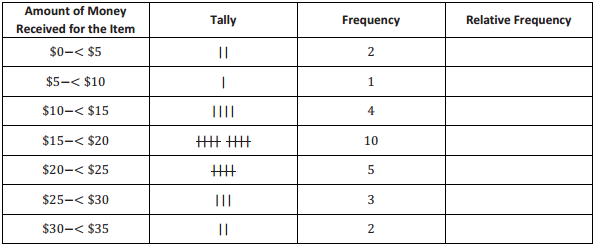
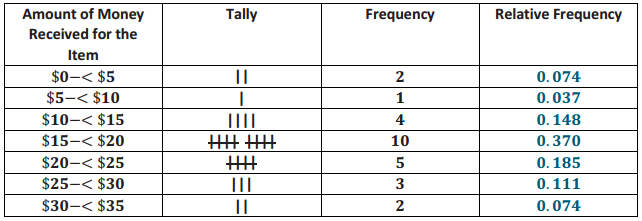
Hector’s mom had a rummage sale, and after she sold an item, she tallied the amount of money she received for the item. The following is the frequency table Hector’s mom created:

Eureka Math Grade 6 Module 6 Lesson 5 Exit Ticket Answer Key 14


a. What was the total number of items sold at the rummage sale?
Answer:
The total number of items sold is 27 items.

b. Complete the relative frequency column. Round the relative frequencies to the nearest thousandth.
Answer:
Eureka Math Grade 6 Module 6 Lesson 5 Exit Ticket Answer Key 15

c. What percentage of the items Hector’s mom sold were sold for $15 or more but less than $20?
Answer:
37% of the items Hector’s mom sold were sold for $15 or more but less than $20.

Eureka Math Grade 6 Module 6 Lesson 8 Answer Key

Engage NY Eureka Math Grade 6 Module 6 Lesson 8 Answer Key

Eureka Math Grade 6 Module 6 Lesson 8 Example Answer Key

Example 1: Comparing Two Data Distributions

Robert’s family is planning to move to either New York City or San Francisco. Robert has a cousin in San Francisco and asked her how she likes living in a climate as warm as San Francisco. She replied that it doesn’t get very warm in San Francisco. He was surprised by her answer. Because temperature was one of the criteria he was going to use to form his opinion about where to move, he decided to investigate the temperature distributions for New York City and San Francisco. The table below gives average temperatures (in degrees Fahrenheit) for each month for the two cities.

Eureka Math Grade 6 Module 6 Lesson 8 Example Answer Key 1
Exercises 1 – 2:

Use the data in the table provided in Example 1 to answer the following:

Exercise 1.
Calculate the mean of the monthly average temperatures for each city.
Answer:
The mean of the monthly temperatures for New York City is 63 degrees.
The mean of the monthly temperatures for San Francisco is 64 degrees.

Exercise 2.
Recall that Robert is trying to decide where he wants to move. What is your advice to him based on comparing the means of the monthly temperatures of the two cities?
Answer:
Since the means are almost the some, it looks like Robert could move to either city. Even though the question asks students to focus on the means, they might make a recommendation that takes variability into account.

For example, they might note that even though the means for the two cities are about the same, there are some much lower and much higher monthly temperatures for New York City and use this as a basis to suggest that Robert move to San Francisco.

Example 2: Understanding Variability

Maybe Robert should look at how spread out the New York City monthly temperature data are from the mean of the New York City monthly temperatures and how spread out the San Francisco monthly temperature data are from the mean of the San Francisco monthly temperatures. To compare the variability of monthly temperatures between the two cities, it may be helpful to look at dot plots. The dot plots of the monthly temperature distributions for New York City and San Francisco follow.
Dot Plot of Temperature for New York City
Eureka Math Grade 6 Module 6 Lesson 8 Example Answer Key 2

Dot Plot of Temperature for San Francisco
Eureka Math Grade 6 Module 6 Lesson 8 Example Answer Key 3

Exercises 3 – 7:

Use the dot plots above to answer the following:

Exercise 3.
Mark the location of the mean on each distribution with the balancing A symbol. How do the two distributions compare based on their means?
Answer:
Place ∆ at 63 for New York City and at 64 for Son Francisco. The means are about the same.

Exercise 4.
Describe the variability of the New York City monthly temperatures from the New York City mean.
Answer:
The temperatures are spread out around the mean. The temperatures range from a low of around 39 °F to a high of 85 °F.

Exercise 5.
Describe the variability of the San Francisco monthly temperatures from the San Francisco mean.
Answer:
The temperatures aæ clustered around the mean. The temperatures range from a low of 57 °F to a high of 70 °F.

Exercise 6.
Compare the variability in the two distributions. Is the variability about the same, or is it different? If different, which monthly temperature distribution has more variability? Explain.
Answer:
The variability is different. The variability in New York City is much greater than the variability in San Francisco.

Exercise 7.
If Robert prefers to choose the city where the temperatures vary the least from month to month, which city should he choose? Explain.
Answer:
He should choose San Francisco because the temperatures vary the least, from a low of 57 °F to a high of 70 °F. New York City has temperatures with more variability, from a low of 39°F to o high of 85°F.

Example 3: Considering the Mean and Variability in a Data Distribution

The mean is used to describe a typical value for the entire data distribution. Sabina asks Robert which city he thinks has the better climate. How do you think Robert responds?
Answer:
He responds that they both have about the same mean but that the mean is a better measure or a more precise measure of a typical monthly temperature for San Francisco than it is for New York City.

Sabina is confused and asks him to explain what he means by this statement. How could Robert explain what he means?
Answer:
The temperatures in New York City in the winter months are in the 40’s and in the summer months are in the 80’s. The mean of 63 isn’t very close to those temperatures. Therefore, the mean is not a good indicator of a typical monthly temperature. The mean is a much better indicator of a typical monthly temperature in SanFrancisco because the variability of the temperatures there is much smaller.
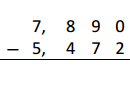
Exercises 8 – 14:

Consider the following two distributions of times it takes six students to get to school in the morning and to go home from school in the afternoon.

Eureka Math Grade 6 Module 6 Lesson 8 Example Answer Key 4

Exercise 8.
To visualize the means and variability, draw a dot plot for each of the two distributions.
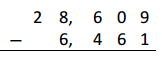
Eureka Math Grade 6 Module 6 Lesson 8 Example Answer Key 5
Answer:
Eureka Math Grade 6 Module 6 Lesson 8 Example Answer Key 6

Eureka Math Grade 6 Module 6 Lesson 8 Example Answer Key 7

Exercise 9.
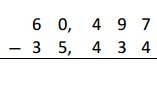
What is the mean time to get from home to school in the morning for these six students?
Answer:
The mean is 14 minutes.

Exercise 10.
What is the mean time to get from school to home in the afternoon for these six students?
Answer:
The mean is 14 minutes.

Exercise 11.
For which distribution does the mean give a more accurate indicator of a typical time? Explain your answer.
Answer:
The morning mean is a more accurate indicator. The spread in the afternoon data is far greater than the spread in the morning data.

Distributions can be ordered according to how much the data values vary around their means. Consider the following data on the number of green jelly beans in seven bags of jelly beans from each of five different candy manufacturers (AllGood, Best, Delight, Sweet, and Vum). The mean in each distribution is 42 green jelly beans.

Eureka Math Grade 6 Module 6 Lesson 8 Example Answer Key 8

Exercise 12.
Draw a dot plot of the distribution of the number of green jelly beans for each of the five candy makers. Mark the location of the mean on each distribution with the balancing A symbol.

Eureka Math Grade 6 Module 6 Lesson 8 Example Answer Key 9

Eureka Math Grade 6 Module 6 Lesson 8 Example Answer Key 10

Answer:
The dot plots should each hove a balancing A symbol located at 42.

Eureka Math Grade 6 Module 6 Lesson 8 Example Answer Key 11

Eureka Math Grade 6 Module 6 Lesson 8 Example Answer Key 12

Eureka Math Grade 6 Module 6 Lesson 8 Example Answer Key 13

Eureka Math Grade 6 Module 6 Lesson 8 Example Answer Key 14

Eureka Math Grade 6 Module 6 Lesson 8 Example Answer Key 15

Exercise 13.
Order the candy manufacturers from the one you think has the least variability to the one with the most variability. Explain your reasoning for choosing the order.
Answer:
Note: Do not be critical; answers and explanations may vary. One possible answer:
In order from least to greatest: All Good, Sweet, Vum, Delight, Best. The data points are all close to the mean for all good, which indicates it has the least variability, followed by Sweet and Yum. The data points are spread farther from the mean for Delight and Best, which indicates they have the greatest variability.

Exercise 14.
For which company would the mean be considered a better indicator of a typical value (based on least variability)?
Answer:
The mean for All Good would be the best indicator of a typical value for the distribution.

Eureka Math Grade 6 Module 6 Lesson 8 Problem Set Answer Key

Question 1.
The number of pockets in the clothes worn by seven students to school yesterday was 4, 1, 3, 4, 2, 2, 5. Today, those seven students each had three pockets in their clothes.

a. Draw one dot plot of the number of pockets data for what students wore yesterday and another dot plot for what students wore today. Be sure to use the same scale.
Answer:
Yesterday
Eureka Math Grade 6 Module 6 Lesson 8 Problem Set Answer Key 16

Today
Eureka Math Grade 6 Module 6 Lesson 8 Problem Set Answer Key 17

b. For each distribution, find the mean number of pockets worn by the seven students. Show the means on the dot plots by using the balancing symbol.
Answer:
The mean of both dot plots is 3.

c. For which distribution is the mean number of pockets a better indicator of what is typical? Explain.
Answer:
There is certainly variability in the data for yesterday’s distribution, whereas today’s distribution has none. The mean of 3 pockets is a better indicator (more precise) for today’s distribution.

Question 2.
The number of minutes (rounded to the nearest minute) it took to run a certain route was recorded for each of five students. The resulting data were 9, 10, 11, 14, and 16 minutes. The number of minutes (rounded to the nearest minute) it took the five students to run a different route was also recorded, resulting in the following data: 6, 8, 12, 15, and 19 minutes.

a. Draw dot plots for the distributions of the times for the two routes. Be sure to use the same scale on both dot plots.
Answer:
First Route
Eureka Math Grade 6 Module 6 Lesson 8 Problem Set Answer Key 18

Second Route
Eureka Math Grade 6 Module 6 Lesson 8 Problem Set Answer Key 19

b. Do the distributions have the same mean? What is the mean of each dot plot?
Answer:
Yes, Both distributions have the same mean, 12 minutes.

c. In which distribution is the mean a better indicator of the typical amount of time taken to run the route? Explain.
Answer:
Looking at the dot plots, the times for the second route are more varied than those for the first route. So, the mean for the first route is a better indicator (more precise) of a typical value.

Question 3.
The following table shows the prices per gallon of gasoline (in cents) at five stations across town as recorded on
Monday, Wednesday, and Friday of a certain week.

DayR&CAl’sPBSam’sAnn’s
Monday359358362359362
Wednesday357365364354360
Friday350350360370370

a. The mean price per day for the five stations is the same for each of the three days. Without doing any calculations and simply looking at Friday’s prices, what must the mean price be?
Answer:
Friday’s prices ore centered at 360 cents. The sum of the distances from 360 for values above 360 is equal to
the sum of the distances from 360 for values below 360, so the mean is 360 cents.

b. For which daily distribution is the mean a better indicator of the typical price per gallon for the five stations? Explain.
Answer:
From the dot plots, the mean for Monday is the best indicator of o typical price because there is the least variability in the Monday prices.

Eureka Math Grade 6 Module 6 Lesson 8 Exit Ticket Answer Key

Question 1.
Consider the following statement: Two sets of data with the same mean will also have the same variability. Do you agree or disagree with this statement? Explain.
Answer:
Answers will vary, but students should disagree with this statement. There are many examples in this lesson that could be used as the basis for an explanation.

Question 2.
Suppose the dot plot on the left shows the number of goals a boys’ soccer team has scored in 6 games so far this
season and the dot plot on the right shows the number of goals a girls’ soccer team has scored in 6 games so far this season.
Eureka Math Grade 6 Module 6 Lesson 8 Exit Ticket Answer Key 20

Eureka Math Grade 6 Module 6 Lesson 8 Exit Ticket Answer Key 21
a. Compute the mean number of goals for each distribution.
Answer:
The mean for each is 3 goals.

b. For which distribution, if either, would the mean be considered a better indicator of a typical value? Explain your answer.
Answer:
Variability in the distribution for girls is less than ¡n the distribution for boys, so the mean of 3 goals for the girls is a better indicator of a typical value.

Eureka Math Grade 6 Module 1 Lesson 29 Answer Key

Engage NY Eureka Math 6th Grade Module 1 Lesson 29 Answer Key

Eureka Math Grade 6 Module 1 Lesson 29 Problem Set Answer Key

Question 1.
Henry has 15 lawns mowed out of a total of 60 lawns. What percent of the lawns does Henry still have to mow?
Answer:
75% of the lawns still need to be mowed.

Question 2.
Marissa got an 85% on her math quiz. She had 34 questions correct. How many questions were on the quiz?
Answer:
There were 40 questions on the quiz.

Question 3.
Lucas read 30% of his book containing 480 pages. What page is he going to read next?
Answer:
30% is 144 pages, so he will read page 145 next.

Eureka Math Grade 6 Module 1 Lesson 29 Exit Ticket Answer Key

Question 1.
Angelina received two discounts on a $50 pair of shoes. The discounts were taken off one after the other. If she paid $30 for the shoes, what was the percent discount for each coupon? Is there only one answer to this question?
Answer:
Original Price $50
Eureka Math Grade 6 Module 1 Lesson 29 Exit Ticket Answer Key 1
20% off $50 = $10 discount. After a 20% off discount, the new price would be $40.
25% off $40 = $10 discount. After a 25% off discount, the new price would be $30.
Therefore, the two discounts could be 20% off and then 25%.
This is not the only answer. She could have also saved 25% and then 20%.

Eureka Math Grade 6 Module 1 Lesson 29 Exploratory Challenge Answer Key

Exploratory Challenge 1.
Claim: To find 10% of a number, ail you need to do is move the decimal to the left once.
Use at least one model to solve each problem (e.g., tape diagram, table, double number line diagram, 10 × 10 grid).

a. Make a prediction. Do you think the claim is true or false? ______________ Explain why.
Answer:
Answers will vary. One could think the claim is true because 10% as a fraction is \(\frac{1}{10}\). The same thing happens when one divides by 10 or multiplies by \(\frac{1}{10}\). A student may think the claim is false because it depends on what whole amount represents the number from which the percentage is taken.

b. Determine 10% of 300. _______________
Answer:
300 × \(\frac{1}{10}=\frac{300}{10}\) = 30

c. Find 10% of 80. _____________
Answer:
80 × \(\frac{1}{10}=\frac{80}{10}\) = 8

d. Determine 10% of 64. ________________
Answer:
64 × \(\frac{1}{10}\) = 6.4

e. Find 10% of 5. _______________
Answer:
5 × \(\frac{1}{10}=\frac{5}{10}=\frac{1}{2}\)

f. 10% of_________________ is 48.
Answer:
Eureka Math Grade 6 Module 1 Lesson 29 Exploratory challenge Answer Key 2
48 × 10 = 480

g. 10% of _________________ is 6.
Answer:
6 × 10 = 60

h. Gary read 34 pages of a 340-page book. What percent did he read?
Answer:
Eureka Math Grade 6 Module 1 Lesson 29 Exploratory challenge Answer Key 3

i. Micah read 16 pages of his book. If this is 10% of the book, how many pages are in the book?
Answer:
Eureka Math Grade 6 Module 1 Lesson 29 Exploratory challenge Answer Key 4
There are 160 pages in the book.

j. Using the solutions to the problems above, what conclusions can you make about the claim?
Answer:
The claim is true. When I find 10% of a number, I am really finding \(\frac{1}{10}\) of the amount or dividing by 10, which is the same as what occurred when I moved the decimal point in the number one place to the left.

Exploratory Challenge 2.

Claim: If an item is already on sale, and then there is another discount taken off the new price, this is the same as taking the sum of the two discounts off the original price.

Use at least one model to solve each problem (e.g., tape diagram, table, double number line diagram, 10 × 10 grid).
a. Make a prediction. Do you think the claim is true or false?______________ Explain.
Answer:
The answer is false. They will be different because when two discounts are taken off, the second discount is taken off a new amount.

b. Sam purchased 3 games for $140 after a discount of 30%. What was the original price?
Answer:
Eureka Math Grade 6 Module 1 Lesson 29 Exploratory challenge Answer Key 5

c. If Sam had used a 20% off coupon and opened a frequent shopper discount membership to save 10%, would the games still have a total of $140?
Answer:
20% = \(\frac{20}{100}=\frac{2}{10}\)                 $200 × \(\frac{2}{10}=\frac{\$ 400}{10}\) = $40 saved. The price after the coupon is $160.
10% = \(\frac{10}{100}=\frac{1}{10}\)                 $160 × \(\frac{1}{10}=\frac{\$ 160}{10}\) = $16 saved. The price after the coupon and discount membership is $144.
No, the games would now total $144.

d. Do you agree with the claim? ______________ Explain why or why not. Create a new example to help support your claim.
Answer:
Do you agree with the claim?   NO    Explain why or why not. Create a new example to help support your claim.
When two discounts are taken off, the shopper pays more than if both were added together and taken off.
Example:
$100 original price
20%:
100 × \(\frac{2}{10}=\frac{200}{10}\) = 20 saved
$100 – $20 = $80 sale price

Two 10% off discounts:
100 × \(\frac{1}{10}=\frac{100}{10}\) = 10
90 × \(\frac{1}{10}=\frac{90}{10}\) = 9
$100 – $10 – $9 = $81 sale price

Eureka Math Grade 6 Module 6 Lesson 7 Answer Key

Engage NY Eureka Math Grade 6 Module 6 Lesson 7 Answer Key

Eureka Math Grade 6 Module 6 Lesson 7 Example Answer Key

Sabina wants to know how long it takes students to get to school. She asks two students how long it takes them to get to school. It takes one student 1 minute and the other student 11 minutes. Sabina represents these data values on a ruler, putting a penny at 1 inch and another at 11 inches.

Sabina thinks that there might be a connection between the mean of two data points and where they balance on a ruler. She thinks the mean may be the balancing point. Sabina shows her data using a dot plot.

Dot plot of Number of Minutes
Eureka Math Grade 6 Module 6 Lesson 7 Example Answer Key 1

Sabina decides to move the penny at 1 inch to 4 inches and the other penny from 11 inches to 8 inches on the ruler, noting that the movement for the two pennies is the same distance but in opposite directions. Sabina thinks that if two data points move the same distance but in opposite directions, the balancing point on the ruler does not change. Do you agree with Sabina?

Sabina continues by moving the penny at 4 inches to 6 inches. To keep the ruler balanced at 6 inches, how far should Sabina move the penny from 8 inches, and in what direction?
Answer:
Since the penny at inches moved two to the right, to maintain the balance, the penny at inches needs to move two inches to the left. Both pennies are now at inches, and the ruler clearly balances there. Note that the mean of these two values (minutes and minutes) is still minutes.

Exercises 1 – 2:

Now it is your turn to try balancing two pennies on a ruler.

Exercise 1.
Tape one penny at 2.5 inches on your ruler.

a. Where should a second penny be taped so that the ruler will balance at 6 inches?
Answer:
The penny should be at 9. 5 inches.

b. How far is the penny at 2. 5 inches from 6 inches? How far is the other penny from 6 inches?
Answer:
Each penny Is 3.5 inches away from 6 inches.

c. Is 6 inches the mean of the two locations of the pennies? Explain how you know this.
Answer:
Yes, the mean of the two locations of the pennies is 6 inches. The distance of the penny that is below 6 inches is equal to the distance to the penny that is above 6 inches.

Exercise 2.
Move the penny that is at 2.5 inches to the right two inches.

a. Where will the penny be placed?
Answer:
The penny will be placed at 4.5 inches.

b. What do you have to do with the other data point (the other penny) to keep the balance point at 6 inches?
Answer:
I will have to move it 2 inches to the left.

c. What is the mean of the two new data points? Is it the same value as the balance point of the ruler?
Answer:
The mean is 6. It is the same value as the balance point of the ruler. (Remember that the ruler might not balance at exactly 6, depending on the accuracy of the placement of the two pennies on the ruler.)

Example 2: Balancing More Than Two Points

Sabina wants to know what happens if there are more than two data points. Suppose there are three students. One student lives 2 minutes from school, and another student lives 9 minutes from school. If the mean time for all three students is 6 minutes, she wonders how long it takes the third student to get to school. Using what you know about distances from the mean, where should the third penny be placed in order for the mean to be 6 inches? Label the diagram, and explain your reasoning.

Eureka Math Grade 6 Module 6 Lesson 7 Example Answer Key 2

Eureka Math Grade 6 Module 6 Lesson 7 Example Answer Key 3

The third penny should be placed at 7 inches. The 7 is 1 inch from 6 inches, and the 9 is 3 inches from 6 inches. Combined, the total distance for these two pennies is 4 inches. Since the distance of the point on the left of 6 inches is also 4 inches, the mean is now 6 inches.

Exercises 3 – 6:

Imagine you are balancing pennies on a ruler.

Exercise 3.
Suppose you place one penny each at 3 inches, 7 inches, and 8 inches on your ruler.

a. Sketch a picture of the ruler. At what value do you think the ruler will balance? Mark the balance point with the symbol ∆.
Answer:
Students should represent the pennies at 3 inches, 7 inches, and 8 inches on the ruler with a balancing point at 6 inches.

Eureka Math Grade 6 Module 6 Lesson 7 Example Answer Key 4

b. What is the mean of 3 inches, 7 inches, and 8 inches? Does your ruler balance at the mean?
Answer:
The mean is 6 inches. Yes, it balances at the mean.

c. Show the information from part (a) on a dot plot. Mark the balance point with the symbol ∆.
Answer:
Eureka Math Grade 6 Module 6 Lesson 7 Example Answer Key 5

d. What are the distances on each side of the balance point? How does this prove the mean is 6?
Answer:
The distance to the left of the mean (the distance between 3 and 6): 3
One of the distances to the right of the mean (the distance between 7 and 6): 1
One of the distances to the right of the mean (the distance between 8 and 6): 2
The total of the distances to the right of the mean: 2 + 1 = 3
The mean is 6 because the total of the distances on either side of 6 is 3.

Exercise 4.
Now, suppose you place a penny each at 7 inches and 9 inches on your ruler.
Eureka Math Grade 6 Module 6 Lesson 7 Example Answer Key 7

a. Draw a dot plot representing these two pennies.
Answer:
Eureka Math Grade 6 Module 6 Lesson 7 Example Answer Key 6

b. Estimate where to place a third penny on your ruler so that the ruler balances at 6 inches, and mark the point on the dot plot above. Mark the balance point with the symbol A.
Answer:
The third penny should be placed of 2 inches.
Eureka Math Grade 6 Module 6 Lesson 7 Example Answer Key 6

c. Explain why your answer in part (b) is true by calculating the distances of the points from 6. Are the totals of the distances on either side of the mean equal?
Answer:
The distance to the left of the mean (the distance between 2 and 6): 4
One of the distances fo the right of the mean (the distance between 7 and 6): 1
One of the distances to the right of the mean (the distance between 9 and 6): 3
The total of the distances to the right of the mean: 3 + 1 = 4
The mean is 6 because the total of the distances on either side of 6 is 4.

Exercise 5.
Is the concept of the mean as the balance point true if you put multiple pennies on a single location on the ruler?
Answer:
Yes. The balancing process is applicable to stacking pennies or having more thon one dato point at the same location on a dot plot. (If students have difficulty seeing this, remind them of the fair share interpretation of the mean using a dot plot, where oil of the dots were stacked up at the mean.)

Exercise 6.
Suppose you place two pennies at 7 inches and one penny at 9 inches on your ruler.
Eureka Math Grade 6 Module 6 Lesson 7 Example Answer Key 8

a. Draw a dot plot representing these three pennies.
Answer:
Eureka Math Grade 6 Module 6 Lesson 7 Example Answer Key 9

b. Estimate where to place a fourth penny on your ruler so that the ruler balances at 6 inches, and mark the point on the dot plot above. Mark the balance point with the symbol.
Answer:
The fourth penny should be placed at 1 inch.
Eureka Math Grade 6 Module 6 Lesson 7 Example Answer Key 9

c. Explain why your answer in part (b) is true by calculating the distances of the points from 6. Are the totals of the distances on either side of the mean equal?
Answer:
The total of the distances to the left of the mean is 5. The total of the distances to the right of the mean can be found by calculating the distance between 7 and 6 twice, since there are two data points at 7, and then adding it to the distance between 9 and 6. Therefore, the total of the distances to the right of the mean is 5 because 1 + 1 + 3 = 5, which is equal to the total of the distances to the left of the mean.

Example 3: Finding the Mean

What if the data on a dot plot were 1, 3, and 8? Will the data balance at 6? If not, what is the balance point, and why?
Eureka Math Grade 6 Module 6 Lesson 7 Example Answer Key 10
The data do not balance at 6. The balance point must be 4 in order for the total of the distances on either side of the mean to be equal.

Exercise 7.
Use what you have learned about the mean to answer the following questions.

Recall from Lesson 6 that Michelle asked ten of her classmates for the number of hours they usually sleep when there is school the next day. Their responses (in hours) were 8, 10, 8, 8, 11, 11,9, 8, 10, 7.

a. It’s hard to balance ten pennies. Instead of actually using pennies and a ruler, draw a dot plot that represents the data set.
Eureka Math Grade 6 Module 6 Lesson 7 Example Answer Key 11
Answer:
Eureka Math Grade 6 Module 6 Lesson 7 Example Answer Key 12

b. Use your dot plot to find the balance point.
Answer:
A balance point of 9 would mean the total of the distances to the left of 9 is 6 because 2 + 1 + 1 + 1 + 1 = 6, and the total of the distances to the right of 9 is 6 because 1 + 1 + 2 + 2 = 6. Since the totals of the distances on each side of the mean are equal, 9 is the balance point. The data point that is directly on 9 has a distance of zero, which does not change the total of the distances to the right or the left of the mean.

Eureka Math Grade 6 Module 6 Lesson 7 Problem Set Answer Key

Question 1.
The number of pockets in the clothes worn by four students to school today is 4, 1, 3, 4.

a. Perform the fair share process to find the mean number of pockets for these four students. Sketch the cube’s representations for each step of the process.
Answer:
Eureka Math Grade 6 Module 6 Lesson 7 Problem Set Answer Key 13
Each of the 4’s gives up a pocket to the person with one pocket, yielding four stacks of three pockets each. The mean is 3 pockets.

b. Find the total of the distances on each side of the mean to show the mean found in part (a) is correct.
Answer:
The mean is correct because the total of the distances to the left of 3 is 2 and the total of the distances to the right of 3 is 2 because 1 + 1 = 2

Question 2.
The times (rounded to the nearest minute) it took each of six classmates to run a mile are 7, 9, 10, 11, 11, and 12 minutes.
a. Draw a dot plot representation for the mile times.
Answer:
Eureka Math Grade 6 Module 6 Lesson 7 Problem Set Answer Key 14

b. Suppose that Sabina thinks the mean is 11 minutes. Is she correct? Explain your answer.
Answer:
Sabina is incorrect. The total of the distances to the left of 11 is 7 and the total of the distances to the right of 11 is 1. The totals of the distances are not equal; therefore, the mean cannot be 11 minutes.

c. What is the mean?
Answer:
For the total of the distances to be equal on either side of the mean, the mean must be 10 because on the left of 10 the total of the distances is 4 because 1 + 3 = 4, and the total of the distances to the right of 10 is 4 because 1 + 1 + 2 = 4.

Question 3.
The prices per gallon of gasoline (in cents) at five stations across town on one day are shown in the following dot plot. The price for a sixth station is missing, but the mean price for all six stations was reported to be 380 cents per gallon. Use the balancing process to determine the price of a gallon of gasoline at the sixth station.

Dot Plot of Price(cents per gallon)
Eureka Math Grade 6 Module 6 Lesson 7 Problem Set Answer Key 15
Answer:
To find the price per gallon of gasoline at the sixth station, we need to assess the distances from 380 of the five current data points and then place the sixth data point to ensure that the total of the distances to the left of the mean equals the total of the distances to the right of the mean.

Currently, the total of the distances to the left of 380 is 15 because 5 + 10 = 15, and the total of the distances to the right of 380 is 18 because 4 + 4 + 10 = 18. For the mean of all six prices to be 380, the total of the distances to the left of 380 needs to be 18. This means we need to place a dot three cents to the left of the mean. 380 – 3 = 377. The sixth price is 377 cents per gallon.

Question 4.
The number of phones (landline and cell) owned by the members of each of nine families is 3, 5, 6, 6, 6, 6, 7, 7, 8.

a. Use the mathematical formula for the mean (determine the sum of the data points, and divide by the number of data points) to find the mean number of phones owned for these nine families.
Answer:
\(\frac{54}{9}\)= 6. The mean is 6 phones.

b. Draw a dot plot of the data, and verify your answer in part (a) by using the balancing process.
Answer:

Eureka Math Grade 6 Module 6 Lesson 7 Problem Set Answer Key 16
The total of the distances to the left of 6 is 4 because 3 + 1 = 4. The total of the distances to the right of 6 is 4 because 1 + 1 + 2 = 4. Since both totals are equal, 6 is the correct mean.

Eureka Math Grade 6 Module 6 Lesson 7 Exit Ticket Answer Key

Question 1.
The dot plot below shows the number of goals scored by a school’s soccer team in 7 games so far this season.

Eureka Math Grade 6 Module 6 Lesson 7 Exit Ticket Answer Key 17
Use the balancing process to explain why the mean number of goals scored is 3.
Answer:
The total of the distances to the left of 3 is 4 because 1+ 3 = 4. The total of the distances to the right of 3 is also 4 because 2 + 2 = 4. Since the totals of the distances on either side of the mean are equal, then 3 must be the mean.

Eureka Math Grade 6 Module 6 Lesson 6 Answer Key

Engage NY Eureka Math Grade 6 Module 6 Lesson 6 Answer Key

Eureka Math Grade 6 Module 6 Lesson 6 Example Answer Key

Recall that in Lesson 3, Robert, a sixth-grader at Roosevelt Middle School, investigated the number of hours of sleep sixth-grade students get on school nights. Today, he is to make a short report to the class on his investigation. Here is his report.

“I took a survey of twenty-nine sixth-graders, asking them, ‘How many hours of sleep per night do you usually get when you have school the next day?’ The first thing I had to do was to organize the data. I did this by drawing a dot plot. Looking at the dot plot, I would say that a typical amount of sleep is 8 or 9 hours.”

Dot plot of number of hours of sleep
Eureka Math Grade 6 Module 6 Lesson 6 Example Answer Key 1

Michelle is Robert’s classmate. She liked his report but has a really different thought about determining the center of the number of hours of sleep. Her idea is to even out the data in order to determine a typical or center value.

Exercises 1 – 6:

Suppose that Michelle asks ten of her classmates for the number of hours they usually sleep when there is school the next day. Suppose they responded (in hours): 8 10 8 8 11 11 9 8 10 7.

Exercise 1.
How do you think Robert would organize this new data? What do you think Robert would say is the center of these ten data points? Why?
Answer:
Robert would use a dot plot to organize his data and would say the center is around 8 hours because it is the most common value.

Exercise 2.
Do you think his value is a good measure to use for the center of Michelle’s data set? Why or why not?
Answer:
Answers will vary. For example, students might say it is a good measure, as most of the values are around 8 hours, or they might say it is not a good measure because half of the values are greater than 8 hours.

The measure of center that Michelle is proposing is called the mean. She finds the total number of hours of sleep for the ten students. That is 90 hours. She has 90 Unifix cubes (Snap cubes). She gives each of the ten students the number of cubes that equals the number of hours of sleep each had reported.

She then asks each of the ten students to connect their cubes in a stack and put their stacks on a table to compare them. She then has them share their cubes with each other until they all have the same number of cubes in their stacks when they are done sharing.

Exercise 3.
Make ten stacks of cubes representing the number of hours of sleep for each of the ten students. Using Michelle’s method, how many cubes are in each of the ten stacks when they are done sharing?
Answer:
There are 9 cubes in each of the 10 stocks.

Exercise 4.
Noting that each cube represents one hour of sleep, interpret your answer to Exercise 3 in terms of number of hours of sleep. What does this number of cubes in each stack represent? What is this value called?
Answer:
If all ten students slept the same number of hours, it would be 9 hours. The 9 cubes for each stack represent the 9 hours of sleep for each student if this was a fair share. This value is called the mean.

Exercise 5.
Suppose that the student who told Michelle he slept 7 hours changes his data value to 8 hours. What does Michelle’s procedure now produce for her center of the new set of data? What did you have to do with that extra cube to make Michelle’s procedure work?
Answer:
The extra cube must be split into 10 equal parts. The mean is now 9\(\frac{1}{10}\).

Exercise 6.
Interpret Michelle’s fair share procedure by developing a mathematical formula that results in finding the fair share value without actually using cubes. Be sure that you can explain clearly how the fair share procedure and the mathematical formula relate to each other.
Answer:
Answers may vary. The fair share procedure is the same as adding all of the data values and dividing by the total number of data values.

Example 2:
Suppose that Robert asked five sixth graders how many pets each had. Their responses were 2, 6, 2, 4, 1. Robert showed the data with cubes as follows:

Eureka Math Grade 6 Module 6 Lesson 6 Example Answer Key 2

Note that one student has one pet, two students have two pets each, one student has four pets, and one student has six pets. Robert also represented the data set in the following dot plot.

Eureka Math Grade 6 Module 6 Lesson 6 Example Answer Key 3

Robert wants to illustrate Michelle’s fair share method by using dot plots. He drew the following dot plot and said that it represents the result of the student with six pets sharing one of her pets with the student who has one pet.

Eureka Math Grade 6 Module 6 Lesson 6 Example Answer Key 4

Robert also represented the dot plot above with cubes. His representation is shown below.

Eureka Math Grade 6 Module 6 Lesson 6 Example Answer Key 5

Exercises 7 – 10:

Now, continue distributing the pets based on the following steps.

Exercise 7.
Robert does a fair share step by having the student with five pets share one of her pets with one of the students with two pets.

a. Draw the cubes representation that shows the result of this fair share step.
Answer:
Eureka Math Grade 6 Module 6 Lesson 6 Example Answer Key 6

b. Draw the plot that shows the result of this fair share step.
Answer:
Eureka Math Grade 6 Module 6 Lesson 6 Example Answer Key 7

Exercise 8.
Robert does another fair share step by having one of the students who has four pets share one pet with one of the students who has two pets.

a.
Draw the cubes representation that shows the result of this fair share step.
Answer:
Eureka Math Grade 6 Module 6 Lesson 6 Example Answer Key 8

b.
Draw the dot plot that shows the result of this fair share step.
Answer:
Eureka Math Grade 6 Module 6 Lesson 6 Example Answer Key 9

Exercise 9.
Robert does a final fair share step by having the student who has four pets share one pet with the student who has
two pets.

a. Draw the cubes representation that shows the resuft of this final fair share step.
Answer:
Eureka Math Grade 6 Module 6 Lesson 6 Example Answer Key 10

b. Draw the dot plot representation that shows the result of this final fair share step.
Answer:
Eureka Math Grade 6 Module 6 Lesson 6 Example Answer Key 11

Exercise 10.
Explain in your own words why the final representations using cubes and a dot plot show that the mean number of pets owned by the five students is 3 pets.
Answer:
The shoring method produces 3 pets for each of the fwe students. The cubes representation shows that after sharing, each student has a fair share of three pets. The dot plot representation should have all of the data points at the same point on the number line, the mean. In this problem, the mean number of pets is 3 for these five students, so there should be five dots above 3 on the horizontal scale.

Eureka Math Grade 6 Module 6 Lesson 6 Problem Set Answer Key

Question 1.
A game was played where ten tennis balls are tossed into a basket from a certain distance. The numbers of successful tosses for six students were 4, 1, 3, 2, 1, 7.

a. Draw a representation of the data using cubes where one cube represents one successful toss of a tennis ball into the basket.
Answer:
Eureka Math Grade 6 Module 6 Lesson 6 Problem Set Answer Key 12

b. Represent the original data set using a dot plot.
Answer:
Eureka Math Grade 6 Module 6 Lesson 6 Problem Set Answer Key 13

Question 2.
Find the mean number of successful tosses for this data set using the fair share method. For each step, show the cubes representation and the corresponding dot plot. Explain each step in words in the context of the problem. You may move more than one successful toss in a step, but be sure that your explanation is clear. You must show two or more steps.
Eureka Math Grade 6 Module 6 Lesson 6 Problem Set Answer Key 14
Answer:
Clearly, there are several ways of getting to the final fair share cubes representation where each of the six stacks contains three cubes. Ideally, students move one cube at a time since, for many students, the leveling is seen more easily in that way. If a student shortcuts the process by moving several cubes at once, that is okay, as long as the graphic representations are correctly done and the explanation is dear. The table below provides one possible representation.
Eureka Math Grade 6 Module 6 Lesson 6 Problem Set Answer Key 15

Question 3.
The numbers of pockets in the clothes worn by four students to school today are 4, 1, 3, and 6. Paige produces the following cubes representation as she does the fair share process. Help her decide how to finish the process now that she has stacks of 3, 3, 3, and 5 cubes.
Eureka Math Grade 6 Module 6 Lesson 6 Problem Set Answer Key 16
Answer:
It should be dear to students that there are two extra cubes in the stack of five cubes. Those two extra cubes need to be distributed among the four students. That requires that each of the extra cubes needs to be split in half to produce four halves. Each of the four students gets half of a pocket to have a fair shore mean of three and one half pockets.

Question 4.
Suppose that the mean number of chocolate chips in 30 cookies is 14 chocolate chips.

a. Interpret the mean number of chocolate chips in terms of fair share.
Answer:
Answers will vary. 1f each of the 30 cookies were to have the same number of chocolate chips, each would have 14 chocolate chips.

b. Describe the dot plot representation of the fair share mean of 14 chocolate chips in 30 cookies.
Answer:
Answers will vary. There should be 30 different dots on the dot plot, all of them stacked up at 14.

Question 5.
Suppose that the following are lengths (in millimeters) of radish seedlings grown ¡n identical conditions for three days: 12 11 12 14 13 9 13 11 13 10 10 14 16 13 11

a. Find the mean length for these 15 radish seedlings.
Answer:
The mean length is 12\(\frac{2}{15}\) mm.

b. Interpret the value from part (a) in terms of the fair share mean length.
Answer:
If each of the 15 radish seedlings were to have the same length, each would have a length of 12\(\frac{2}{15}\) mm.
Note:
Students should realize what the cubes representation for these data would look like but also realize that it may be a little cumbersome to move cubes around in the fair share process. Ideally, they would set up the initial cubes representation and then use the mathematical approach of summing the lengths to be 182 mm, which by division (distributed evenly to 15 plant) would yield 12\(\frac{2}{15}\) mm as the fair share mean length.

Eureka Math Grade 6 Module 6 Lesson 6 Exit Ticket Answer Key

Question 1.
If a class of 27 students had a mean of 72 on a test, interpret the mean of 72 In the sense of a fair share measure of the center of the test scores.
Answer:
Answers will vary. 72 would be the test score that all 27 students would have if all 27 students had the same score.

Question 2.
Suppose that your school’s soccer team has scored a mean of 2 goals in each of 5 games.
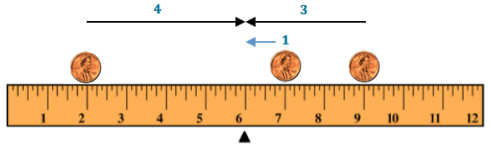
a. Draw a representation using cubes that display that your school’s soccer team has scored a mean of 2 goals in each of 5 games. Let 1 cube stand for 1 goal.
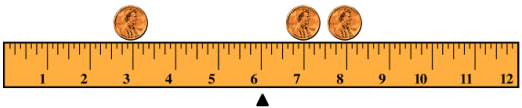

Answer:
Eureka Math Grade 6 Module 6 Lesson 6 Exit Ticket Answer Key 17
Answers will vary. There should be 10 total cubes that are placed in no more than 5 different stacks. One possibility is the one shown here, where each of the 5 stacks contains 2 cubes. However, any set of stacks where 10 cubes are divided into 5 or fewer (assuming that a “missing stack” represents a game in which 0 goals were scored) stacks would have o fair shore (mean) of 2 and would be an acceptable representation.

b. Draw a dot plot that displays that your school’s soccer team has scored a mean of 2 goals in each of 5 games.
Answer:
Eureka Math Grade 6 Module 6 Lesson 6 Exit Ticket Answer Key 18
Answers will vary. One possibility ¡s the one shown here where all five dots are at 2. However, any dot plot that has exactly 5 dots and for which the sum of the values represented by the dot Is 10 would be an acceptable representation of a data set that has a mean of 2.

Eureka Math Grade 6 Module 6 Lesson 4 Answer Key

Engage NY Eureka Math Grade 6 Module 6 Lesson 4 Answer Key

Eureka Math Grade 6 Module 6 Lesson 4 Example Answer Key

Example 1 (5 minutes): Frequency Table with Intervals

The boys’ and girls’ basketball teams at Roosevelt Middle School wanted to raise money to help buy new uniforms. They decided to sell baseball caps with the school logo on the front to family members and other interested fans. To obtain the correct cap size, students had to measure the head circumference (distance around the head) of the adults who wanted to order a cap. The following data set represents the head circumferences, in millimeters (mm), of the adults.

513, 525, 531, 533, 535, 535, 542, 543, 546, 549, 551, 552, 552, 553, 554, 555, 560, 561, 563, 563, 563, 565, 565, 568, 568, 571, 571, 574, 577, 580, 583, 583, 584, 585, 591, 595, 598, 603, 612, 618

The caps come in six sizes: XS, S, M, L, XL, and XXL. Each cap size covers an interval of head circumferences. The cap manufacturer gave students the table below that shows the interval of head circumferences for each cap size. The
interval 510 -< 530 represents head circumferences from 510 mm to 530 mm, not including 530.

Eureka Math Grade 6 Module 6 Lesson 4 Example Answer Key 1

Exercises 1 – 4:

Exercise 1.
What size cap would someone with a head circumference of 570 mm need?
Answer:
Someone with a head circumference of 570 mm would need o large.

Exercise 2.
Complete the tally and frequency columns in the table in Example 1 to determine the number of each size cap students need to order for the adults who wanted to order a cap.
Answer:
Eureka Math Grade 6 Module 6 Lesson 4 Example Answer Key 2

Exercise 3.
What head circumference would you use to describe the center of the data?
Answer:
The head circumferences center somewhere around 550 mm to 570 mm. This corresponds to a cap size of medium. (Answers may vary, but student responses should be around the center of the data distribution.)

Exercise 4.
Describe any patterns that you observe in the frequency column.
Answer:
The numbers start small but increase to 15 and then go back down.

Example 2: Histogram

One student looked at the tally column and said that it looked somewhat like a bar graph turned on its side. A histogram is a graph that is like a bar graph except that the horizontal axis is a number line that is marked off in equal intervals.
To make a histogram:
1. Draw a horizontal line, and mark the intervals.
2. Draw a vertical line, and label it Frequency.
3. Mark the Frequency axis with a scale that starts at 0 and goes up to something that is greater than the largest frequency in the frequency table.
4. For each interval, draw a bar over that interval that has a height equal to the frequency for that interval.

The first two bars of the histogram have been drawn below.
Eureka Math Grade 6 Module 6 Lesson 4 Example Answer Key 3

Exercises 5 – 9:

Exercise 5.
Complete the histogram by drawing bars whose heights are the frequencies for the other intervals.
Answer:
Eureka Math Grade 6 Module 6 Lesson 4 Example Answer Key 4

Exercise 6.
Based on the histogram, describe the center of the head circumferences.
Answer:
The center of the head circumferences is around 560 mm. (Answers may vary, but student responses should be around the center of the data distribution.)

Exercise 7.
How would the histogram change if you added head circumferences of 551 mm and 569 mm to the data set?
Answer:
The bar for the 550 to 570 mm interval would go up to 17.

Exercise 8.
Because the 40 head circumference values were given, you could have constructed a dot plot to display the head circumference data. What information is lost when a histogram is used to represent a data distribution instead of a dot plot?
Answer:
In a dot plot, you can see individual values. In a histogram, you only see the total number of values in an interval.

Exercise 9.
Suppose that there had been 200 head circumference measurements in the data set. Explain why you might prefer to summarize this data set using a histogram rather than a dot plot.
Answer:
There would be too many dots on a dot plot, and it would be hard to read. A histogram would work fora large data set because the frequency scale can be adjusted.

Example 3: Shape of the Histogram

A histogram is useful to describe the shape of the data distribution. It is important to think about the shape of a data distribution because depending on the shape, there are different ways to describe important features of the distribution, such as center and variability.

A group of students wanted to find out how long a certain brand of AA batteries lasted. The histogram below shows the data distribution for how long (in hours) that some AA batteries lasted. Looking at the shape of the histogram, notice how the data mound up around a center of approximately 105 hours. We would describe this shape as mound shaped or symmetric. If we were to draw a line down the center, notice how each side of the histogram is approximately the same, or a mirror image of the other. This means the histogram is approximately symmetrical.

Eureka Math Grade 6 Module 6 Lesson 4 Example Answer Key 5

Another group of students wanted to investigate the maximum drop length for roller coasters. The histogram below shows the maximum drop (in feet) of a selected group of roller coasters. This histogram has a skewed shape. Most of the data are in the intervals from 50 feet to 170 feet. But there is one value that falls in the interval from 290 feet to 330 feet and one value that falls in the interval from 410 feet to 550 feet. These two values are unusual (or not typical) when compared to the rest of the data because they are much greater than most of the data.

Eureka Math Grade 6 Module 6 Lesson 4 Example Answer Key 6

Exercises 10 – 12:

Exercise 10.
The histogram below shows the highway miles per gallon of different compact cars.
Eureka Math Grade 6 Module 6 Lesson 4 Example Answer Key 7
Answer:
Eureka Math Grade 6 Module 6 Lesson 4 Example Answer Key 8

a. Describe the shape of the histogram as approximately symmetric, skewed left, or skewed right.
Answer:
Skewed right toward the larger values.

b. Draw a vertical line on the histogram to show where the typical number of miles per gallon for a compact car would be.
Answer:
The vertical line to show the typical number of miles per gallon would be around 36.

c. What does the shape of the histogram tell you about miles per gallon for compact cars?
Answer:
Most cars get around 31 to 40 mpg. But there was one car that got between 49 and 52 mpg.

Exercise 11.
Describe the shape of the head circumference histogram that you completed in Exercise 5 as approximately symmetric, skewed left, or skewed right.
Answer:
The shape of the histogram is approximately symmetric.

Exercise 12.
Another student decided to organize the head circumference data by changing the width of each interval to be 10 instead of 20. Below is the histogram that the student made.
Eureka Math Grade 6 Module 6 Lesson 4 Example Answer Key 9

a. How does this histogram compare with the histogram of the head circumferences that you completed in Exercise 5?
Answer:
Answers will vary; both histograms have the same general shape and center.

b. Describe the shape of this new histogram as approximately symmetric, skewed left, or skewed right.
Answer:
The shape of this new histogram is approximately symmetric.

c. How many head circumferences are in the interval from 570 to 590 mm?
Answer:
There are 9 head circumferences in the interval from 570 to 590 mm.

d. In what interval would a head circumference of 571 mm be included? In what interval would a head circumference of 610 mm be included?
Answer:
The head circumference of 571 mm is in the interval from 570 to 580 mm. The head circumference of 610 mm is in the interval from 610 to 620 mm.

Eureka Math Grade 6 Module 6 Lesson 4 Problem Set Answer Key

Question 1.
The following histogram summarizes the ages of the actresses whose performances have won in the Best Leading Actress category at the annual Academy Awards (i.e., Oscars).

Eureka Math Grade 6 Module 6 Lesson 4 Problem Set Answer Key 10

a. Which age interval contains the most actresses? How many actresses are represented in that interval?
Answer:
The interval 24 to 32 contains the most actresses. There are 34 actresses whose age falls into that category.

b. Describe the shape of the histogram.
Answer:
The shape of the histogram is skewed to the right.

c. What does the histogram tell you about the ages of actresses who won the Oscar for best actress?
Answer:
Most of the ages are between 24 and 40, with two ages much larger than the rest.

d. Which interval describes the center of the ages of the actresses?
Answer:
The interval of 32 to 40 describes the center of the ages. (Answers may vary, but student responses should be around the center of the data distribution.)

e. An age of 72 would be included in which interval?
Answer:
The age of 72 Is in the interval from 72 to 80.

Question 2.
The frequency table below shows the seating capacity of arenas for NBA basketball teams.
Eureka Math Grade 6 Module 6 Lesson 4 Problem Set Answer Key 11

a. Draw a histogram for the number of seats in the NBA arenas data. Use the histograms you have seen throughout this lesson to help you in the construction of your histogram.
Answer:
Eureka Math Grade 6 Module 6 Lesson 4 Problem Set Answer Key 12

b. What is the width of each interval? How do you know?
Answer:
The width of each interval is 500.
Subtract the values identifying on interval.

c. Describe the shape of the histogram.
Answer:
The shape of the histogram is skewed to the right.

d. Which interval describes the center of the number of seats data?
Answer:
The interval of 19,000 to 19, 500 describes the center. (Answers may vary, but student responses should be around the center of the dota distribution.)

Question 3.
Listed are the grams of carbohydrates in hamburgers at selected fast food restaurants.
33 40 66 45 28 30 52 40 26 42
42 44 33 44 45 32 45 45 52 24

a. Complete the frequency table using the given intervals of width 5.
Eureka Math Grade 6 Module 6 Lesson 4 Problem Set Answer Key 13
Answer:
Eureka Math Grade 6 Module 6 Lesson 4 Problem Set Answer Key 14

b. Draw a histogram of the carbohydrate data.
Answer:
Eureka Math Grade 6 Module 6 Lesson 4 Problem Set Answer Key 15

c. Describe the center and shape of the histogram.
Answer:
The center is around 40; the histogram is mound shaped and approximately symmetric. (Answers may vary, but student responses for describing the center should be around the center of the data distribution.)

d. In the frequency table below, the intervals are changed. Using the carbohydrate data above, complete the
frequency table with intervals of width 10.
Eureka Math Grade 6 Module 6 Lesson 4 Problem Set Answer Key 16
Answer:
Eureka Math Grade 6 Module 6 Lesson 4 Problem Set Answer Key 17

e. Draw a histogram.
Answer:
Eureka Math Grade 6 Module 6 Lesson 4 Problem Set Answer Key 18

Question 4.
Use the histograms that you constructed in Exercise 3 parts (b) and (e) to answer the following questlons.

a. Why are there fewer bars in the histogram in part (e) than the histogram in part (b)?
Answer:
There are fewer bars in part (e) because the width of the interval changed from 5 grams to 10 grams, so there ore fewer intervals.

b. Did the shape of the histogram in pait (e) change from the shape of the histogram in part (b)?
Answer:
Generally, both are approximately symmetric and mound shaped, but the histogram in part (b) has gaps.

c. Did your estimate of the center change from the histogram in part (b) to the histogram in part (e)?
Answer:
The centers of the two histograms ore about the same.

Eureka Math Grade 6 Module 6 Lesson 4 Exit Ticket Answer Key

The frequency table below shows the length of selected movies shown in a local theater over the past six months.
Eureka Math Grade 6 Module 6 Lesson 4 Exit Ticket Answer Key 19

Question 1.
Construct a histogram for the length of movies data.
Eureka Math Grade 6 Module 6 Lesson 4 Exit Ticket Answer Key 20
Answer:
Eureka Math Grade 6 Module 6 Lesson 4 Exit Ticket Answer Key 21

Question 2.
Describe the shape of the histogram.
Answer:
The shape of the histogram is mound-shaped and approximately symmetric.

Question 3.
What does the histogram tell you about the length of movies?
Answer:
Most movie lengths were between 100 and 130 minutes.

Eureka Math Grade 6 Module 6 Lesson 3 Answer Key

Engage NY Eureka Math Grade 6 Module 6 Lesson 3 Answer Key

Eureka Math Grade 6 Module 6 Lesson 3 Example Answer Key

Robert, a sixth-grader at Roosevelt Middle School, usually goes to bed around 10:00 p.m. and gets up around 6:00 a.m. to get ready for school. That means he gets about 8 hours of sleep on a school night. He decided to investigate the statistical question: How many hours per night do sixth graders usually sleep when they have school the next day?
Robert took a survey of 29 sixth graders and collected the following data to answer the question.

7 8 5 9 9 9 7 7 10 10 11 9 8 8 8 12 6 11 10 8 8 9 9 9 8 10 9 9 8

Robert decided to make a dot plot of the data to help him answer his statistical question. Robert first drew a number line and labeled it from 5 to 12 to match the lowest and highest number of hours slept. Robert’s datum is not included.

Eureka Math Grade 6 Module 6 Lesson 3 Example Answer Key 1

He then placed a dot above 7 for the first value in the data set. He continued to place dots above the numbers until each number in the data set was represented by a dot.

Eureka Math Grade 6 Module 6 Lesson 3 Example Answer Key 2

Exercises 1 – 9:

Exercise 1.
Complete Robert’s dot plot by placing a dot above the corresponding number on the number line for each value in the data set. If there is already a dot above a number, then add another dot above the dot already there. Robert’s datum is not included.
Answer:
Eureka Math Grade 6 Module 6 Lesson 3 Example Answer Key 5

Exercise 2.
What are the least and the most hours of sleep reported In the survey of sixth graders?
Answer:
The least number of hours students slept is 5, and the most number of hours slept is 12.

Exercise 3.
What number of hours slept occurred most often in the data set?
Answer:
9 is the most common number of hours that students slept.

Exercise 4.
What number of hours of sleep would you use to describe the center of the data?
Answer:
The center is around 8 or 9. (Answers may vary, but students’ responses should be around the center of the data
distribution.)

Exercise 5.
Think about how many hours of sleep you usually get on a school night. How does your number compare with the number of hours of sleep from the survey of sixth graders?
Answer:
Answers will vary. For example, a student might say that the number of hours she sleeps is similar to what these students reported, or she might say that she generally gets less (or more) sleep than the sixth graders who were
surveyed.

Here are the data for the number of hours the sixth graders usually sleep when they do not have school the next day.
7 8 10 11 5 6 12 13 13 7 9 8 10 12 11 12 8 9 10 11 10 12 11 11 11 12 11 11 10

Exercise 6.
Make a dot plot of the number of hours slept when there is no school the next day.
Answer:
Eureka Math Grade 6 Module 6 Lesson 3 Example Answer Key 6

Exercise 7.
When there is no school the next day, what number of hours of sleep would you use to describe the center of the
data?
Answer:
The center of the data is around 11 hours. (Answers may vary, but student responses should be around the center of the data distribution.)

Exercise 8.
What are the least and most number of hours slept with no school the next day reported in the survey?
Answer:
The least number of hours students sleep is 5, and the most number of hours students sleep is 13.

Exercise 9.
Do students tend to sleep longer when they do not have school the next day than when they do have school the next day? Explain your answer using the data in both dot plots.
Answer:
Yes, because more of the data points are in the 10, 11, 12, and 13 categories in the no school dot plot than in the have school dot plot.

Example 2: Building and Interpreting a Frequency Table

A group of sixth-graders investigated the statistical question, “How many hours per week do sixth graders spend playing a sport or an outdoor game?”

Here are the data students collected from a sample of 26 sixth graders showing the number of hours per week spent playing a sport or a game outdoors.

3 2 0 6 3 3 3 1 1 2 2 8 12 4 4 4 3 3 1 1 0 0 6 2 3 2

To help organize the data, students summarized the data in a frequency table. A frequency table lists possible data values and how often each value occurs.

To build a frequency table, first make three columns. Label one column “Number of Hours Playing a Sport/Game,” label the second column “Tally,” and label the third column “Frequency.” Since the least number of hours was 0 and the most was 12, list the numbers from 0 to 12 in the “Number of Hours” column.

Eureka Math Grade 6 Module 6 Lesson 3 Example Answer Key 3

Exercises 10 – 15:

Exercise 10.
Complete the tally mark column in the table created in Example 2.
Answer:
Eureka Math Grade 6 Module 6 Lesson 3 Example Answer Key 4

Exercise 11.
For each number of hours, find the total number of tally marks, and place this in the frequency column in the table created in Example 2.
Answer:
Eureka Math Grade 6 Module 6 Lesson 3 Example Answer Key 4

Exercise 12.
Make a dot plot of the number of hours playing a sport or playing outdoors.
Answer:
Eureka Math Grade 6 Module 6 Lesson 3 Example Answer Key 7

Exercise 13.
What number of hours describes the center of the data?
Answer:
The center of data is around 3. (Answers may vary, but student responses should be around the center of the data distribution.)

Exercise 14.
How many of the sixth graders reported that they spend eight or more hours a week playing a sport or playing
outdoors?
Answer:
Only 2 sixth graders reported they spent 8 or more hours a week playing a sport or playing outdoors.

Exercise 15.
The sixth graders wanted to answer the question, “How many hours do sixth graders spend per week playing a sport or playing an outdoor game?” Using the frequency table and the dot plot, how would you answer the sixth graders’ question?
Answer:
Most sixth graders spend about Z to 4 hours per week playing a sport or playing outdoors.

Eureka Math Grade 6 Module 6 Lesson 3 Problem Set Answer Key

Question 1.
The data below are the number of goals scored by a professional indoor soccer team over its last 23 games.
8 16 10 9 11 11 10 15 16 11 15 13 8 9 11 9 8 11 16 15 10 9 12

a. Make a dot plot of the number of goals scored.
Answer:
Eureka Math Grade 6 Module 6 Lesson 3 Problem Set Answer Key 8

b. What number of goals describes the center of the data?
Answer:
The center of the data is around 11 or 12. (Answers may vary, but student responses should be around the center of the data distribution.)

c. What is the least and most number of goals scored by the team?
Answer:
The least number of goals scored is 8, and 16 is the most.

d. Over the 23 games played, the team lost 10 games. Circle the dots on the plot that you think represent the games that the team lost. Explain your answer.
Answer:
Students will most likely circle the lowest 10 scores, but answers may vary. Students need to supply on explanation in order to defend their answers.

Question 2.
A sixth grader rolled two number cubes 21 times. The student found the sum of the two numbers that he rolled each time. The following are the sums for the 21 rolls of the two number cubes.
9 2 4 6 5 7 8 11 9 4 6 5 7 7 8 8 7 5 7 6 6

a. Complete the frequency table.
Eureka Math Grade 6 Module 6 Lesson 3 Problem Set Answer Key 9
Answer:
Eureka Math Grade 6 Module 6 Lesson 3 Problem Set Answer Key 10

b. What sum describes the center of the data?
Answer:
7

c. What sum occurred most often for these 21 rolls of the number cubes?
Answer:
7

Question 3.
The dot plot below shows the number of raisins in 25 small boxes of raisins.
Eureka Math Grade 6 Module 6 Lesson 3 Problem Set Answer Key 11

a. Complete the frequency table.
Eureka Math Grade 6 Module 6 Lesson 3 Problem Set Answer Key 13
Answer:
Eureka Math Grade 6 Module 6 Lesson 3 Problem Set Answer Key 12

b. Another student opened up a box of raisins and reported that It had 63 raisins. Do you think that this student had the same size box of raisins? Why or why not?
Answer:
I think the student did not have the same size box because the 21 small boxes opened had at most 54 raisins, and 63 is too high.

Eureka Math Grade 6 Module 6 Lesson 3 Exit Ticket Answer Key

A biologist collected data to answer the question, “How many eggs do robins lay?”

The following is a frequency table of the data she collected:
Eureka Math Grade 6 Module 6 Lesson 3 Exit Ticket Answer Key 14

Question 1.
Complete the frequency column.
Answer:
Eureka Math Grade 6 Module 6 Lesson 3 Exit Ticket Answer Key 15

Question 2.
Draw a dot plot of the data on the number of eggs a robin lays.
Answer:
Eureka Math Grade 6 Module 6 Lesson 3 Exit Ticket Answer Key 16

Question 3.
What number of eggs describe the center of the data?
Answer:
The center of the data is around 3. (Answer may vary, but student responses should be around the center of the data distribution.)

Eureka Math Grade 6 Module 6 Lesson 2 Answer Key

Engage NY Eureka Math Grade 6 Module 6 Lesson 2 Answer Key

Eureka Math Grade 6 Module 6 Lesson 2 Example Answer Key

Example 1: Heart Rate

Mia, a sixth-grader at Roosevelt Middle School, was thinking about joining the middle school track team. She read that Olympic athletes have lower resting heart rates than most people. She wondered about her own heart rate and how it would compare to other students. Mia was interested in investigating the statistical question: What are the heart rates of students in my sixth-grade class?

Heart rates are expressed as beats per minute (or bpm). Mia knew her resting heart rate was 80 beats per minute. She asked her teacher if she could collect the heart rates of the other students in her class. With the teacher’s help, the other sixth graders in her class found their heart rates and reported them to Mia. The following numbers are the resting heart rates (in beats per minute) for the 22 other students in Mia’s class.
89 87 85 84 90 79 83 85 86 88 84 81 88 85 83 83 86 82 83 86 82 84.

Exercises 1 – 10:

Exercise 1.
What was the heart rate for the student with the lowest heart rate?
Answer:
79 bpm

Exercise 2.
What was the heart rate for the student with the highest heart rate?
Answer:
90 bpm

Exercise 3.
How many students had a heart rate greater than 86 bpm?
Answer:
5

Exercise 4.
What fraction of students had a heart rate less than 82 bpm?
Answer:
\(\frac{2}{22}\) or \(\frac{1}{11}\)

Exercise 5.
What heart rate occurred most often?
Answer:
83 bpm

Exercise 6.
What heart rate describes the center of the data?
Answer:
85 bpm (Answers will vary, but student responses should be around 84 bpm or 85 bpm.)

Exercise 7.
Some students had heart rates that were unusual in that they were quite a bit higher or quite a bit lower than most other students’ heart rates. What heart rates would you consider unusual?
Answer:
Answers will vary and could include 79 bpm. 81 bpm. 87 bpm, 88 bpm,. 89 bpm. and/or 90 bpm.

Exercise 8.
If Mia’s teacher asked what the typical heart rate is for sixth graders in the class, what would you tell Mia’s teacher?
Answer:
Answers will vary, but expect answers between 82 bpm and 86 bpm.

Exercise 9.
Remember that Mia’s heart rate was 80 bpm. Add a dot for Mia’s heart rate to the dot plot in Example 1.
Answer:
Add o dot above 80 bpm on the number line.

Exercise 10.
How does Mia’s heart rate compare with the heart rates of the other students in the class?
Answer:
Her heart rate ¡s lower than all but one of the students.

Example 2: Seeing the Spread in Dot Plots.

Mia’s class collected data to answer several other questions about her class. After collecting the data, they drew dot
plots of their findings. One student collected data to answer the question: How many textbooks are in the desks or lockers of sixth graders? She made the following dot plot, not including her data.

Dot Plot of Number of Textbooks
Eureka Math Grade 6 Module 6 Lesson 2 Example Answer Key 1

Another student in Mia’s class wanted to ask the question: How tall are the sixth graders in our class?
This dot plot shows the heights of the sixth graders in Mia’s class, not including the datum for the student conducting the
survey.
Dot Plot of Height
Eureka Math Grade 6 Module 6 Lesson 2 Example Answer Key 2

Exercises 11 – 14:

Below are four statistical questions and four different dot plots of data collected to answer these questions. Match each statistical question with the appropriate dot plot, and explain each choice.

Statistical Questions:

Exercise 11.
What are the ages of fourth-graders in our school?
Answer:
Dot plot A because most fourth-graders are around 9 or 10 years old.

Exercise 12.
What are the heights of the players on the eighth-grade boys’ basketball team?
Answer:
Dot plot D because the players on an eighth-grade basketball team can vary in height. Generally, there ¡s a tall
player (73 inches), while most others are between 5 feet, or 60 inches, and 5 feet 4 inches, or 64 inches.

Exercise 13.
How many hours of W do sixth graders in our class watch on a school night?
Answer:
Dot plot B; explanations will vary. For example, a student might say, “I think a few of the students may watch a lot
of W. Most students watch two hours or less.”

Exercise 14.
How many different languages do students ¡n our class speak?

Eureka Math Grade 6 Module 6 Lesson 2 Example Answer Key 3

Eureka Math Grade 6 Module 6 Lesson 2 Example Answer Key 4

Eureka Math Grade 6 Module 6 Lesson 2 Example Answer Key 5

Eureka Math Grade 6 Module 6 Lesson 2 Example Answer Key 6

Answer:
Dot plot C because most students know one language, English. Many students in our class also study another language or live in an environment where their families speak another language.

Eureka Math Grade 6 Module 6 Lesson 2 Problem Set Answer Key

Question 1.
The dot plot below shows the vertical jump height (in inches) of some NBA players. A vertical jump height is how high a player can jump from a standstill.

Dot Plot of Vertical Jump
Eureka Math Grade 6 Module 6 Lesson 2 Problem Set Answer Key 7

a. What statistical question do you think could be answered using these data?
Answer:
What are the vertical jump heights of NBA players?

b. What was the highest vertical jump by a player?
Answer:
43 inches

c. What was the lowest vertical jump by a player?
Answer:
32 inches

d. What is the most common vertical jump height (the height that occurred most often)?
Answer:
38 inches

e. How many players jumped the most common vertical jump height?
Answer:
10

f. How many players jumped higher than 40 inches?
Answer:
3

g. Another NBA player jumped 33 inches. Add a dot for this player on the dot plot. How does this player compare with the other players?
Answer:
Add another dot above 33. This player jumped the same os two other players and jumped higher than only
one player.

Question 2.
Below are two statistical questions and two different dot plots of data collected to answer these questions. Match each statistical question with its dot plot, and explain each choice.
Statistical Questions:

a. What is the number of fish (if any) that students in a class have in an aquarium at their homes?
Answer:
A; some students may not have any fish (O from the dot plot), while another student has 10 fish.

b. How many days out of the week do the children on my street go to the playground?
Dot Plot A
Eureka Math Grade 6 Module 6 Lesson 2 Problem Set Answer Key 8

Dot Plot B
Eureka Math Grade 6 Module 6 Lesson 2 Problem Set Answer Key 9
Answer:
B; the dot plot displays the values 2, 3, 4, 5, and 6, which are all reasonable within the context of the question.

Question 3.
Read each of the following statistical questions. Write a description of what the dot plot of the data collected to
answer the question might look like. Your description should include a description of the spread of the data and the center of the data.

a. What is the number of hours sixth graders are in school during a typical school day?
Answer:
Most students are in school for the same number of hours, so the spread would be smalL Differences may exist for those students who might have doctor’s appointments or who participate in a club or an afterschool activity. Student responses vary based on their estimates of the number of hours students spend in schooL

b. What is the number of video games owned by the sixth graders in our class?
Answer:
These data would have a very big spread. Some students might have no video games, while others could have a large number of games. A typical value of 5 (or something similar) would identify a center. In this case, the center is based on the number most commonly reported by students.

Eureka Math Grade 6 Module 6 Lesson 2 Exit Ticket Answer Key

A sixth-grade class collected data on the number of letters in the first names (name lengths) of all the students in class. Here is the dot plot of the data they collected:
Eureka Math Grade 6 Module 6 Lesson 2 Exit Ticket Answer Key 10

Question 1.
How many students are in the class?
Answer:
There are 25 students in the class.

Question 2.
What is the shortest name length?
Answer:
The shortest name length is 3 letters.

Question 3.
What is the longest name length?
Answer:
The longest name length is 9 letters.

Question 4.
What name length occurs most often?
Answer:
The most common name length is 6 letters.

Question 5.
What name length describes the center of the data?
Answer:
The name length that describes the center of the data is 6 letters. (Answers may vary, but student responses should be around 6.)

Eureka Math Grade 6 Module 1 Lesson 23 Answer Key

Engage NY Eureka Math 6th Grade Module 1 Lesson 23 Answer Key

Eureka Math Grade 6 Module 1 Lesson 23 Example Answer Key

Example 1: Fresh-Cut Grass
Suppose that on a Saturday morning you can cut 3 lawns in 5 hours, and your friend can cut 5 lawns in 8 hours. Who is cutting lawns at a faster rate?
Eureka Math Grade 6 Module 1 Lesson 23 Example Answer Key 1
Answer:
\(\frac{24}{40}<\frac{25}{40}\) My friend is a little faster but only \(\frac{1}{40}\) of a lawn per hour, so it is very close. The unit rates have corresponding decimals 0.6 and 0.625.

Example 2: Restaurant Advertising
Eureka Math Grade 6 Module 1 Lesson 23 Example Answer Key 2
Answer:
Eureka Math Grade 6 Module 1 Lesson 23 Example Answer Key 3

Example 3: Survival of the Fittest
Eureka Math Grade 6 Module 1 Lesson 23 Example Answer Key 4
Answer:
Eureka Math Grade 6 Module 1 Lesson 23 Example Answer Key 5
The cheetah runs faster.

Example 4: Flying Fingers
Eureka Math Grade 6 Module 1 Lesson 23 Example Answer Key 6
Answer:
Eureka Math Grade 6 Module 1 Lesson 23 Example Answer Key 7

Eureka Math Grade 6 Module 1 Lesson 23 Problem Set Answer Key

Question 1.
Who walks at a faster rate: someone who walks 60 feet in 10 seconds or someone who walks 42 feet in 6 seconds?
Answer:
Eureka Math Grade 6 Module 1 Lesson 23 Problem Set Answer Key 8

Question 2.
Who walks at a faster rate: someone who walks 60 feet in 10 seconds or someone who takes 5 seconds to walk 25 feet? Review the lesson summary before answering.
Answer:
Eureka Math Grade 6 Module 1 Lesson 23 Problem Set Answer Key 9

Question 3.
Which parachute has a slower decent: a red parachute that falls 10 feet in 4 seconds or a blue parachute that falls 12 feet in 6 seconds?
Answer:
Eureka Math Grade 6 Module 1 Lesson 23 Problem Set Answer Key 10

Question 4.
During the winter of 2012 – 2013, Buffalo, New York received 22 inches of snow in 12 hours. Oswego, New York received 31 inches of snow over a 15-hour period. Which city had a heavier snowfall rate? Round your answers to the nearest hundredth.
Answer:
Eureka Math Grade 6 Module 1 Lesson 23 Problem Set Answer Key 11

Question 5.
A striped marlin can swim at a rate of 70 miles per hour. Is this a faster or slower rate than a sailfish, which takes 30 minutes to swim 40 miles?
Answer:
Marlin: 70 mph → Slower

Salfish:
Eureka Math Grade 6 Module 1 Lesson 23 Problem Set Answer Key 12

Question 6.
One math student, John, can solve 6 math problems in 20 minutes while another student, Juaquine, can solve the same 6 math problems at a rate of 1 problem per 4 minutes. Who works faster?
Answer:
Eureka Math Grade 6 Module 1 Lesson 23 Problem Set Answer Key 13

Eureka Math Grade 6 Module 1 Lesson 23 Exit Ticket Answer Key

Question 1.
A sixth-grade math teacher can grade 25 homework assignments in 20 minutes.
Is he working at a faster rate or slower rate than grading 36 homework assignments in 30 minutes?
Answer:
Eureka Math Grade 6 Module 1 Lesson 23 Exit Ticket Answer Key 14
It is faster to grade 25 assignments in 20 minutes.