Eureka Math Grade 7 Module 5 Lesson 16 Answer Key

Engage NY Eureka Math 7th Grade Module 5 Lesson 16 Answer Key

Eureka Math Grade 7 Module 5 Lesson 16 Example Answer Key

Example 2: Using Random Numbers to Select a Sample
The histogram indicates the differences in the number of words in the collection of 150 books. How many words are typical for a best-selling children’s book? Answering this question would involve collecting data, and there would be variability in those data. This makes the question a statistical question. Think about the 150 books used to create the histogram on the previous page as a population. How would you go about collecting data to determine the typical number of words for the books in this population?

How would you choose a random sample from the collection of 150 books discussed in this lesson?

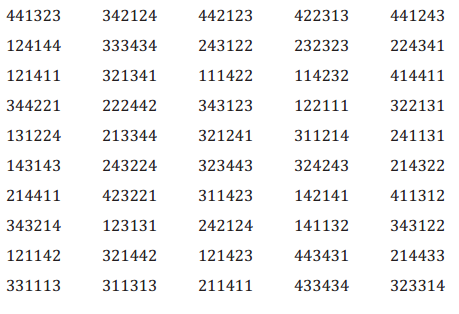
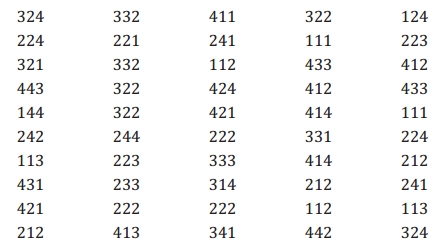
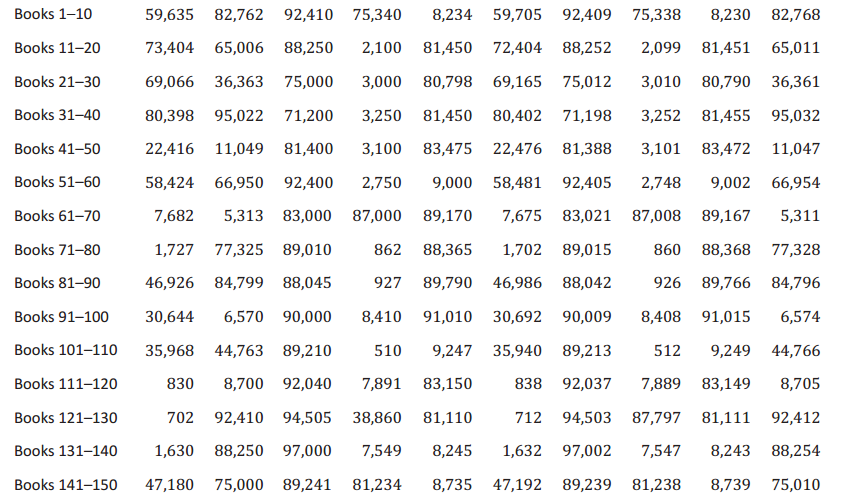
The data for the number of words in the 150 best-selling children’s books are listed below. Select a random sample of the number of words for 10 books.
Engage NY Math 7th Grade Module 5 Lesson 16 Example Answer Key 1
Answer:
Sample response: I would add up all of the words in the 150 books and divide by 150. This would be the mean number of words for the 150 books. As the data distribution is not symmetrical, I could also find the median of the 150 books, as it would be a good description of the typical number of words. (Note: Discuss with students that using data for all 150 books is very tedious. As a result, students may indicate that selecting a random sample of the 150 books might be a good way to learn about the number of words in these children’s books.)

Sample response: I would make 150 slips of paper that contained the names of the books. I would then put the slips of paper in a bag and select 10 or 15 books. The number of pages of the books selected would be my sample.

If necessary, explain how to use ten numbers selected from a bag that contains the numbers from 1 to 150 to select the books for the sample.

If students need more direction in finding a random sample, develop the following example: Consider the following random numbers obtained by drawing slips from a bag that contained the numbers 1 to 150: {114,65,77,38,86,105,50,1,56,85}. These numbers represent the randomly selected books. To find the number of words in those books, order the random numbers {1,38,50,56,75,77,85,86,105,114}. Count from left to right across the first row of the list of the number of words, then down to the second row, and so on. The sample consists of the 1st element in the list, the 38th, the 50th, and so on.

Use the above example of random numbers to help students connect the random numbers to the books selected and to the number of words in those books.
→ What number of words corresponds to the book identified by the random number 1?
59,635; the 1st children’s book listed has 59,635 words.

→ What number of words corresponds to the book identified by the random number 38?
3,252; the 38th children’s book listed has 3,252 words.

Eureka Math Grade 7 Module 5 Lesson 16 Exercise Answer Key

Exercises 1–2

Exercise 1.
From the table, choose two books with which you are familiar, and describe their locations in the data distribution shown in the histogram.
Answer:
Answers will vary. Sample response: I read The Mouse and the Motorcycle, and that has 22,416 words. It is below the median number of words and may be below the lower quartile. Harry Potter and the Chamber of Secrets has 84,799 words. It is one of the books with lots of words but may not be in the top quarter for the total number of words.

Exercise 2.
Put dots on the number line below that you think would represent a random sample of size 10 from the number of words distribution above.

Engage NY Math Grade 7 Module 5 Lesson 16 Exercise Answer Key 1
Answer:
Answers will vary. The sample distribution might have more values near the maximum and minimum than in the center.

Exercises 3–6

Exercise 3.
Follow your teacher’s instructions to generate a set of 10 random numbers. Find the total number of words corresponding to each book identified by your random numbers.
Answer:
Answers will vary. Sample response: I generated random numbers 123, 25, 117, 119, 93, 135, 147, 69, 48, 46, which produces the sample 94505, 80798, 92037, 83149, 90000, 8245, 89239, 89167, 3101, 22476.

Exercise 4.
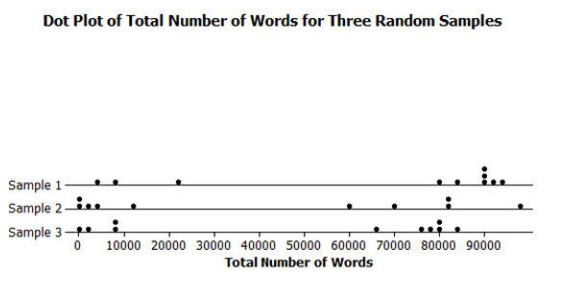
Choose two more different random samples of size 10 from the data, and make a dot plot of each of the three samples.
Answer:
Answers will vary. One possible response is displayed below.
Engage NY Math Grade 7 Module 5 Lesson 16 Exercise Answer Key 2

Exercise 5.
If your teacher randomly chooses 10 books from your summer vacation reading list, would you be likely to get many books with a lot of words? Explain your thinking using statistical terms.
Answer:
Answers will vary. Sample response: From my samples, it looks like I probably would get at least one book that had over 90,000 words because the maximum in each of the samples approached or exceeded 90,000 words. The three samples vary a lot, probably because the sample size is only 10. The median numbers of words for the three samples were about 86,000, 35,000, and 70,000, respectively, so it seems like at least half of the books would contain about 50,000 or more words.

Exercise 6.
If you were to compare your samples to your classmates’ samples, do you think your answer to Exercise 5 would change? Why or why not?
Answer:
Answers will vary. Sample response: The sample size is pretty small, so different samples might be different. I still think that I would have to read some books with a lot of words because of the shape of the population distribution.

Exercises 7–9: A Statistical Study of Balance and Grade

Exercise 7.
Is the following question a statistical question: Do sixth graders or seventh graders tend to have better balance?
Answer:
Yes, this is a statistical question because the data collected would vary between sixth and seventh graders.

Exercise 8.
Berthio’s class decided to measure balance by finding out how long people can stand on one foot.
a. How would you rephrase the question from Exercise 7 to create a statistical question using this definition of balance? Explain your reasoning.
Answer:
a. Answers will vary. Sample response: What is the typical length of time that a seventh grader can balance on one foot? The data collected to answer this question will have some variability—1 min., 2 min., 2 min. 10 sec., and so on. So, it is also a statistical question.

b. What should the class think about to be consistent in how they collect the data if they actually have people stand on one foot and measure the time?
Answer:
Sample response: Would it make a difference if students stood on their right feet or on their left? How high do they have to hold their feet off the ground? Can they do it barefoot or with shoes on? Would tennis shoes be better than shoes with higher heels? What can we use to measure the time?

Exercise 9.
Work with your class to devise a plan to select a random sample of sixth graders and a random sample of seventh graders to measure their balance using Berthio’s method. Then, write a paragraph describing how you will collect data to determine whether there is a difference in how long sixth graders and seventh graders can stand on one foot. Your plan should answer the following questions:
a. What is the population? How will samples be selected from the population? Why is it important that they be random samples?
Sample response: The populations will be all of the sixth graders and all of the seventh graders in our school. To get a random sample, we will find the number of sixth graders, say 62, and generate a list of 15 random numbers from the set 1 to 62, that is, {4,17,19,25,…}. Then, we will go into one classroom and count off the students beginning with 1 and use student 4, 17, and 19. Then we will go into the next classroom and count off the students beginning where we left off in the first room and so on. We will do the same for the seventh graders. This will give random samples because it offers every sixth and seventh grader the same chance of being selected (if using this plan with both grades).

b. How would you conduct the activity?
Answer:
Sample response: Students will stand for as long as they can using whichever foot they choose in their stocking or bare feet with their eyes open. We will time them to the nearest second using stopwatches from our science class. We will have students do the activity one at a time out in the hall so they cannot see each other.

c. What sample statistics will you calculate, and how will you display and analyze the data?
Answer:
Sample response: The sample statistics will be the mean time (in seconds) standing on one foot for the sixth graders and seventh graders. We will make a dot plot of the times for the sixth graders and for the seventh graders using parallel number lines with the same scale.

d. What would you accept as evidence that there actually is a difference in how long sixth graders can stand on one foot compared to seventh graders?
Answer:
We will compare the shape, center, and spread of the sample distributions of times for the sixth graders and do the same for the seventh graders. If the mean times are fairly close together and the spreads not that different, there is not really evidence to say one group of students has better balance.

Eureka Math Grade 7 Module 5 Lesson 16 Problem Set Answer Key

Question 1.
The suggestions below for how to choose a random sample of students at your school were made and vetoed. Explain why you think each was vetoed.
a. Use every fifth person you see in the hallway before class starts.
Answer:
Students who are not in the hallway because they have a class in another part of the building would not have a chance to be selected, so the sample would not be a random sample.

b. Use all of the students taking math the same time that your class meets.
Answer:
The students not taking math at that time would not have a chance of being selected, so the sample would not be a random sample.

c. Have students who come to school early do the activity before school starts.
Answer:
The sample would be not be a random sample because some students would not be able to get to school early, so they could not be selected.

d. Have everyone in the class find two friends to be in the sample.
Answer:
Choosing people that members of the class know would not be a random sample because people that members of the class do not know have no chance to be chosen.

Question 2.
A teacher decided to collect homework from a random sample of her students rather than grading every paper every day.
a. Describe how she might choose a random sample of five students from her class of 35 students.
Answer:
Sample response: You could assign each student a number from 1 to 35, generate five random numbers from 1 to 35, and choose the corresponding students.

b. Suppose every day for 75 days throughout an entire semester she chooses a random sample of five students. Do you think some students will never get selected? Why or why not?
Answer:
Sample response: Over that many days, it should almost even out. If you think about 375 numbers generated all together with each number from 1 to 35 having an equal chance of showing up each time, then each number should be in the overall set about 10 or 11 times. I generated 75 random samples of numbers from 1 to 35 and looked at how the numbers showed up. Every number from 1 to 35 showed up at least three times, and most of the numbers showed up about 10 or 11 times.

Question 3.
Think back to earlier lessons in which you chose a random sample. Describe how you could have used a random number generator to select a random sample in each case.
a. A random sample of the words in the poem “Casey at the Bat”
Answer:
Sample response: You could have generated the random numbers from 1 to 26 for the block of words and the random numbers 1 to 20 to choose a word in the block. Or you could number all of the words from 1 to 520 and then generate random numbers between 1 and 520 to choose the words.

b. A random sample of the grocery prices on a weekly flyer
Answer:
Sample response: Instead of cutting out all of the prices and putting them in a bag, you could just number them on the flyer and use the random number generator to select numbers to identify the items in the sample and use the price of those items.

Question 4.
Sofia decided to use a different plan for selecting a random sample of books from the population of 150 top-selling children’s books from Example 2. She generated ten random numbers between 1 and 100,000 to stand for the possible number of pages in any of the books. Then, she found the books that had the number of pages specified in the sample. What would you say to Sofia?
Answer:
Sample response: She would have to reject the numbers in the sample that referred to pages that were not in her list of 150 books. For example, if she gets the random numbers 4 or 720, she would have to generate new numbers because no books on the list had either 4 or 720 pages. She would have to throw out a lot of random numbers that did not match the number of pages in the books in the list.

It would take her a long time. But if there were no two books that had the same total number of words in the population, it would be a random sample if she wanted to do it that way. However, because there are quite a few books that have the same number of words as other books in the population, this method would not work for selecting a random sample of the books.

Question 5.
Find an example from a newspaper, a magazine, or another source that used a sample. Describe the population, the sample, the sample statistic, how you think the sample might have been chosen, and whether or not you think the sample was random.
Answer:
Responses will vary depending on the articles students find. For example, “an estimated 60% of the eligible children in Wisconsin did not attend preschool in 2009.” The population would be all of the children in Wisconsin eligible for preschool in 2009, and the sample would be the ones selected by the study. The sample statistic would be 60%. The article did not tell how the sample was chosen but said the source was from the Census Bureau, so it was probably a random sample.

Eureka Math Grade 7 Module 5 Lesson 16 Exit Ticket Answer Key

Question 1.
Name two things to consider when you are planning how to select a random sample.
Answer:
Answers will vary.

  • What it means to be a random sample—that everyone in the population has the same chance to be selected.
  • Is there a way to use a random number generator to make it easier to select the sample?

Question 2.
Consider a population consisting of the 200 seventh graders at a particular middle school. Describe how you might select a random sample of 20 students from a list of the students in this population.
Answer:
Answers will vary. Number the students on the list from 001 to 200. Using a random number generator, get 20 different random numbers between 001 and 200, and then select the students corresponding to those numbers on the list. It would also be correct for a student to say that she would write the 200 names on slips of paper, put them in a bag, mix them well, and then select 20 names from the bag.

Eureka Math Grade 7 Module 5 Lesson 15 Answer Key

Engage NY Eureka Math 7th Grade Module 5 Lesson 15 Answer Key

Eureka Math Grade 7 Module 5 Lesson 15 Exercise Answer Key

Exercises 1–5: Sampling Pennies

Exercise 1.
Do you think different random samples from the same population will be fairly similar? Explain your reasoning.
Answer:
Most of the samples will probably be about the same because they come from the same distribution of pennies in the jar. They are random samples, so we expect them to be representative of the population.

Exercise 2.
The plot below shows the number of years since being minted (the penny age) for 150 pennies that JJ had collected over the past year. Describe the shape, center, and spread of the distribution.
Engage NY Math Grade 7 Module 5 Lesson 15 Exercise Answer Key 1
Answer:
The distribution is skewed with many of the pennies minted fairly recently. The minimum is 0, and the maximum is about 54 years since the penny was minted. Thinking about the mean as a balance point, the mean number of years since a penny in this population was minted seems like it would be about 18 years.

Exercise 3.
Place ten dots on the number line that you think might be the distribution of a sample of 10 pennies from the jar.
Engage NY Math Grade 7 Module 5 Lesson 15 Exercise Answer Key 2
Answer:
Answers will vary. Most of the ages in the sample will be between 0 and 25 years. The maximum might be somewhere between 40 and 54.
Engage NY Math Grade 7 Module 5 Lesson 15 Exercise Answer Key 5

Exercise 4.
Select a random sample of 10 pennies, and make a dot plot of the ages. Describe the distribution of the penny ages in your sample. How does it compare to the population distribution?
Answer:
Answers will vary. Sample response: The median is about 21 years. Two of the pennies were brand new, and one was about 54 years old. The distribution was not as skewed as I thought it would be based on the population distribution.

Exercise 5.
Compare your sample distribution to the sample distributions on the board.
a. What do you observe?
b. How does your sample distribution compare to those on the board?
Answer:
a. Answers will vary. Sample response: Most of them seem to have the same minimum, 0 years, but the maximums vary from about 35 to 54 years. Overall, the samples look fairly different: One median is at 25, but several are less than 10. All but two of the distributions seem to be skewed like the population (i.e., with more of the years closer to 0 than to the larger number of years).

b. Answers will vary. Sample response: It is pretty much the same as Sample 3, with some values at 0, and the maximum is 45 years. The median is around 25 years.

Exercises 6–9: Grocery Prices and Rounding
Exercise 6.
Look over some of the grocery prices for this activity. Consider the following statistical question: “Do the store owners price the merchandise with cents that are closer to a higher dollar value or a lower dollar value?” Describe a plan that might answer that question that does not involve working with all 100 items.
Answer:
Sample response: I would place all of the items in a bag. The prices in the bag represent the population. I would begin by selecting items from the bag and record the prices of each item I select. I would get a sample of at least
10 items.

Exercise 7.
Do the store owners price the merchandise with cents that are closer to a higher dollar value or a lower dollar value? To investigate this question in one situation, you will look at some grocery prices in weekly flyers and advertising for local grocery stores.
a. How would you round $3.49 and $4.99 to the nearest dollar?
b. If the advertised price was three for $4.35, how much would you expect to pay for one item?
c. Do you think more grocery prices will round up or round down? Explain your thinking.
Answer:
a. $3.49 would round to $3.00, and $4.99 would round to $5.00.
b. $1.45.
c. Sample response: Prices such as $3.95 or $1.59 are probably chosen because people might focus on the dollar portion of the price and consider the prices to be lower than they actually are when really the prices are closer to the next higher dollar amount.

Exercise 8.
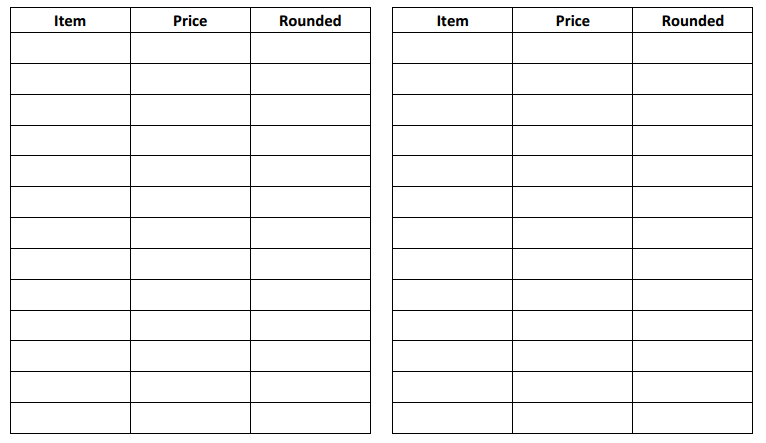
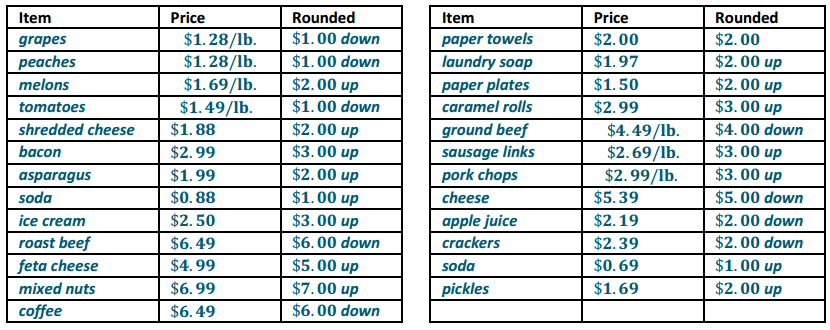
Follow your teacher’s instructions to cut out the items and their prices from the weekly flyers and put them in a bag. Select a random sample of 25 items without replacement, and record the items and their prices in the table below.
Engage NY Math Grade 7 Module 5 Lesson 15 Exercise Answer Key 3
Answer:
(Possible responses are shown in the table.)
Engage NY Math Grade 7 Module 5 Lesson 15 Exercise Answer Key 6

Example of chart suggested:
Engage NY Math Grade 7 Module 5 Lesson 15 Exercise Answer Key 4

Exercise 9.
Round each of the prices in your sample to the nearest dollar, and count the number of times you rounded up and the number of times you rounded down.
a. Given the results of your sample, how would you answer the question: Are grocery prices in the weekly ads at the local grocery closer to a higher dollar value or a lower dollar value?
b. Share your results with classmates who used the same flyer or ads. Looking at the results of several different samples, how would you answer the question in part (a)?
c. Identify the population, sample, and sample statistic used to answer the statistical question.
d. Bettina says that over half of all the prices in the grocery store will round up. What would you say to her?
Answer:
a. Answers will vary. Sample response: In our sample, we found 16 out of 25, or 64%, of the prices rounded to the higher value, so the evidence seems to suggest that more prices are set to round to a higher dollar amount than to a lower dollar amount.

b. Answers will vary. Sample response: Different samples had between 54% and 70% of the prices rounded to a higher value, so they all seem to support the notion that the prices typically are not set to round to a lower dollar amount.

c. Answers will vary. Sample response: The population was the set of all items in the grocery store flyer or ads that we cut up and put in the bag, the sample was the set of items we drew out of the bag, and the sample statistic was the percent of the prices that would be rounded up.

d. Answers will vary. Sample response: While she might be right, we cannot tell from our work. The population we used was the prices in the ad or flyer. These may be typical of all of the store prices, but we do not know because we never looked at those prices.

Eureka Math Grade 7 Module 5 Lesson 15 Problem Set Answer Key

Question 1.
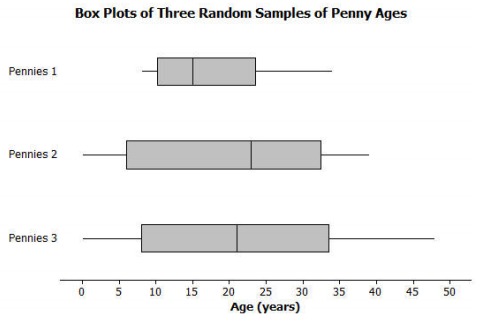
Look at the distribution of years since the pennies were minted from Example 1. Which of the following box plots seem like they might not have come from a random sample from that distribution? Explain your thinking.
Eureka Math 7th Grade Module 5 Lesson 15 Problem Set Answer Key 1
Answer:
Sample response: Given that the original distribution had a lot of ages that were very small, the Pennies 1 sample seems like it might not come from that population. The middle half of the ages are close together with a small interquartile range (about 12 years). The other two samples both have small values and a much larger IQR than the Pennies 1 sample, which both seem more likely to happen in a random sample given the spread of the original data.

Question 2.
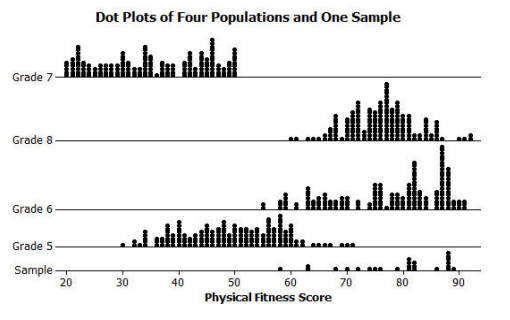
Given the following sample of scores on a physical fitness test, from which of the following populations might the sample have been chosen? Explain your reasoning.
Eureka Math 7th Grade Module 5 Lesson 15 Problem Set Answer Key 2
Answer:
Sample response: These sample values were not in Grades 5 or 7, so the sample could not have come from those grades. It could have come from either of the other two grades (Grades 6 or 8). The sample distribution looks skewed like Grade 6, but the sample size is too small to be sure.

Question 3.
Consider the distribution below:
Eureka Math 7th Grade Module 5 Lesson 15 Problem Set Answer Key 3
a. What would you expect the distribution of a random sample of size 10 from this population to look like?
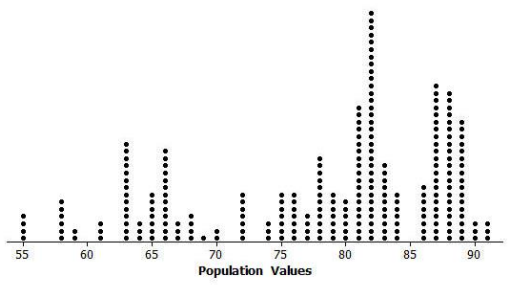
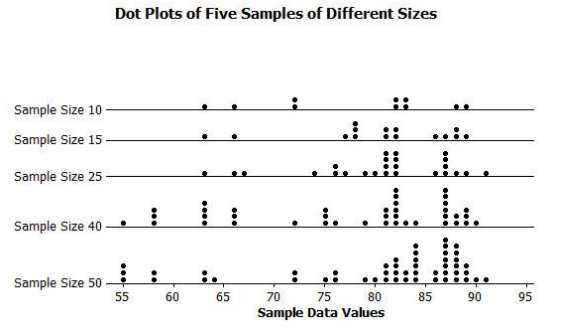
b. Random samples of different sizes that were selected from the population in part (a) are displayed below. How did your answer to part (a) compare to these samples of size 10?
Eureka Math 7th Grade Module 5 Lesson 15 Problem Set Answer Key 4
c. Why is it reasonable to think that these samples could have come from the above population?
d. What do you observe about the sample distributions as the sample size increases?
Answer:
a. Sample response: The samples will probably have at least one or two elements between 80 and 90 and might go as low as 60. The samples will vary a lot, so it is hard to tell.
b. Sample response: My description was pretty close.
c. Sample response: Each of the samples is centered about where the population is centered, although this is easier to see with a larger sample size. The spread of each sample also looks like the spread of the population.
d. Sample response: As the sample size increases, the sample distribution more closely resembles the population distribution.

Question 4.
Based on your random sample of prices from Exercise 6, answer the following questions:
a. It looks like a lot of the prices end in 9. Do your sample results support that claim? Why or why not?
b. What is the typical price of the items in your sample? Explain how you found the price and why you chose that method.
Answer:
a. Sample response: Using the prices in the random sample, about 84% of them end in a 9. The results seem to support the claim.
b. Sample response: The mean price is $2.50, and the median price is $2.00. The distribution of prices seems slightly skewed to the right, so I would probably prefer the median as a measure of the typical price for the items advertised.

Question 5.
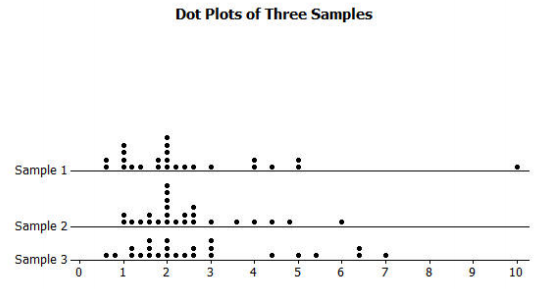
The sample distributions of prices for three different random samples of 25 items from a grocery store are shown below.
a. How do the distributions compare?
Eureka Math 7th Grade Module 5 Lesson 15 Problem Set Answer Key 5
b. Thomas says that if he counts the items in his cart at that grocery store and multiplies by $2.00, he will have a pretty good estimate of how much he will have to pay. What do you think of his strategy?
Answer:
a. Sample response: The samples are slightly skewed right. They all seem to have a mean around $2.50 and a median around $2.00. Sample 1 has one item that costs a lot more than the others. Most of the prices vary from a bit less than $1.00 to around $5.00.

b. Answers will vary. Sample response: Looking at the three distributions, $2.00 is about the median, so half of the items cost less than $2.00, and half cost more, but that does not tell how much they cost. The mean would be a better estimate of the total cost because the mean is calculated in a way that is similar to how Thomas wants to estimate the total cost. In this case, the mean (or balance point) of the distributions looks like it is about $2.50, so he would have a better estimate of the total cost if he multiplied the number of items by $2.50.

Eureka Math Grade 7 Module 5 Lesson 15 Exit Ticket Answer Key

Identify each as true or false. Explain your reasoning in each case.
Question 1.
The values of a sample statistic for different random samples of the same size from the same population will be the same.
Answer:
False. By chance, the samples will have different elements, so the values of the summary statistics may be different.

Question 2.
Random samples from the same population will vary from sample to sample.
Answer:
True. Each element has the same chance of being selected, and you cannot tell which ones will be chosen; it could be any combination.

Question 3.
If a random sample is chosen from a population that has a large cluster of points at the maximum, the sample is likely to have at least one element near the maximum.
Answer:
True. If many of the elements are near the same value, it seems the chance of getting one of those elements in a random sample would be high.

Eureka Math Grade 7 Module 5 Lesson 14 Answer Key

Engage NY Eureka Math 7th Grade Module 5 Lesson 14 Answer Key

Eureka Math Grade 7 Module 5 Lesson 14 Exercise Answer Key

Exercises 1–2: What Is Random?

Exercise 1.
Write down a sequence of heads/tails you think would typically occur if you tossed a coin 20 times. Compare your sequence to the ones written by some of your classmates. How are they alike? How are they different?
Answer:
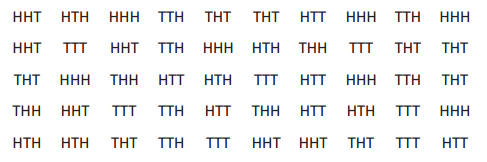
Students might notice a lot of variability in the sequences. Most students will have at the most two heads or two tails in a row, and few will have more than one streak of three or more. Responses might look like the following:
H T H T H T H T H T H T H T H T H T H T
T T H T H T T H T T T H H T H T H H T T

H T H H T H H T H H T H H T H H T H H T
H H T H T T H T H T T H T H T T H T H H

Exercise 2.
Working with a partner, toss a coin 20 times, and write down the sequence of heads and tails you get.
a. Compare your results with your classmates’.
b. How are your results from actually tossing the coin different from the sequences you and your classmates wrote down?
c. Toni claimed she could make up a set of numbers that would be random. What would you say to her?
Answer:
a. Students should notice that streaks of three or more heads and tails typically appear twice in the 20 tosses.
T T H T H H H H T T T T H T H H H T H T
H T H H H H H T T H T T H H T T T H T T

T H H T T T T H H T H T H T T T H T T H
H T T T H H T H T H T T T T H T H T H H

b. The results are different because when we generated the sequence, we did not have a lot of heads or tails in a row.
c. She could try, but she would probably not have some of the characteristics that a real set of random numbers would have, such as three consecutive numbers or four even numbers in a row.

Exercises 3–11: Length of Words in the Poem “Casey at the Bat”

Exercise 3.
Suppose you wanted to learn about the lengths of the words in the poem “Casey at the Bat.” You plan to select a sample of eight words from the poem and use these words to answer the following statistical question: On average, how long is a word in the poem? What is the population of interest here?
Answer:
The population of interest is all of the words in the poem.

Exercise 4.
Look at the poem “Casey at the Bat” by Ernest Thayer, and select eight words you think are representative of words in the poem. Record the number of letters in each word you selected. Find the mean number of letters in the words you chose.
Answer:
Answers will vary. Sample response: The words their, while, thousand, ball, bat, strike, muscles, and grow would have a mean of 5.25 letters.

Exercise 5.
A random sample is a sample in which every possible sample of the same size has an equal chance of being chosen. Do you think the set of words you wrote down was random? Why or why not?
Answer:
Answers will vary. Sample response: I thought it was random because I tried to use some little words and some long ones.

Exercise 6.
Working with a partner, follow your teacher’s instructions for randomly choosing eight words. Begin with the title of the poem, and count a hyphenated word as one word.
a. Record the eight words you randomly selected, and find the mean number of letters in those words.
b. Compare the mean of your random sample to the mean you found in Exercise 4. Explain how you found the mean for each sample.
Answer:
a. Sample response: We drew group 1, 12 (nine); group 1, 18 (four); group 5, 7 (seemed); group 3, 17 (in); group 23, 6 (fraud); group 27, 11 (is); group 27, 10 (air); group 16, 16 (close). The mean length of the words was 3.875.

b. Sample response: The mean of the sample from Exercise 4 is based on the length of eight words I selected. The mean of the sample in this exercise is the mean of eight words randomly selected using the method of drawing numbers to represent the group number and word number. Anticipate that for most students, the mean from the random sample is lower than the mean for the self-selected sample.

Exercise 7.
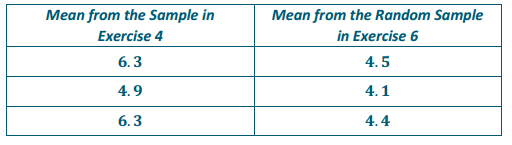
As a class, compare the means from Exercise 4 and the means from Exercise 6. Your teacher will provide a chart to compare the means. Record your mean from Exercise 4 and your mean for Exercise 6 on this chart.
Engage NY Math Grade 7 Module 5 Lesson 14 Exercise Answer Key 1
Answer:
Organize the responses in a table posted in the front of the class. Have students add their means to the poster. Consider the following example:
Engage NY Math Grade 7 Module 5 Lesson 14 Exercise Answer Key 2

Exercise 8.
Do you think the means from Exercise 4 or the means from Exercise 6 are more representative of the mean of all of the words in the poem? Explain your choice.
Answer:
Sample response: The means in the random sample seem to be similar. As a result, I think the means from the random sample are more representative of the words in the poem.

Exercise 9.
The actual mean of the words in the poem “Casey at the Bat” is 4.2 letters. Based on the fact that the population mean is 4.2 letters, are the means from Exercise 4 or means from Exercise 6 a better representation of the mean of the population? Explain your answer.
Answer:
Sample response: The means from the random samples are similar and are closer to the mean of 4.2. Also, the means from Exercise 4 are generally larger than the mean of the population.

Exercise 10.
How did the population mean of 4.2 letters compare to the mean of your random sample from Exercise 6 and to the mean you found in Exercise 4?
Answer:
Sample response: The mean number of letters in all of the words in the poem is 4.2, which is about four letters per word, and the mean of my random sample, 3.875, was also about four letters per word. The mean of my sample in Exercise 4 was about five letters per word.

Exercise 11.
Summarize how you would estimate the mean number of letters in the words of another poem based on what you learned in the above exercises.
Answer:
Sample response: Students should summarize a process similar to what they did in this lesson. They may simply indicate that they would number each word in the poem. They would make slips of paper from 1 to the number of words in the poem, place the slips of paper in a bag or jar, and select a sample of eight or more slips of paper. Students would then record the number of letters in the words identified by the slips of paper. As in the exercises, the mean of the sample would be used to estimate the mean of all of the words in the poem.

Eureka Math Grade 7 Module 5 Lesson 14 Problem Set Answer Key

Question 1.
Would any of the following provide a random sample of letters used in the text of the book Harry Potter and the Sorcerer’s Stone by J.K. Rowling? Explain your reasoning.
a. Use the first letter of every word of a randomly chosen paragraph.
b. Number all of the letters in the words in a paragraph of the book, cut out the numbers, and put them in a bag. Then, choose a random set of numbers from the bag to identify which letters you will use.
c. Have a family member or friend write down a list of his favorite words, and count the number of times each of the letters occurs.
Answer:
a. This is not a random sample. Some common letters, like u, do not appear very often as the first letter of a word and may tend to be underrepresented in the sample.
b. This would give you a random sample of the letters.
c. This would not be a random sample. He might like words that rhyme or that all start with the same letter. The list might also include words not in the book.

Question 2.
Indicate whether the following are random samples from the given population, and explain why or why not.
a. Population: All students in school; the sample includes every fifth student in the hall outside of class.
b. Population: Students in your class; the sample consists of students who have the letter s in their last names.
c. Population: Students in your class; the sample is selected by putting their names in a hat and drawing the sample from the hat.
d. Population: People in your neighborhood; the sample includes those outside in the neighborhood at 6:00 p.m.
e. Population: Everyone in a room; the sample is selected by having everyone toss a coin, and those that result in heads are the sample.
Answer:
a. Sample response: No. Not everyone in school would be in our hall before class. Our hall only has sixth graders in it, so the seventh and eighth graders would not have a chance to be chosen.
b. Sample response: No. Students who do not have the letter s in their last names would not have a chance to be chosen.
c. Sample response: Yes. Everyone would have the same chance to be chosen.
d. Sample response: No. People who are not in the neighborhood at that time have no chance of being selected.
e. Sample response: Yes. Everyone would have the same chance to be chosen.

Question 3.
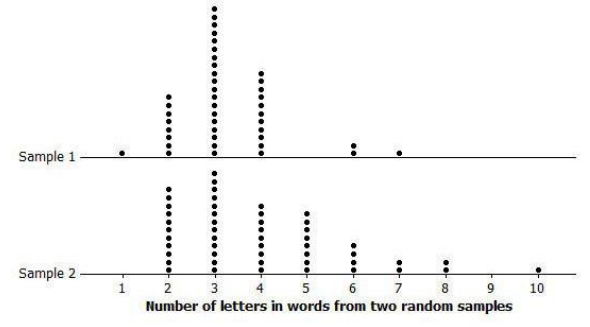
Consider the two sample distributions of the number of letters in randomly selected words shown below:
Eureka Math 7th Grade Module 5 Lesson 14 Problem Set Answer Key 1
a. Describe each distribution using statistical terms as much as possible.
b. Do you think the two samples came from the same poem? Why or why not?
Answer:
a. Answers will vary; the top distribution seems to have both a median and balance point, or mean, at 3, with a minimum of 1 letter in a word and a maximum of 7 letters. Most of the words in the sample were 2 to 4 letters long. The bottom distribution seems more skewed with the median of about 4 letters. The smallest number of letters was 2, and the largest was 10 letters. Most of the letters in this sample had between 2 and 5 letters.

b. Sample response: The samples could have come from the same poem, but the distributions seem different both with respect to shape and to measure of center, so it seems more likely that they were from two different populations.

Question 4.
What questions about samples and populations might you want to ask if you saw the following headlines in a newspaper?
a. “Peach Pop is the top flavor according to 8 out of 10 people.”
b. “Candidate X looks like a winner! 10 out of 12 people indicate they will vote for Candidate X.”
c. “Students overworked. Over half of 400 people surveyed think students spend too many hours on homework.”
d. “Action/adventure was selected as the favorite movie type by an overwhelming 75% of those surveyed.”
Answer:
a. Sample response: How were the people selected? How many people were surveyed? What were the choices, and how many did not like Peach Pop?
b. Sample response: How was the sample chosen? Were the people selected at random, or were they friends of Candidate X?
c. Sample response: Who was surveyed, and how were they selected? Was the survey given to students in a school?
d. Sample response: Was the survey given at a movie theater showing an action/adventure movie where people were there because they like that kind of movie?

Eureka Math Grade 7 Module 5 Lesson 14 Exit Ticket Answer Key

Question 1.
Write down three things you learned about taking a sample from the work we have done today.
Answer:
A random sample is one where every element in the set has an equal chance of being selected.
When people just choose a sample they think will be random, it will usually be different from a real random sample.
Random samples are usually similar to the population.

Eureka Math Grade 7 Module 5 Lesson 13 Answer Key

Engage NY Eureka Math 7th Grade Module 5 Lesson 13 Answer Key

Eureka Math Grade 7 Module 5 Lesson 13 Exercise Answer Key

Exercises 1–4: Collecting Data

Exercise 1.
Describe what you would do if you had to collect data to investigate the following statistical questions using either a sample statistic or a population characteristic. Explain your reasoning in each case.
a. How might you collect data to answer the question, “Does the soup taste good?”
b. How might you collect data to answer the question, “How many movies do students in your class see in a month?”
c. How might you collect data to answer the question, “What is the median price of a home in our town?”
d. How might you collect data to answer the question, “How many pets do people own in my neighborhood?”
e. How might you collect data to answer the question, “What is the typical number of absences in math classes at your school on a given day?”
f. How might you collect data to answer the question, “What is the typical life span of a particular brand of flashlight battery?”
g. How might you collect data to answer the question, “What percentage of girls and of boys in your school have a curfew?”
h. How might you collect data to answer the question, “What is the most common blood type of students in my class?”
Answer:
a. Taste a teaspoon of soup to check the seasoning.
b. Ask students to write down how many movies they have seen that month, and collect their responses.
c. Find the price of homes listed in the newspaper, and use those data to estimate the median price. Another option is to go to a realty office and get prices for the homes they have listed for sale.

d. Answers might vary depending on where students live. Students living in urban areas with high-rise apartment buildings might ask some people on each floor of the building, unless it is not a pet-friendly building, or people as they go to work in the morning; those living in suburban or rural areas might go door-to-door and ask their neighbors.

e. Ask each math teacher how many students were absent in each of her math classes for a given day.
f. Put some batteries of a particular brand in flashlights, and time how long they last.

g. Ask all students if they have a curfew. Note: Students may find it challenging to ask everyone in the school the question (especially students at large schools). Let students describe how they could use a sample (for example, asking a group of students selected at random from the school directory) to answer the question.

h. Ask students in my class about their blood type.

A population is the entire set of objects (e.g., people, animals, and plants) from which data might be collected. A sample is a subset of the population. Numerical summary values calculated using data from an entire population are called population characteristics. Numerical summary values calculated using data from a sample are called statistics.

Exercise 2.
For which of the scenarios in Exercise 1 did you describe collecting data from a population and which from a sample?
Answer:
Answers will vary depending on the responses. Students should indicate that data on how the soup tastes, median home cost, number of pets, and battery life might be collected from a sample. Data on the average number of movies, number absent from math classes, and most common blood type might be collected from the population.

Exercise 3.
Think about collecting data in the scenarios above. Give at least two reasons you might want to collect data from a sample rather than from the entire population.
Answer:
If you used the whole population, you might use it all up like in the soup and batteries examples. In some cases, a sample can give you all of the information you need. For instance, you only need a sample of soup to determine if the soup in the pot is good because it is the same all the way through. Sometimes it is too hard to collect the data for an entire population. It might cost too much or take too long to ask everyone in a population.

Exercise 4.
Make up a result you might get in response to the situations in Exercise 1, and identify whether the result would be based on a population characteristic or a sample statistic.
a. Does the soup taste good?
b. How many movies do students in your class see in a month?
c. What is the median price of a home in our town?
d. How many pets do people own in my neighborhood?
e. What is the typical number of absences in math classes at your school on a given day?
f. What is the typical life span of a particular brand of flashlight battery?
g. What percentage of girls and of boys in your school have a curfew?
h. What is the most common blood type of students in my class?
Answer:
a. “Yes, but it needs more salt.” The spoonful of soup would be similar to a statistic. (Although it is not really a “statistic,” it is based on a sample, so in that way it is like a statistic.)
b. The mean number of movies was 5; population characteristic
c. $150,000; sample statistic
d. 1 pet; either a population characteristic or a sample statistic (depending on the method used to collect the data)
e. 4 absences (mean or median representing typical); population characteristic
f. 54 hours; sample statistic
g. 65% of the girls and 58% of the boys have a curfew; either a population characteristic or sample statistic depending on the method of collecting data
h. Type O+ is the most common, with 42% of the class having O+; the class is the population, so the 42% would be a population characteristic. (It could be possible to think of the class as a sample of all seventh graders, and then it would be a sample statistic.)

Exercise 5: Population or Sample?
Indicate whether the following statements are summarizing data collected to answer a statistical question from a population or from a sample. Identify references in the statement as population characteristics or sample statistics.
a. 54% of the responders to a poll at a university indicated that wealth needed to be distributed more evenly among people.
b. Does talking on mobile phones while driving distract people? Researchers measured the reaction times of
38 study participants as they talked on mobile phones and found that the average level of distraction from their driving was rated 2.25 out of 5.
c. Did most people living in New York in 2010 have at least a high school education? Based on the data collected from all New York residents in 2010 by the U.S. Census Bureau, 84.6% of people living in New York had at least a high school education.
d. Were there more deaths than births in the United States between July 2011 and July 2012? Data from a health service agency indicated that there were 2% more deaths than births in the United States during that time frame.
e. What is the fifth best-selling book in the United States? Based on the sales of books in the United States, the fifth best-selling book was Oh, the Places You’ll Go! by Dr. Seuss.
Answer:
a. The population would be all students attending the university; poll respondents would be a sample, not the population. 54% would be a sample statistic.
b. The study participants would be a sample. All drivers would be the population; the 2.25 out of 5 would be a sample statistic.
c. The population is all of the people living in New York in 2010; the 84.6% would be a population characteristic.

d. This is a good question to discuss with students. The population would be all people in the United States, but the data probably came from a sample of the population. If necessary, point out to students that a nearly complete census of the United States did not occur in 2011 or 2012; the 2% would be a sample statistic. (Although obtaining the number of births and deaths out of everyone in the United States would be possible for 2011 or 2012, it would be very difficult and is generally done when a national census is conducted.)

e. The population would be a list of all best-selling books in the United States (using some subjective benchmark for “best”); the number of copies sold for each book would need to be known to determine the fifth best-selling book, so this is a population characteristic.

Exercises 6–8: A Census
Exercise 6.
When data are collected from an entire population, it is called a census. The United States takes a census of its population every ten years, with the most recent one occurring in 2010. Go to http://www.census.gov to find the history of the U.S. census.
a. Identify three things that you found to be interesting.
b. Why is the census important in the United States?
Answer:
a. Students might suggest (1) the idea of a census dates back to ancient Egyptian times; (2) the U.S. Constitution mandates a census every 10 years; (3) the first censuses only counted the number of men; and (4) until 1950, all of the counting was done manually.
b. According to the Constitution, the census is important for taxation purposes and in determining the number of representatives each state has in the House of Representatives. Other reasons might include planning for things such as roads and schools.

Exercise 7.
Go to the site: www.census.gov/2010census/popmap/ipmtext.php?fl=36.
Select the state of New York.
a. How many people were living in New York for the 2010 census?
b. Estimate the ratio of those 65 and older to those under 18 years old. Why is this important to think about?
c. Is the ratio a population characteristic or a statistic? Explain your thinking.
Answer:
a. 19,378,102 people
b. The ratio is 2,627,943 to 4,324,929 or about 2.6 to 4.3. It is important because when there are a greater number of older people than younger people, there are fewer workers than people who have to be supported.
c. The ratio is a population characteristic because it is based on data from the entire population of New York State.

Exercise 8.
The American Community Survey (ACS) takes samples from a small percentage of the U.S. population in years between the censuses. (www.census.gov/acs/www/about_the_survey/american_community_survey/)
a. What is the difference between the way the ACS collects information about the U.S. population and the way the U.S. Census Bureau collects information?
b. In 2011, the ACS sampled workers living in New York about commuting to work each day. Why do you think these data are important for the state to know?
c. Suppose that from a sample of 200,000 New York workers, 32,400 reported traveling more than an hour to work each day. From this information, statisticians determined that between 16% and 16.4% of the workers in the state traveled more than an hour to work every day in 2011. If there were 8,437,512 workers in the entire population, about how many traveled more than an hour to work each day?
d. Reasoning from a sample to the population is called making an inference about a population characteristic. Identify the statistic involved in making the inference in part (c).

The data about traveling time to work suggest that across the United States typically between 79.8% and 80% of commuters travel alone, 10% to 10.2% carpool, and 4.9% to 5.1% use public transportation. Survey your classmates to find out how a worker in their families gets to work. How do the results compare to the national data? What might explain any differences?
Answer:
a. The ACS obtains its results from a small percentage of the U.S. population, while the Census Bureau attempts to obtain its results from the entire population.
b. In order to plan for the best ways to travel, communities need to know how many people are using the roads, which roads, whether they travel by public transportation, and so on.
c. Between about 1,350,002 and 1,383,752 people
d. The sample statistic is \(\frac{32,400}{200,000}\), or 16.2%.

e. Answers will vary. Reasons for the differences largely depend on the type of community in which students live. Those living near a large metropolitan area, such as Washington, D.C., or New York City, may have lots of commuters using public transportation, while those living in other areas, such as Milwaukee, WI, do not have many public transportation options.

Eureka Math Grade 7 Module 5 Lesson 13 Problem Set Answer Key

Question 1.
The lunch program at Blake Middle School is being revised to align with the new nutritional standards that reduce calories and increase servings of fruits and vegetables. The administration decided to do a census of all students at Blake Middle School by giving a survey to all students about the school lunches.
http://frac.org/federal-foodnutrition-programs/school-breakfast-program/school-meal-nutrition-standards

a. Name some questions that you would include in the survey. Explain why you think those questions would be important to ask.
b. Read through the paragraph below that describes some of the survey results. Then, identify the population characteristics and the sample statistics.

About \(\frac{3}{4}\) of the students surveyed eat the school lunch regularly. The median number of days per month that students at Blake Middle School ate a school lunch was 18 days. 36% of students responded that their favorite fruit is bananas. The survey results for Tanya’s seventh-grade homeroom showed that the median number of days per month that her classmates ate lunch at school was 22, and only 20% liked bananas. The fiesta salad was approved by 78% of the group of students who tried it, but when it was put on the lunch menu, only 40% of the students liked it. Of the seventh graders as a whole, 73% liked spicy jicama strips, but only 2 out of 5 of all the middle school students liked them.
Answer:
a. Answers will vary. Possibilities include the following: How often do you eat the school lunch? Do you ever bring your lunch from home? What is your favorite food? Would you eat salads if they were served? What do you drink with your lunch? What do you like about our lunches now? What would you change? Explanations would vary but might include the need to find out how many students actually eat school lunch and if the lunches were different, would more students eat school lunch? What types of food should be served so more people will eat it?

b. Population characteristics: \(\frac{3}{4}\) eat school lunch; the median number of days is 18; 36% like bananas; 40% liked fiesta salad; 2 out of 5 liked spicy jicama strips.
Sample statistics: Tanya’s homeroom median number of days is 22; 20% liked bananas; 78% liked fiesta salad in trial; 73% of seventh graders liked spicy jicama strips.

Question 2.
For each of the following questions, (1) describe how you would collect data to answer the question, and (2) describe whether it would result in a sample statistic or a population characteristic.
a. Where should the eighth-grade class go for its class trip?
b. What is the average number of pets per family for families that live in your town?
c. If people tried a new diet, what percentage would have an improvement in cholesterol reading?
d. What is the average grade point of students who got accepted to a particular state university?
e. What is a typical number of home runs hit in a particular season for major league baseball players?
Answer:
a. All eighth-grade students would be surveyed. The result would be a population characteristic.
Possibly only students in a certain classroom or students of a particular teacher would be surveyed.
The students surveyed would be a sample, and the result would be a sample statistic.

b. Data would be collected from families responding to a survey at a local food store. Data would be a sample, and the result would be a sample statistic.

It is possible that a town is small enough to survey each family that owns a pet. If this is the case, the people surveyed would be the population, and the result would be a population characteristic.

c. Data would be collected from people at a local health center. The people surveyed using the new diet would be a sample, and the result would be a sample statistic.

It is possible that all people involved with this new diet were identified and agreed to complete the survey. The people surveyed would then be the population, and the result would be a population characteristic.

d. The data would typically come from the grade point averages of all entering freshmen at a particular state university. The result would be a population characteristic.

It may have been possible to survey only a limited number of students who registered or applied.
The students responding to the survey would be a sample, and the result would be a sample statistic.

e. This answer would come from examining the population of all major league hitters for that season; it would be a population characteristic.

Question 3.
Identify a question that would lead to collecting data from the given set as a population and a question where the data could be a sample from a larger population.
a. All students in your school
b. Your state
Answer:
a. The school might be the population when considering what to serve for school lunch or what kind of speaker to bring for an all-school assembly.

The school might be a sample when considering how students in the state did on the algebra portion of the state assessment or what percent of students engage in extracurricular activities.

b. The percent of students who drop out of school would be calculated from data for the population of all students in schools; how people were likely to vote in the coming election could use the state as a sample of an area of the country.

Question 4.
Suppose that researchers sampled attendees of a certain movie and found that the mean age was 17 years old. Based on this observation, which of the following would be most likely?
a. The mean age of all of the people who went to see the movie was 17 years old.
b. About a fourth of the people who went to see the movie were older than 51.
c. The mean age of all people who went to see the movie would probably be in an interval around 17 years of age, that is, between 15 and 19.
d. The median age of those who attended the movie was 17 years old as well.
Answer:
Answer (c) would be most likely because the sample would not give an exact value for the whole population.

Question 5.
The headlines proclaimed: “Education Impacts Work-Life Earnings Five Times More Than Other Demographic Factors, Census Bureau Reports.” According to a U.S. Census Bureau study, education levels had more effect on earnings over a 40-year span in the workforce than any other demographic factor. www.census.gov/newsroom/releases/archives/education/cb11-153.html

a. The article stated that the estimated impact on annual earnings between a professional degree and an
eighth-grade education was roughly five times the impact of gender, which was $13,000. What would the difference in annual earnings be with a professional degree and with an eighth-grade education?
b. Explain whether you think the data are from a population or a sample, and identify either the population characteristic or the sample statistic.
Answer:
a. About $65,000 a year
b. The data probably came from a sample since the report was a study and not just about the population, so the numbers are probably sample statistics.

Eureka Math Grade 7 Module 5 Lesson 13 Exit Ticket Answer Key

Question 1.
What is the difference between a population characteristic and a sample statistic? Give an example to support your answer. Clearly identify the population and sample in your example.
Answer:
A population characteristic is a summary measure that describes some feature of population, the entire set of things or objects from which data might be collected. A sample statistic is a summary measure that describes a feature of some subset of the population. For example, the population could be all of the students in school, and a population characteristic could be the month in which most of the students were born. A sample of students could be those that had mathematics during the fifth block in their schedules, and a sample statistic could be their grade point averages.

Eureka Math Grade 7 Module 5 Lesson 12 Answer Key

Engage NY Eureka Math 7th Grade Module 5 Lesson 12 Answer Key

Eureka Math Grade 7 Module 5 Lesson 12 Exercise Answer Key

Exercises 1–2
Exercise 1.
If the equally likely model was correct, about how many of each outcome would you expect to see if the cube is rolled 500 times?
Answer:
If the equally likely model was correct, you would expect to see each outcome occur about 83 times.

Exercise 2.
Based on the data from the 500 rolls, how often were odd numbers observed? How often were even numbers observed?
Answer:
Odd numbers were observed 228 times. Even numbers were observed 272 times.

Exercise 3.
Collect data for Sylvia. Carry out the experiment of shaking a cup that contains four balls, two black and two white, observing, and recording whether the pattern is opposite or adjacent. Repeat this process 20 times. Then, combine the data with those collected by your classmates.
Do your results agree with Philippe’s equally likely model, or do they indicate that Sylvia had the right idea? Explain.
Answer:
Answers will vary; estimated probabilities of around \(\frac{1}{3}\) for the opposite pattern and \(\frac{2}{3}\) for the adjacent pattern emerge, casting serious doubt on the equally likely model.

Exercises 4–5
There are three popular brands of mixed nuts. Your teacher loves cashews, and in his experience of having purchased these brands, he suggests that not all brands have the same percentage of cashews. One has around 20% cashews, one has 25%, and one has 35%.

Your teacher has bags labeled A, B, and C representing the three brands. The bags contain red beads representing cashews and brown beads representing other types of nuts. One bag contains 20% red beads, another 25% red beads, and the third has 35% red beads. You are to determine which bag contains which percentage of cashews. You cannot just open the bags and count the beads.

Exercise 4.
Work as a class to design a simulation. You need to agree on what an outcome is, what a trial is, what a success is, and how to calculate the estimated probability of getting a cashew. Base your estimate on 50 trials.
Answer:
An outcome is the result of choosing one bead from the given bag.
A red bead represents a cashew; a brown bead represents a non-cashew.
In this problem, a trial consists of one outcome.
A success is observing a red bead. Beads are replaced between trials. 50 trials are to be done.
The estimated probability of selecting a cashew from the given bag is the number of successes divided by 50.

Exercise 5.
Your teacher will give your group one of the bags labeled A, B, or C. Using your plan from part (a), collect your data. Do you think you have the 20%, 25%, or 35% cashews bag? Explain.
Answer:
Once estimates have been computed, have the class try to decide which percentage is in which bag. Agreeing on the 35% bag may be the easiest, but there could be disagreement concerning the 20% and 25%. If they cannot decide, ask them what they should do. Hopefully, they say that they need more data. Typically, about 500 data points in a simulation yields estimated probabilities fairly close to the theoretical ones.

Exercises 6–8
Suppose you have two bags, A and B, in which there are an equal number of slips of paper. Positive numbers are written on the slips. The numbers are not known, but they are whole numbers between 1 and 75, inclusive. The same number may occur on more than one slip of paper in a bag.

These bags are used to play a game. In this game, you choose one of the bags and then choose one slip from that bag. If you choose Bag A and the number you choose from it is a prime number, then you win. If you choose Bag B and the number you choose from it is a power of 2, you win. Which bag should you choose?

Exercise 6.
Emma suggests that it does not matter which bag you choose because you do not know anything about what numbers are inside the bags. So, she thinks that you are equally likely to win with either bag. Do you agree with her? Explain.
Answer:
Without any data, Emma is right. You may as well toss a coin to determine which bag to choose. However, gathering information through empirical evidence helps in making an informed decision

Exercise 7.
Aamir suggests that he would like to collect some data from both bags before making a decision about whether or not the model is equally likely. Help Aamir by drawing 50 slips from each bag, being sure to replace each one before choosing again. Each time you draw a slip, record whether it would have been a winner or not. Using the results, what is your estimate for the probability of drawing a prime number from Bag A and drawing a power of 2 from Bag B?
Answer:
Answers will vary.

Exercise 8.
If you were to play this game, which bag would you choose? Explain why you would pick this bag.
Answer:
Answers will vary.

Eureka Math Grade 7 Module 5 Lesson 12 Problem Set Answer Key

Question 1.
Some M&M’s® are “defective.” For example, a defective M&M® may have its M missing, or it may be cracked, broken, or oddly shaped. Is the probability of getting a defective M&M® higher for peanut M&M’s® than for plain M&M’s®?

Gloriann suggests the probability of getting a defective plain M&M® is the same as the probability of getting a defective peanut M&M®. Suzanne does not think this is correct because a peanut M&M® is bigger than a plain M&M®, and therefore has a greater opportunity to be damaged.

a. Simulate inspecting a plain M&M® by rolling two number cubes. Let a sum of 7 or 11 represent a defective plain M&M® and the other possible rolls represent a plain M&M® that is not defective. Do 50 trials, and compute an estimate of the probability that a plain M&M® is defective. Record the 50 outcomes you observed. Explain your process.

b. Simulate inspecting a peanut M&M® by selecting a card from a well-shuffled deck of cards. Let a one-eyed face card and clubs represent a defective peanut M&M® and the other cards represent a peanut M&M® that is not defective. Be sure to replace the chosen card after each trial and to shuffle the deck well before choosing the next card. Note that the one-eyed face cards are the king of diamonds, jack of hearts, and jack of spades. Do 20 trials, and compute an estimate of the probability that a peanut M&M® is defective. Record the list of 20 cards that you observed. Explain your process.

c. For this problem, suppose that the two simulations provide accurate estimates of the probability of a defective M&M® for plain and peanut M&M’s®. Compare your two probability estimates, and decide whether Gloriann’s belief is reasonable that the defective probability is the same for both types of M&M’s®. Explain your reasoning.
Answer:
a. A simulated outcome for a plain M&M® involves rolling two number cubes. A trial is the same as an outcome in this problem. A success is getting a sum of 7 or 11, either of which represents a defective plain M&M®. 50 trials should produce somewhere around 11 successes. A side note is that the theoretical probability of getting a sum of 7 or 11 is \(\frac{8}{36}\), or \(0 . \overline{2}\).

b. A simulated outcome for a peanut M&M® involves choosing one card from a deck. A trial is the same as an outcome in this problem. A success is getting a one-eyed face card or a club, any of which represents a defective peanut M&M®. 20 trials of choosing cards with replacement should produce somewhere around six successes.

c. Estimates will vary; the probability estimate for finding a defective plain M&M® is approximately 0.22, and the probability estimate for finding a defective peanut M&M® is about 0.30. Gloriann could possibly be right, as it appears more likely to find a defective peanut M&M® than a plain one, based on the higher probability estimate.

Question 2.
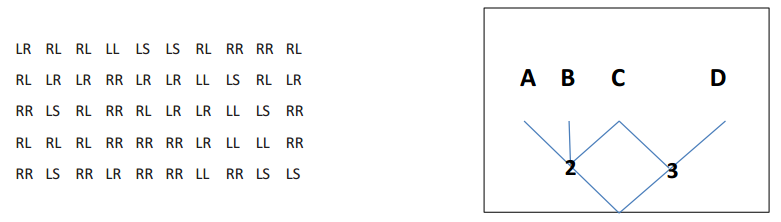
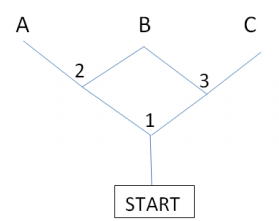
One at a time, mice are placed at the start of the maze shown below. There are four terminal stations at A, B, C, and D. At each point where a mouse has to decide in which direction to go, assume that it is equally likely for it to choose any of the possible directions. A mouse cannot go backward.

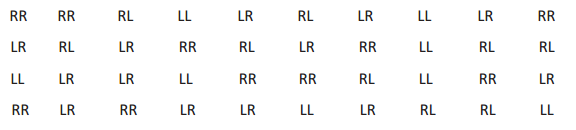
In the following simulated trials, L stands for left, R for right, and S for straight. Estimate the probability that a mouse finds station C where the food is. No food is at A, B, or D. The following data were collected on 50 simulated paths that the mice took.
Eureka Math 7th Grade Module 5 Lesson 12 Problem Set Answer Key 1
a. What paths constitute a success, and what paths constitute a failure?
b. Use the data to estimate the probability that a mouse finds food. Show your calculation.
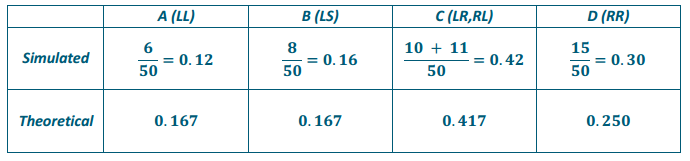
c. Paige suggests that it is equally likely that a mouse gets to any of the four terminal stations. What does your simulation suggest about whether her equally likely model is believable? If it is not believable, what do your data suggest is a more believable model?
d. Does your simulation support the following theoretical probability model? Explain.
i) The probability a mouse finds terminal point A is 0.167.
ii) The probability a mouse finds terminal point B is 0.167.
iii) The probability a mouse finds terminal point C is 0.417.
iv) The probability a mouse finds terminal point D is 0.250.
Answer:
a. An outcome is the direction chosen by the mouse when it has to make a decision. A trial consists of a path (two outcomes) that leads to a terminal station. The paths are LL (leads to A), LS (leads to B), LR (leads to C), RL (leads to C), and RR (leads to D). A success is a path leading to C, which is LR or RL; a failure is a path leading to A, B, or D, which is LL, LS, or RR.

b. Using the given 50 simulated paths:
Eureka Math 7th Grade Module 5 Lesson 12 Problem Set Answer Key 2

c. Paige is incorrect. The mouse still makes direction decisions that are equally likely, but there is one decision point that has three rather than two emanating paths. Based on the simulation, the mouse is more likely to end up at terminal C.

d. Yes, the simulation appears to support the given probability model, as the estimates are reasonably close.
Eureka Math 7th Grade Module 5 Lesson 12 Problem Set Answer Key 3

Eureka Math Grade 7 Module 5 Lesson 12 Exit Ticket Answer Key

Question 1.
There are four pieces of bubble gum left in a quarter machine. Two are red, and two are yellow. Chandra puts two quarters in the machine. One piece is for her, and one is for her friend, Kay. If the two pieces are the same color, she is happy because they will not have to decide who gets what color. Chandra claims that they are equally likely to get the same color because the colors are either the same or they are different. Check her claim by doing a simulation.
a. Name a device that can be used to simulate getting a piece of bubble gum. Specify what outcome of the device represents a red piece and what outcome represents yellow.
b. Define what a trial is for your simulation.
c. Define what constitutes a success in a trial of your simulation.
d. Perform and list 50 simulated trials. Based on your results, is Chandra’s equally likely model correct?
Answer:
a. There are several ways to simulate the bubble gum outcomes. For example, two red and two yellow disks could be put in a bag. A red disk represents a red piece of bubble gum, and a yellow disk represents a yellow piece.
b. A trial is choosing two disks (without replacement).
c. A success is if two disks are of the same color; a failure is if they differ.
d. 50 simulated trials produce a probability estimate of about \(\frac{1}{3}\) for the same color and \(\frac{2}{3}\) for different colors.
Note: Some students may believe that the model is equally likely, but hopefully they realize by now that they should make some observations to make an informed decision. Some may see that this problem is actually similar to Exercise 3.

Eureka Math Grade 7 Module 5 Lesson 11 Answer Key

Engage NY Eureka Math 7th Grade Module 5 Lesson 11 Answer Key

Eureka Math Grade 7 Module 5 Lesson 11 Example Answer Key

Example 1: Simulation
In the last lesson, we used coins, number cubes, and cards to carry out simulations. Another option is putting identical pieces of paper or colored disks into a container, mixing them thoroughly, and then choosing one.

For example, if a basketball player typically makes five out of eight foul shots, then a colored disk could be used to simulate a foul shot. A green disk could represent a made shot, and a red disk could represent a miss. You could put five green and three red disks in a container, mix them, and then choose one to represent a foul shot. If the color of the disk is green, then the shot is made. If the color of the disk is red, then the shot is missed. This procedure simulates one foul shot.

a. Using colored disks, describe how one at bat could be simulated for a baseball player who has a batting average of 0.300. Note that a batting average of 0.300 means the player gets a hit (on average) three times out of every ten times at bat. Be sure to state clearly what a color represents.
b. Using colored disks, describe how one at bat could be simulated for a player who has a batting average of 0.273. Note that a batting average of 0.273 means that on average, the player gets 273 hits out of 1,000 at bats.
Answer:
Ask students what device they would use to simulate problems in which the probability of winning in a single outcome is \(\frac{5}{8}\). A coin or number cube does not work. A deck of eight cards (with five of the cards designated as winners) would work, but shuffling cards between draws can be time-consuming and difficult for many students. Suggest a new device: colored disks in which five green disks could represent a win and three red disks could represent a miss. Put the eight disks in a bag, shake the bag, and choose a disk. Do this as many times as are needed to comprise a trial, and then do as many trials as needed to carry out the simulation. Students could also create their own spinners with eight sections, with three sections colored one color and five sections a different color, to represent the two different outcomes.
Students work on Example 1 independently. Then, discuss and confirm as a class.

a. Put ten disks in a bag, three of which are green (representing a hit), and seven are red (representing a non-hit).
b. Put 1,000 disks in a bag, 273 green ones (hits) and 727 red ones (non-hits).

Example 2: Using Random Number Tables
Why is using colored disks not practical for the situation described in Example 1(b)? Another way to carry out a simulation is to use a random number table, or a random number generator. In a random number table, the digits 0, 1, 2, 3, 4, 5, 6, 7, 8, and 9 occur equally often in the long run. Pages and pages of random numbers can be found online.

For example, here are three lines of random numbers. The space after every five digits is only for ease of reading. Ignore the spaces when using the table.
Engage NY Math 7th Grade Module 5 Lesson 11 Example Answer Key 1

To use the random number table to simulate an at bat for the 0.273 hitter in Example 1(b), you could use a three-digit number to represent one at bat. The three-digit numbers 000–272 could represent a hit, and the three-digit numbers 273–999 could represent a non-hit. Using the random numbers above and starting at the beginning of the first line, the first three-digit random number is 252, which is between 000 and 272, so that simulated at bat is a hit. The next three-digit random number is 566, which is a non-hit.

Continuing on the first line of the random numbers above, what would the hit/non-hit outcomes be for the next six at bats? Be sure to state the random number and whether it simulates a hit or non-hit.
Answer:
The numbers are 520 (non-hit), 572 (non-hit), 597 (non-hit), 005 (hit), 621 (non-hit), and 268 (hit).
Engage NY Math 7th Grade Module 5 Lesson 11 Example Answer Key 2

Example 3: Baseball Player
A batter typically gets to bat four times in a ball game. Consider the 0.273 hitter from the previous example. Use the following steps (and the random numbers shown above) to estimate that player’s probability of getting at least three hits (three or four) in four times at bat.
a. Describe what one trial is for this problem.
b. Describe when a trial is called a success and when it is called a failure.
c. Simulate 12 trials. (Continue to work as a class, or let students work with a partner.)
d. Use the results of the simulation to estimate the probability that a 0.273 hitter gets three or four hits in four times at bat. Compare your estimate with other groups.
Answer:
a. A trial consists of four three-digit numbers. For the first trial, 252, 566, 520, 572 constitute one trial.
b. A success is getting 3 or 4 hits per game; a failure is getting 0, 1, or 2 hits. For the first trial, the hitter got only 1 hit, so it would be a failure.
c. Answers will vary.

d. As a side note, the theoretical probability is calculated by considering the possible outcomes for four at bats that have either 4 hits (HHHH) or 3 hits (HHHM, HHMH, HMHH, and MHHH). The outcome that consists of 4 hits has probability (0.273)4, and each of the 4 outcomes with 3 hits has probability 4 (0.273)3 (0.727). The theoretical probability is approximately 0.0674. (Refer to Lessons 6 and 7 for the rationale for the numerical expressions.)

Example 4: Birth Month
In a group of more than 12 people, is it likely that at least two people, maybe more, will have the same birth month? Why? Try it in your class.

Now, suppose that the same question is asked for a group of only seven people. Are you likely to find some groups of seven people in which there is a match but other groups in which all seven people have different birth months? In the following exercises, you will estimate the probability that at least two people in a group of seven were born in the same month.
Answer:
Note: There is a famous birthday problem that asks, “What is the probability of finding (at least one) birthday match in a group of n people?” The surprising result is that there is a 50/50 chance of finding at least one birthday match in as few as 23 people. Simulating birthdays is a bit time-consuming, so this problem simulates birth months.

Eureka Math Grade 7 Module 5 Lesson 11 Exercise Answer Key

Exercises 1–4
Exercise 1.
What might be a good way to generate outcomes for the birth month problem—using coins, number cubes, cards, spinners, colored disks, or random numbers?
Answer:
Answers will vary; keep in mind that the first thing to do is specify how a birth month for one person is going to be simulated. For example, a dodecahedron is a 12-sided solid. Each of its sides would represent one month.

The following will not work: coins (only two outcomes), number cubes (only six outcomes, and we need 12).

The following devices will work: cards (could label twelve cards January through December), spinners (could make a spinner with twelve equal sectors), colored disks (would need 12 different colors and then remember which color represents which month), 12 disks would work if you could write the name of a month on them, and a random number table (two-digit numbers 01, 02, …, 12 would work, but 00, 13 through 99 would have to be discarded, which could be quite laborious and time-consuming).

Exercise 2.
How would you simulate one trial of seven birth months?
Answer:
Answers will vary; suppose students decide to use disks with the names of the months printed on them. To generate a trial, put the 12 disks in a bag. Then, shake the bag, and choose a disk to represent the first person’s birthday. Then, replace the disk, and do the process six more times. The list of seven birth months generates a trial.

Exercise 3.
How is a success determined for your simulation?
Answer:
A success would be at least one match in the seven.

Exercise 4.
How is the simulated estimate determined for the probability that a least two in a group of seven people were born in the same month?
Answer:
Repeat this n times, count the number of successes, and divide it by n to get the estimated probability of having at least one birth month match in a group of seven people.

Eureka Math Grade 7 Module 5 Lesson 11 Problem Set Answer Key

Question 1.
A model airplane has two engines. It can fly if one engine fails but is in serious trouble if both engines fail. The engines function independently of one another. On any given flight, the probability of a failure is 0.10 for each engine. Design a simulation to estimate the probability that the airplane will be in serious trouble the next time it goes up.
a. How would you simulate the status of an engine?
b. What constitutes a trial for this simulation?
c. What constitutes a success for this simulation?
d. Carry out 50 trials of your simulation, list your results, and calculate an estimate of the probability that the airplane will be in serious trouble the next time it goes up.
Answer:
a. Answers will vary; it is possible to use a random number table. The failure status of an engine can be represented by the digit 0, while digits 1–9 represent an engine in good status.

b. A trial for this problem would be a pair of random digits, one for each engine. The possible equally likely pairings would be 00, 0x, x0, xx (where x stands for any digit 1–9). There are 100 of them. 00 represents both engines failing; 0x represents the left engine failing, but the right engine is good; x0 represents the right engine failing, but the left engine is good; xx represents both engines are in good working order.

c. A success would be both engines failing, which is represented by 00.
d. Answers will vary; divide the number of successes by 50.

Question 2.
In an effort to increase sales, a cereal manufacturer created a really neat toy that has six parts to it. One part is put into each box of cereal. Which part is in a box is not known until the box is opened. You can play with the toy without having all six parts, but it is better to have the complete set. If you are really lucky, you might only need to buy six boxes to get a complete set. But if you are very unlucky, you might need to buy many, many boxes before obtaining all six parts.

a. How would you represent the outcome of purchasing a box of cereal, keeping in mind that there are six different parts? There is one part in each box.
b. If it was stated that a customer would have to buy at least 10 boxes of cereal to collect all six parts, what constitutes a trial in this problem?
c. What constitutes a success in a trial in this problem?
d. Carry out 15 trials, list your results, and compute an estimate of the probability that it takes the purchase of 10 or more boxes to get all six parts.
Answer:
a. Answers will vary; since there are six parts in a complete set, the ideal device to use in this problem is a number cube. Each number represents a different part.

b. Students are asked to estimate the probability that it takes 10 or more boxes to get all six parts, so it is necessary to look at the outcomes of the first 9 boxes. One roll of the number cube represents one box of cereal. A trial could be a string of 9 digits 1–6, the results of rolling a number cube.

c. A success would then be looking at the 9 digits and seeing if at least one digit 1–6 is missing. For example, the string 251466645 would count as a success, since part 3 was not acquired, whereas 344551262 would be considered a failure because it took fewer than 10 boxes to get all six parts.

d. Students are asked to generate 15 such trials, count the number of successes in the 15 trials, and divide the number by 15. The result is the estimated probability that it takes 10 or more boxes to acquire all six parts.

Question 3.
Suppose that a type A blood donor is needed for a certain surgery. Carry out a simulation to answer the following question: If 40% of donors have type A blood, what is an estimate of the probability that it will take at least four donors to find one with type A blood?
a. How would you simulate a blood donor having or not having type A?
b. What constitutes a trial for this simulation?
c. What constitutes a success for this simulation?
d. Carry out 15 trials, list your results, and compute an estimate for the probability that it takes at least four donors to find one with type A blood.
Answer:
a. With 40% taken as the probability that a donor has type A blood, a random digit would be a good device to use. For example,1, 2, 3, 4 could represent type A blood, and 0, 5, 6, 7, 8, 9 could represent non-type A blood.

b. The problem asks for the probability that it will take four or more donors to find one with type A blood. That implies that the first three donors do not have type A blood. So, a trial is three random digits.

c. A success is none of the three digits are 1, 2, 3, or 4. For example, 605 would be a success, since none of the donors had type A blood. An example of a failure would be 662.

d. Students are to generate 15 such trials, count the number of successes, and divide by 15 to calculate their estimated probability of needing four or more donors to get one with type A blood.

Eureka Math Grade 7 Module 5 Lesson 12 Problem Set Answer Key

Question 1.
Liang wants to form a chess club. His principal says that he can do that if Liang can find six players, including himself. How would you conduct a simulated model that estimates the probability that Liang will find at least five other players to join the club if he asks eight players who have a 70% chance of agreeing to join the club? Suggest a simulation model for Liang by describing how you would do the following parts.

a. Specify the device you want to use to simulate one person being asked.
b. What outcome(s) of the device would represent the person agreeing to be a member?
c. What constitutes a trial using your device in this problem?
d. What constitutes a success using your device in this problem?
e. Based on 50 trials, using the method you have suggested, how would you calculate the estimate for the probability that Liang will be able to form a chess club?
Answer:
a. Answers will vary. Using single digits in a random number table would probably be the quickest and most efficient device. 1–7 could represent “yes,” and 0, 8, 9 could represent “no.”
b. Answers will vary based on the device from part (a).
c. Using a random number table, a trial would consist of eight random digits.
d. Answers will vary; based on the above, a success is at least five people agreeing to join and would be represented by any set of digits with at least five of the digits being 1–7. Note that the random string 33047816 would represent 6 of 8 people agreeing to be a member, which is a success. The string 48891437 would represent a failure.
e. Based on 50 such trials, the estimated probability that Liang will be able to form a chess club would be the number of successes divided by 50.

Eureka Math Grade 7 Module 5 Lesson 10 Answer Key

Engage NY Eureka Math 7th Grade Module 5 Lesson 10 Answer Key

Eureka Math Grade 7 Module 5 Lesson 10 Example Answer Key

Example 1: Families
How likely is it that a family with three children has all boys or all girls?
Let’s assume that a child is equally likely to be a boy or a girl. Instead of observing the result of actual births, a toss of a fair coin could be used to simulate a birth. If the toss results in heads (H), then we could say a boy was born; if the toss results in tails (T), then we could say a girl was born. If the coin is fair (i.e., heads and tails are equally likely), then getting a boy or a girl is equally likely.
Answer:
Pose the following questions to the class one at a time, and allow for multiple responses:
→ How could a number cube be used to simulate getting a boy or a girl birth?
An even-number outcome represents boy, and an odd-number outcome represents girl; a prime-number outcome represents boy, and a non-prime outcome represents girl; or any three-number cube digits represents boy, while the rest represents girl.

→ How could a deck of cards be used to simulate getting a boy or a girl birth?
The most natural option is to allow black cards to represent one gender and red cards to represent the other.

Example 2.
Simulation provides an estimate for the probability that a family of three children would have three boys or three girls by performing three tosses of a fair coin many times. Each sequence of three tosses is called a trial. If a trial results in either HHH or TTT, then the trial represents all boys or all girls, which is the event that we are interested in. These trials would be called a success. If a trial results in any other order of H’s and T’s, then it is called a failure.

The estimate for the probability that a family has either three boys or three girls based on the simulation is the number of successes divided by the number of trials. Suppose 100 trials are performed, and that in those 100 trials, 28 resulted in either HHH or TTT. Then, the estimated probability that a family of three children has either three boys or three girls would be \(\frac{28}{100}\), or 0.28.
Answer:
→ What is the estimated probability that the three children are not all the same gender?
1 – 0.28 = 0.72

Example 3: Basketball Player
Suppose that, on average, a basketball player makes about three out of every four foul shots. In other words, she has a 75% chance of making each foul shot she takes. Since a coin toss produces equally likely outcomes, it could not be used in a simulation for this problem.

Instead, a number cube could be used by specifying that the numbers 1, 2, or 3 represent a hit, the number 4 represents a miss, and the numbers 5 and 6 would be ignored. Based on the following 50 trials of rolling a fair number cube, find an estimate of the probability that she makes five or six of the six foul shots she takes.
Engage NY Math 7th Grade Module 5 Lesson 10 Example Answer Key 1
Answer:
50 trials of six numbers each are shown. Students are to estimate the probability that the player makes five or six of the six shots she takes. So, they should count how many of the trials have five or six of the numbers 1, 2, 3 in them as successes. They should find the estimated probability to be \(\frac{27}{50}\), or 0.54.

The estimate of the probability that she will make five or six foul shots is \(\frac{27}{50}\).

Eureka Math Grade 7 Module 5 Lesson 10 Exercise Answer Key

Exercises 1–2
Suppose that a family has three children. To simulate the genders of the three children, the coin or number cube or a card would need to be used three times, once for each child. For example, three tosses of the coin resulted in HHT, representing a family with two boys and one girl. Note that HTH and THH also represent two boys and one girl.

Exercise 1.
Suppose that when a prime number (P) is rolled on the number cube, it simulates a boy birth, and a non-prime (N) simulates a girl birth. Using such a number cube, list the outcomes that would simulate a boy birth and those that simulate a girl birth. Are the boy and girl birth outcomes equally likely?
Answer:
The outcomes are 2, 3, 5 for a boy birth and 1, 4, 6 for a girl birth. The boy and girl births are thereby equally likely.

Exercise 2.
Suppose that one card is drawn from a regular deck of cards. A red card (R) simulates a boy birth, and a black card (B) simulates a girl birth. Describe how a family of three children could be simulated.
Answer:
The key response has to include the drawing of three cards with replacement. If a card is not replaced and the deck shuffled before the next card is drawn, then the probabilities of the genders have changed (ever so slightly, but they are not 50/50 from draw to draw). Simulating the genders of three children requires three cards to be drawn
with replacement.

Exercises 3–5
Exercise 3.
Find an estimate of the probability that a family with three children will have exactly one girl using the following outcomes of 50 trials of tossing a fair coin three times per trial. Use H to represent a boy birth and T to represent a girl birth.
Engage NY Math Grade 7 Module 5 Lesson 10 Exercise Answer Key 1
Answer:
T represents a girl. I went through the list, counted the number of times that HHT, HTH, or THH appeared and divided that number of successes by 50. The simulated probability is \(\frac{16}{50}\), or 0.32

Exercise 4.
Perform a simulation of 50 trials by rolling a fair number cube in order to find an estimate of the probability that a family with three children will have exactly one girl.
a. Specify what outcomes of one roll of a fair number cube will represent a boy and what outcomes will represent a girl.
b. Simulate 50 trials, keeping in mind that one trial requires three rolls of the number cube. List the results of your 50 trials.
c. Calculate the estimated probability.
Answer:
Answers will vary. For example, students could identify a girl birth as 1, 2, 3 outcome on one roll of the number cube and roll the number cube three times to simulate three children (one trial). They need to list their 50 trials. Note that an outcome of 412 would represent two girls, 123 would represent three girls, and 366 would represent one girl, as would 636 and 663. Be sure that they are clear about how to do all five steps of the simulation process.

Exercise 5.
Calculate the theoretical probability that a family with three children will have exactly one girl.
a. List the possible outcomes for a family with three children. For example, one possible outcome is BBB (all three children are boys).
b. Assume that having a boy and having a girl are equally likely. Calculate the theoretical probability that a family with three children will have exactly one girl.
c. Compare it to the estimated probabilities found in parts (a) and (b).
Answer:
a. The sample space is BBB, BBG, BGB, GBB, BGG, GBG, GGB, GGG.
b. Each is equally likely, so the theoretical probability of getting exactly one girl is \(\frac{3}{8}\), or 0.375 (BBG, BGB, GBB).
c. Answers will vary. The estimated probabilities from the first two parts of this exercise should be around 0.375. If not, suggest that students conduct more trials.

Eureka Math Grade 7 Module 5 Lesson 10 Problem Set Answer Key

Question 1.
A mouse is placed at the start of the maze shown below. If it reaches station B, it is given a reward. At each point where the mouse has to decide which direction to go, assume that it is equally likely to go in either direction. At each decision point 1, 2, 3, it must decide whether to go left (L) or right (R). It cannot go backward.
Eureka Math 7th Grade Module 5 Lesson 10 Problem Set Answer Key 1
a. Create a theoretical model of probabilities for the mouse to arrive at terminal points A, B, and C.
i) List the possible paths of a sample space for the paths the mouse can take. For example, if the mouse goes left at decision point 1 and then right at decision point 2, then the path would be denoted LR.
ii) Are the paths in your sample space equally likely? Explain.
iiii) What are the theoretical probabilities that a mouse reaches terminal points A, B, and C? Explain.

b. Based on the following set of simulated paths, estimate the probabilities that the mouse arrives at points A, B, and C.
Eureka Math 7th Grade Module 5 Lesson 10 Problem Set Answer Key 2
c. How do the simulated probabilities in part (b) compare to the theoretical probabilities of part (a)?
Answer:
a. i) The possible paths in the sample space are {LL, LR, RL, RR}.
ii) Each of these outcomes has an equal probability of 1/4 since at each decision point there are only two possible choices, which are equally likely.
iii) The probability of reaching terminal point A is \(\frac{1}{4}\) since it is accomplished by path LL. Similarly, reaching terminal point C is \(\frac{1}{4}\) since it is found by path RR. However, reaching terminal point B is \(\frac{1}{2}\) since it is reached via LR or RL.

b. Students need to go through the list and count the number of paths that go to A, B, and C. They should find the estimated probabilities to be \(\frac{8}{40}\), or 0.2, for A, \(\frac{22}{40}\), or 0.55, for B, and \(\frac{10}{40}\), or 0.25, for C.

c. The probabilities are reasonably close for parts (a) and (b). Probabilities based on taking 400 trials should be closer than those based on 40, but the probabilities based on 40 are in the ballpark.

Question 2.
Suppose that a dartboard is made up of the 8 × 8 grid of squares shown below. Also, suppose that when a dart is thrown, it is equally likely to land on any one of the 64 squares. A point is won if the dart lands on one of the 16 black squares. Zero points are earned if the dart lands in a white square.
Eureka Math 7th Grade Module 5 Lesson 10 Problem Set Answer Key 3
a. For one throw of a dart, what is the probability of winning a point? Note that a point is won if the dart lands on a black square.
b. Lin wants to use a number cube to simulate the result of one dart. She suggests that 1 on the number cube could represent a win. Getting 2, 3, or 4 could represent no point scored. She says that she would ignore getting a 5 or 6. Is Lin’s suggestion for a simulation appropriate? Explain why you would use it, or if not, how you would change it.
c. Suppose a game consists of throwing a dart three times. A trial consists of three rolls of the number cube. Based on Lin’s suggestion in part (b) and the following simulated rolls, estimate the probability of scoring two points in three darts.
Eureka Math 7th Grade Module 5 Lesson 10 Problem Set Answer Key 4

d. The theoretical probability model for winning 0, 1, 2, and 3 points in three throws of the dart as described in this problem is:
i) Winning 0 points has a probability of 0.42.
ii) Winning 1 point has a probability of 0.42.
iii) Winning 2 points has a probability of 0.14.
iv) Winning 3 points has a probability of 0.02.
Use the simulated rolls in part (c) to build a model of winning 0, 1, 2, and 3 points, and compare it to the theoretical model.
Answer:
a. The probability of winning a point is \(\frac{16}{64}\), or 0.25.

b. Lin correctly suggests that to simulate the result of one throw, a number cube could be used with the 1 representing a hit; 2, 3, 4 representing a missed throw; and 5 and 6 being ignored. (As an aside, a tetrahedron could be used by using the side facing down as the result.)

c. The probability of scoring two points in three darts is \(\frac{5}{50}\), or 0.1. (Students need to count the number of trials that contain exactly two 1’s.)

d. To find the estimated probability of 0 points, count the number of trials that have no 1’s in them
(\(\frac{23}{50}\) = 0.46).
To find the estimated probability of 1 point, count the number of trials that have one 1 in them (\(\frac{20}{50}\) = 0.4).
From part (c), the estimated probability of 2 points is 0.1.
To find the estimated probability of 3 points, count the number of trials that have three 1’s in them
(\(\frac{2}{50}\) = 0.04).
The theoretical and simulated probabilities are reasonably close.
Eureka Math 7th Grade Module 5 Lesson 10 Problem Set Answer Key 5

Eureka Math Grade 7 Module 5 Lesson 10 Exit Ticket Answer Key

Question 1.
Nathan is your school’s star soccer player. When he takes a shot on goal, he typically scores half of the time. Suppose that he takes six shots in a game. To estimate the probability of the number of goals Nathan makes, use simulation with a number cube. One roll of a number cube represents one shot.
a. Specify what outcome of a number cube you want to represent a goal scored by Nathan in one shot.
b. For this problem, what represents a trial of taking six shots?
c. Perform and list the results of ten trials of this simulation.
d. Identify the number of goals Nathan made in each of the ten trials you did in part (c).
e. Based on your ten trials, what is your estimate of the probability that Nathan scores three goals if he takes six shots in a game?
Answer:
a. Answers will vary; students need to determine which three numbers on the number cube represent scoring a goal.
b. Rolling the cube six times represents taking six shots on goal or 1 simulated trial.
c. Answers will vary; students working in pairs works well for these problems. Performing only ten trials is a function of time. Ideally, many more trials should be done. If there is time, have the class pool their results.
d. Answers will vary.
e. Answers will vary; the probability of scoring per shot is \(\frac{1}{2}\).

Question 2.
Suppose that Pat scores 40% of the shots he takes in a soccer game. If he takes six shots in a game, what would one simulated trial look like using a number cube in your simulation?
Answer:
Students need to realize that 40% is 2 out of 5. In order to use the number cube as the device, 1 and 2 could represent goals, while 3, 4, and 5 could represent missed shots, and 6 is ignored. Rolling the number cube six times creates 1 simulated trial.

Eureka Math Grade 7 Module 5 Lesson 8 Answer Key

Engage NY Eureka Math 7th Grade Module 5 Lesson 8 Answer Key

Eureka Math Grade 7 Module 5 Lesson 8 Example Answer Key

Coins were discussed in previous lessons of this module. What is special about a coin? In most cases, a coin has two different sides: a head side (heads) and a tail side (tails). The sample space for tossing a coin is {heads, tails}. If each outcome has an equal chance of occurring when the coin is tossed, then the probability of getting heads is \(\frac{1}{2}\), or 0.5. The probability of getting tails is also 0.5. Note that the sum of these probabilities is 1.

The probabilities formed using the sample space and what we know about coins are called the theoretical probabilities. Using observed relative frequencies is another method to estimate the probabilities of heads or tails. A relative frequency is the proportion derived from the number of the observed outcomes of an event divided by the total number of outcomes. Recall from earlier lessons that a relative frequency can be expressed as a fraction, a decimal, or a percent. Is the estimate of a probability from this method close to the theoretical probability? The following example investigates how relative frequencies can be used to estimate probabilities.

Beth tosses a coin 10 times and records her results. Here are the results from the 10 tosses:
Engage NY Math 7th Grade Module 5 Lesson 8 Example Answer Key 1
The total number of heads divided by the total number of tosses is the relative frequency of heads. It is the proportion of the time that heads occurred on these tosses. The total number of tails divided by the total number of tosses is the relative frequency of tails.
a. Beth started to complete the following table as a way to investigate the relative frequencies. For each outcome, the total number of tosses increased. The total number of heads or tails observed so far depends on the outcome of the current toss. Complete this table for the 10 tosses recorded in the previous table.
Engage NY Math 7th Grade Module 5 Lesson 8 Example Answer Key 2
b. What is the sum of the relative frequency of heads and the relative frequency of tails for each row of the table?
c. Beth’s results can also be displayed using a graph. Use the values of the relative frequency of heads so far from the table in part (a) to complete the graph below.
Engage NY Math 7th Grade Module 5 Lesson 8 Example Answer Key 3
d. Beth continued tossing the coin and recording the results for a total of 40 tosses. Here are the results of the next 30 tosses:
Engage NY Math 7th Grade Module 5 Lesson 8 Example Answer Key 4
As the number of tosses increases, the relative frequency of heads changes. Complete the following table for the 40 coin tosses:
Engage NY Math 7th Grade Module 5 Lesson 8 Example Answer Key 5
e. Use the relative frequency of heads so far from the table in part (d) to complete the graph below for the total number of tosses of 1, 5, 10, 15, 20, 25, 30, 35, and 40.
Engage NY Math 7th Grade Module 5 Lesson 8 Example Answer Key 6
f. What do you notice about the changes in the relative frequency of the number of heads so far as the number of tosses increases?
g. If you tossed the coin 100 times, what do you think the relative frequency of heads would be? Explain your answer.
h. Based on the graph and the relative frequencies, what would you estimate the probability of getting heads to be? Explain your answer.
i. How close is your estimate in part (h) to the theoretical probability of 0.5? Would the estimate of this probability have been as good if Beth had only tossed the coin a few times instead of 40?
The value you gave in part (h) is an estimate of the theoretical probability and is called an experimental or estimated probability.
Answer:
a.
Engage NY Math 7th Grade Module 5 Lesson 8 Example Answer Key 7
b. The sum of the relative frequency of heads and the relative frequency of tails for each row is 1.00.

c.
Engage NY Math 7th Grade Module 5 Lesson 8 Example Answer Key 8

d.
Engage NY Math 7th Grade Module 5 Lesson 8 Example Answer Key 9

e.
Engage NY Math 7th Grade Module 5 Lesson 8 Example Answer Key 10

f. The relative frequencies seem to change less as the number of tosses increases. The line drawn to connect the relative frequencies seems to be leveling off.

g. Answers will vary. Anticipate most students will indicate 50 heads result in 100 tosses, for a relative frequency of 0.50. This is a good time to indicate that the value of 0.50 is where the graph of the relative frequencies seems to be approaching. However, the relative frequencies will vary. For example, if the relative frequency for 100 tosses was 0.50 (and it could be), what would the relative frequency for 101 tosses be? Point out to students that no matter the outcome on the 101st toss, the relative frequency of heads would not be exactly 0.50.

h. Answers will vary. Anticipate that students will estimate the probability to be 0.50, as that is what they determined in the opening discussion, and that is the value that the relative frequencies appear to be approaching. Some students may estimate the probability as 0.48, as that was the last relative frequency obtained after 40 tosses. That estimate is also a good estimate of the probability.

i. In the beginning, the relative frequencies jump around. The estimated probabilities and the theoretical probabilities should be nearly the same as the number of observations increases. The estimated probabilities would likely not be as good after just a few coin tosses.

Eureka Math Grade 7 Module 5 Lesson 8 Exercise Answer Key

Exercises 1–8
Beth received nine more pennies. She securely taped them together to form a small stack. The top penny of her stack showed heads, and the bottom penny showed tails. If Beth tosses the stack, what outcomes could she observe?
Answer:
She could observe heads, tails, and on the side.

Exercise 1.
Beth wanted to determine the probability of getting heads when she tosses the stack. Do you think this probability is the same as the probability of getting heads with just one coin? Explain your answer.
Answer:
The outcomes when tossing this stack would be {heads, tails, side}. This changes the probability of getting heads, as there are three outcomes.

Exercise 2.
Make a sturdy stack of 10 pennies in which one end of the stack has a penny showing heads and the other end tails. Make sure the pennies are taped securely, or you may have a mess when you toss the stack. Toss the stack to observe possible outcomes. What is the sample space for tossing a stack of 10 pennies taped together? Do you think the probability of each outcome of the sample space is equal? Explain your answer.
Answer:
The sample space is {heads, tails, side}. A couple of tosses should clearly indicate to students that the stack often lands on its side. As a result, the probabilities of heads, tails, and on the side do not appear to be the same.

Exercise 3.
Record the results of 10 tosses. Complete the following table of the relative frequencies of heads for your 10 tosses:
Engage NY Math Grade 7 Module 5 Lesson 8 Exercise Answer Key 1
Answer:
Answers will vary; the results of an actual toss are shown below.
Engage NY Math Grade 7 Module 5 Lesson 8 Exercise Answer Key 5

Exercise 4.
Based on the value of the relative frequencies of heads so far, what would you estimate the probability of getting heads to be?
Answer:
If students had a sample similar to the above, they would estimate the probability of tossing a heads as 0.20 (or something close to that last relative frequency).

Exercise 5.
Toss the stack of 10 pennies another 20 times. Complete the following table:
Engage NY Math Grade 7 Module 5 Lesson 8 Exercise Answer Key 2
Answer:
Answers will vary; student data will be different.
Engage NY Math Grade 7 Module 5 Lesson 8 Exercise Answer Key 6

Exercise 6.
Summarize the relative frequency of heads so far by completing the following table:
Engage NY Math Grade 7 Module 5 Lesson 8 Exercise Answer Key 3
Answer:
A sample table is provided using data from Exercises 3 and 5.
Engage NY Math Grade 7 Module 5 Lesson 8 Exercise Answer Key 7

Exercise 7.
Based on the relative frequencies for the 30 tosses, what is your estimate of the probability of getting heads? Can you compare this estimate to a theoretical probability like you did in the first example? Explain your answer.
Answer:
Answers will vary. Students are anticipated to indicate an estimated probability equal or close to the last value in the relative frequency column. For this example, that would be 0.27. An estimate of 0.25 for this sample would have also been a good estimate. Students would indicate that they could not compare this to a theoretical probability because the theoretical probability is not known for this example. Allow for a range of estimated probabilities. Factors that might affect the results for the long-run frequencies include how much tape is used to create the stack and how sturdy the stack is. Discussing these points with students is a good summary of this lesson.

Exercise 8.
Create another stack of pennies. Consider creating a stack using 5 pennies, 15 pennies, or 20 pennies taped together in the same way you taped the pennies to form a stack of 10 pennies. Again, make sure the pennies are taped securely, or you might have a mess!
Toss the stack you made 30 times. Record the outcome for each toss:
Engage NY Math Grade 7 Module 5 Lesson 8 Exercise Answer Key 4
Answer:
The Problem Set involves another example of obtaining results from a stack of pennies. Suggestions include stacks of 5, 15, and 20 (or a chosen number). The Problem Set includes questions based on the results from tossing one of these stacks. Provide students in small groups one of these stacks. Each group should collect data for 30 tosses to use for the Problem Set.

Eureka Math Grade 7 Module 5 Lesson 8 Problem Set Answer Key

Question 1.
If you created a stack of 15 pennies taped together, do you think the probability of getting a heads on a toss of the stack would be different than for a stack of 10 pennies? Explain your answer.
Answer:
The estimated probability of getting a heads for a stack of 15 pennies would be different than for a stack of 10 pennies. A few tosses indicate that it is very unlikely that the outcome of heads or tails would result, as the stack almost always lands on its side. (The possibility of a heads or a tails is noted, but it has a small probability of being observed.)

Question 2.
If you created a stack of 20 pennies taped together, what do you think the probability of getting a heads on a toss of the stack would be? Explain your answer.
Answer:
The estimated probability of getting a heads for a stack of 20 pennies is very small. The toss of a stack of this number of pennies almost always lands on its side.

Question 3.
Based on your work in this lesson, complete the following table of the relative frequencies of heads for the stack you created:
Eureka Math 7th Grade Module 5 Lesson 8 Problem Set Answer Key 1
Answer:
Answers will vary based on the outcomes of tossing the stack. Anticipate results of 0 for a stack of 20 pennies. Samples involving 15 pennies have a very small probability of showing heads.

Question 4.
What is your estimate of the probability that your stack of pennies will land heads up when tossed? Explain your answer.
Answer:
Answers will vary based on the relative frequencies.

Question 5.
Is there a theoretical probability you could use to compare to the estimated probability? Explain your answer.
Answer:
There is no theoretical probability that could be calculated to compare to the estimated probability.

Eureka Math Grade 7 Module 5 Lesson 8 Exit Ticket Answer Key

Question 1.
Which of the following graphs would not represent the relative frequencies of heads when tossing 1 penny? Explain your answer.
Eureka Math Grade 7 Module 5 Lesson 8 Exit Ticket Answer Key 1
Answer:
Graph A would not represent a possible graph of the relative frequencies. The first problem is the way Graph A starts. After the first toss, the probability would either be a 0 or a 1. Also, it seems to settle exactly to the theoretical probability without showing the slight changes from toss to toss.

Question 2.
Jerry indicated that after tossing a penny 30 times, the relative frequency of heads was 0.47 (to the nearest hundredth). He indicated that after 31 times, the relative frequency of heads was 0.55. Are Jerry’s summaries correct? Why or why not?
Answer:
Jerry’s summaries have errors. If he tossed the penny 30 times and the relative frequency of heads was 0.47, then he had 14 heads. If his next toss was heads, then the relative frequency would be \(\frac{15}{31}\), or 0.48 (to the nearest hundredth). If his next toss was tails, then the relative frequency would be \(\frac{14}{31}\), or 0.45 (to the nearest hundredth).

Question 3.
Jerry observed 5 heads in 100 tosses of his coin. Do you think this was a fair coin? Why or why not?
Answer:
Students should indicate Jerry’s coin is probably not a fair coin. The relative frequency of heads for a rather large number of tosses should be close to the theoretical probability. For this problem, the relative frequency of 0.05 is quite different from 0.5 and probably indicates that the coin is not fair.

Eureka Math Grade 7 Module 5 Lesson 7 Answer Key

Engage NY Eureka Math 7th Grade Module 5 Lesson 7 Answer Key

Eureka Math Grade 7 Module 5 Lesson 7 Example Answer Key

Example 1: Three Nights of Games
Recall a previous example where a family decides to play a game each night, and they all agree to use a tetrahedral die (a four-sided die in the shape of a pyramid where each of four possible outcomes is equally likely) each night to randomly determine if the game will be a board (B) or a card (C) game. The tree diagram mapping the possible overall outcomes over two consecutive nights was as follows:
Engage NY Math 7th Grade Module 5 Lesson 7 Example Answer Key 1
But how would the diagram change if you were interested in mapping the possible overall outcomes over three consecutive nights? To accommodate this additional third stage, you would take steps similar to what you did before. You would attach all possibilities for the third stage (Wednesday) to each branch of the previous stage (Tuesday).
Engage NY Math 7th Grade Module 5 Lesson 7 Example Answer Key 2
Answer:
Read through the example in the student lesson as a class. Convey the following important points about the tree diagram for this example:
 The tree diagram is an important way of organizing and visualizing outcomes.
 The tree diagram is particularly useful when the experiment can be thought of as occurring in stages.
 When the information about probabilities associated with each branch is included, the tree diagram facilitates the computation of the probabilities of possible outcomes.
 The basic principles of tree diagrams can apply to situations with more than two stages.

Example 2: Three Nights of Games (with Probabilities)
In Example 1, each night’s outcome is the result of a chance experiment (rolling the four-sided die). Thus, there is a probability associated with each night’s outcome.

By multiplying the probabilities of the outcomes from each stage, you can obtain the probability for each “branch of the tree.” In this case, you can figure out the probability of each of our eight outcomes.

For this family, a card game will be played if the die lands showing a value of 1, and a board game will be played if the die lands showing a value of 2, 3, or 4. This makes the probability of a board game (B) on a given night 0.75.
Let’s use a tree to examine the probabilities of the outcomes for the three days.
Engage NY Math 7th Grade Module 5 Lesson 7 Example Answer Key 3
Answer:
Ask students:
→ What does CBC represent?
CBC represents the following sequence: card game the first night, board game the second night, and card game the third night.

→ The probability of CBC is approximately 0.046785. What does this probability mean?
The probability of CBC is very small. This means that the outcome of CBC is not expected to happen very often.

Eureka Math Grade 7 Module 5 Lesson 7 Exercise Answer Key

Exercises 1 – 3
Exercise 1.
If BBB represents three straight nights of board games, what does CBB represent?
Answer:
CBB would represent a card game on the first night and a board game on each of the second and third nights.

Exercise 2.
List all outcomes where exactly two board games were played over three days. How many outcomes were there?
Answer:
BBC, BCB, and CBB—there are 3 outcomes.

Exercise 3.
There are eight possible outcomes representing the three nights. Are the eight outcomes representing the three nights equally likely? Why or why not?
Answer:
As in the exercises of the previous lesson, the probability of C and B are not the same. As a result, the probability of the outcome CCC (all three nights involve card games) is not the same as BBB (all three nights playing board games). The probability of playing cards was only \(\frac{1}{4}\) in the previous lesson.

Exercises 4 – 6
Exercise 4.
Probabilities for two of the eight outcomes are shown. Calculate the approximate probabilities for the remaining six outcomes.
Answer:
BBC: 0.75(0.75)(0.25) = 0.140625
BCB: 0.75(0.25)(0.75) = 0.140625
BCC: 0.75(0.25)(0.25) = 0.046875
CBB: 0.25(0.75)(0.75) = 0.140625
CCB: 0.25(0.25)(0.75) = 0.046875
CCC: 0.25(0.25)(0.25) = 0.015625

Exercise 5.
What is the probability that there will be exactly two nights of board games over the three nights?
Answer:
The three outcomes that contain exactly two nights of board games are BBC, BCB, and CBB. The probability of exactly two nights of board games would be the sum of the probabilities of these outcomes, or
0.140625 + 0.140625 + 0.140625 = 0.421875.

Exercise 6.
What is the probability that the family will play at least one night of card games?
Answer:
This “at least” question could be answered by subtracting the probability of no card games (BBB) from 1. When you remove the BBB from the list of eight outcomes, the remaining outcomes include at least one night of card games. The probability of three nights of board games (BBB) is 0.421875. Therefore, the probability of at least one night of card games would be the probability of all outcomes (or 1) minus the probability of all board games, or
1 – 0.421875 = 0.578125.

Exercises 7 – 10: Three Children
A neighboring family just welcomed their third child. It turns out that all 3 of the children in this family are girls, and they are not twins or triplets. Suppose that for each birth, the probability of a boy birth is 0.5, and the probability of a girl birth is also 0.5. What are the chances of having 3 girls in a family’s first 3 births?

Exercise 7.
Draw a tree diagram showing the eight possible birth outcomes for a family with 3 children (no twins or triplets). Use the symbol B for the outcome of boy and G for the outcome of girl. Consider the first birth to be the first stage. (Refer to Example 1 if you need help getting started.)
Answer:
Engage NY Math Grade 7 Module 5 Lesson 7 Exercise Answer Key 1

Exercise 8.
Write in the probabilities of each stage’s outcomes in the tree diagram you developed above, and determine the probabilities for each of the eight possible birth outcomes for a family with 3 children (no twins or triplets).
Answer:
In this case, since the probability of a boy is 0.5 and the probability of a girl is 0.5, each of the eight outcomes will have a probability of 0.125 of occurring.

Exercise 9.
What is the probability of a family having 3 girls in this situation? Is that greater than or less than the probability of having exactly 2 girls in 3 births?
Answer:
The probability of a family having 3 girls is 0.125. This is less than the probability of having exactly 2 girls in 3 births, which is 0.375 (the sum of the probabilities of GGB, GBG, and BGG). Note to teachers: Another way of explaining this to students is to point out that the probability of each outcome is the same, or 0.125. Therefore, the probability of 3 girls in 3 births is the probability of just one possible outcome. The probability of having exactly 2 girls in 3 births is the sum of the probabilities of three outcomes. Therefore, the probability of one of the outcomes is less than the probability of the sum of three outcomes (and again, emphasize that the probability of each outcome is the same).

Exercise 10.
What is the probability of a family of 3 children having at least 1 girl?
Answer:
The probability of having at least 1 girl would be found by subtracting the probability of no girls (or all boys, BBB) from 1, or 1-0.125 = 0.875.

Eureka Math Grade 7 Module 5 Lesson 7 Problem Set Answer Key

Question 1.
According to the Washington, D.C. Lottery’s website for its Cherry Blossom Double instant scratch game, the chance of winning a prize on a given ticket is about 17%. Imagine that a person stops at a convenience store on the way home from work every Monday, Tuesday, and Wednesday to buy a scratcher ticket and plays the game.
(Source: http://dclottery.com/games/scratchers/1223/cherry-blossom-doubler.aspx, accessed May 27, 2013)

a. Develop a tree diagram showing the eight possible outcomes of playing over these three days. Call stage one “Monday,” and use the symbols W for a winning ticket and L for a non-winning ticket.
b. What is the probability that the player will not win on Monday but will win on Tuesday and Wednesday?
c. What is the probability that the player will win at least once during the 3-day period?
Answer:
a.
Eureka Math 7th Grade Module 5 Lesson 7 Problem Set Answer Key 1
b. LWW outcome: 0.83(0.17)(0.17)≈0.024
c. “Winning at least once” would include all outcomes except LLL (which has a probability of approximately 0.5718). The probabilities of these outcomes would sum to about 0.4282.
This is also equal to 1-0.5718.

Question 2.
A survey company is interested in conducting a statewide poll prior to an upcoming election. They are only interested in talking to registered voters.

Imagine that 55% of the registered voters in the state are male and 45% are female. Also, consider that the distribution of ages may be different for each group. In this state, 30% of male registered voters are age 18 – 24, 37% are age 25 – 64, and 33% are 65 or older. 32% of female registered voters are age 18 – 24, 26% are age 25 – 64, and 42% are 65 or older.

The following tree diagram describes the distribution of registered voters. The probability of selecting a male registered voter age 18 – 24 is 0.165.
Eureka Math 7th Grade Module 5 Lesson 7 Problem Set Answer Key 2
a. What is the chance that the polling company will select a registered female voter age 65 or older?
b. What is the chance that the polling company will select any registered voter age 18 – 24?
Answer:
a. Female 65 or older: (0.45)(0.42) = 0.189
b. The probability of selecting any registered voter age 18 – 24 would be the sum of the probability of selecting a male registered voter age 18 – 24 and the probability of selecting a female registered voter age 18 – 24.
(0.55)(0.30) = 0.165
(0.45)(0.32) = 0.144
0.165 + 0.144 = 0.309
The probability of selecting any voter age 18 – 24 is 0.309.

Eureka Math Grade 7 Module 5 Lesson 7 Exit Ticket Answer Key

In a laboratory experiment, three mice will be placed in a simple maze that has just one decision point where a mouse can turn either left (L) or right (R). When the first mouse arrives at the decision point, the direction he chooses is recorded. The same is done for the second and the third mouse.
Question 1.
Draw a tree diagram where the first stage represents the decision made by the first mouse, the second stage represents the decision made by the second mouse, and so on. Determine all eight possible outcomes of the decisions for the three mice.
Answer:
Eureka Math Grade 7 Module 5 Lesson 7 Exit Ticket Answer Key 1

Question 2.
Use the tree diagram from Problem 1 to help answer the following question. If, for each mouse, the probability of turning left is 0.5 and the probability of turning right is 0.5, what is the probability that only one of the three mice will turn left?
Answer:
There are three outcomes that have exactly one mouse turning left: LRR, RLR, and RRL. Each has a probability of 0.125, so the probability of having only one of the three mice turn left is 0.375.

Question 3.
If the researchers conducting the experiment add food in the simple maze such that the probability of each mouse turning left is now 0.7, what is the probability that only one of the three mice will turn left? To answer the question, use the tree diagram from Problem 1.
Answer:
As in Problem 2, there are three outcomes that have exactly one mouse turning left: LRR, RLR, and RRL. However, with the adjustment made by the researcher, each of the three outcomes now has a probability of 0.063. So now, the probability of having only one of the three mice turn left is the sum of three equally likely outcomes of 0.063, or 0.063(3) = 0.189. The tree provides a way to organize the outcomes and the probabilities.
Eureka Math Grade 7 Module 5 Lesson 7 Exit Ticket Answer Key 2

Eureka Math Grade 7 Module 5 Lesson 6 Answer Key

Engage NY Eureka Math 7th Grade Module 5 Lesson 6 Answer Key

Eureka Math Grade 7 Module 5 Lesson 6 Example Answer Key

Example 1: Two Nights of Games
Imagine that a family decides to play a game each night. They all agree to use a tetrahedral die (i.e., a four-sided pyramidal die where each of four possible outcomes is equally likely—see the image at the end of this lesson) each night to randomly determine if they will play a board game (B) or a card game (C). The tree diagram mapping the possible overall outcomes over two consecutive nights will be developed below.
To make a tree diagram, first present all possibilities for the first stage (in this case, Monday).
Engage NY Math 7th Grade Module 5 Lesson 6 Example Answer Key 1
Then, from each branch of the first stage, attach all possibilities for the second stage (Tuesday).
Engage NY Math 7th Grade Module 5 Lesson 6 Example Answer Key 2
Note: If the situation has more than two stages, this process would be repeated until all stages have been presented.
a. If BB represents two straight nights of board games, what does CB represent?
b. List the outcomes where exactly one board game is played over two days. How many outcomes were there?
Answer:
a. CB would represent a card game on the first night and a board game on the second night.
b. BC and CB—there are two outcomes.

Example 2: Two Nights of Games (with Probabilities)
In Example 1, each night’s outcome is the result of a chance experiment (rolling the tetrahedral die). Thus, there is a probability associated with each night’s outcome.
By multiplying the probabilities of the outcomes from each stage, we can obtain the probability for each “branch of the tree.” In this case, we can figure out the probability of each of our four outcomes: BB, BC, CB, and CC.
For this family, a card game will be played if the die lands showing a value of 1, and a board game will be played if the die lands showing a value of 2, 3, or 4. This makes the probability of a board game (B) on a given night 0.75.
Engage NY Math 7th Grade Module 5 Lesson 6 Example Answer Key 3
a. The probabilities for two of the four outcomes are shown. Now, compute the probabilities for the two remaining outcomes.
b. What is the probability that there will be exactly one night of board games over the two nights?
Answer:
a. CB: (0.25)(0.75) = 0.1875
CC: (0.25)(0.25) = 0.0625

b. The two outcomes that contain exactly one night of board games are BC and CB. The probability of exactly one night of board games would be the sum of the probabilities of these outcomes (since the outcomes are disjoint). 0.1875 + 0.1875 = 0.375 (Note: Disjoint means two events that cannot both happen at once.)

Eureka Math Grade 7 Module 5 Lesson 6 Exercise Answer Key

Two friends meet at a grocery store and remark that a neighboring family just welcomed their second child. It turns out that both children in this family are girls, and they are not twins. One of the friends is curious about what the chances are of having 2 girls in a family’s first 2 births. Suppose that for each birth, the probability of a boy birth is 0.5 and the probability of a girl birth is also 0.5.

Exercise 1.
Draw a tree diagram demonstrating the four possible birth outcomes for a family with 2 children (no twins). Use the symbol B for the outcome of boy and G for the outcome of girl. Consider the first birth to be the first stage. (Refer to Example 1 if you need help getting started.)
Answer:
Engage NY Math Grade 7 Module 5 Lesson 6 Exercise Answer Key 1

Exercise 2.
Write in the probabilities of each stage’s outcome to the tree diagram you developed above, and determine the probabilities for each of the 4 possible birth outcomes for a family with 2 children (no twins).
Answer:
In this case, since the probability of a boy is 0.5 and the probability of a girl is 0.5, each of the four outcomes will have a 0.25 probability of occurring because (0.5)(0.5) = 0.25.

Exercise 3.
What is the probability of a family having 2 girls in this situation? Is that greater than or less than the probability of having exactly 1 girl in 2 births?
Answer:
The probability of a family having 2 girls is 0.25. This is less than the probability of having exactly 1 girl in 2 births, which is 0.5 (the sum of the probabilities of BG and GB).

Eureka Math Grade 7 Module 5 Lesson 6 Problem Set Answer Key

Question 1.
Imagine that a family of three (Alice, Bill, and Chester) plays bingo at home every night. Each night, the chance that any one of the three players will win is \(\frac{1}{3}\).
a. Using A for Alice wins, B for Bill wins, and C for Chester wins, develop a tree diagram that shows the nine possible outcomes for two consecutive nights of play.
b. Is the probability that “Bill wins both nights” the same as the probability that “Alice wins the first night and Chester wins the second night”? Explain.
Answer:
a.
Eureka Math 7th Grade Module 5 Lesson 6 Problem Set Answer Key 2
b. Yes. The probability of Bill winning both nights is \(\frac{1}{3}\) ∙ \(\frac{1}{3}\) = \(\frac{1}{9}\), which is the same as the probability of Alice winning the first night and Chester winning the second night (\(\frac{1}{3}\)∙\(\frac{1}{3}\) = \(\frac{1}{9}\)).

Question 2.
According to the Washington, D.C. Lottery’s website for its Cherry Blossom Doubler instant scratch game, the chance of winning a prize on a given ticket is about 17%. Imagine that a person stops at a convenience store on the way home from work every Monday and Tuesday to buy a scratcher ticket to play the game.
(Source: http://dclottery.com/games/scratchers/1223/cherry-blossom-doubler.aspx, accessed May 27, 2013)

a. Develop a tree diagram showing the four possible outcomes of playing over these two days. Call stage 1 “Monday,” and use the symbols W for a winning ticket and L for a non-winning ticket.
b. What is the chance that the player will not win on Monday but will win on Tuesday?
c. What is the chance that the player will win at least once during the two-day period?
Answer:
a.
Eureka Math 7th Grade Module 5 Lesson 6 Problem Set Answer Key 3
b. LW outcome: (0.83)(0.17) = 0.1411
c. “Winning at least once” would include all outcomes except LL (which has a 0.6889 probability). The probabilities of these outcomes would sum to 0.3111.

Image of Tetrahedral Die
Source: http://commons.wikimedia.org/wiki/File:4-sided_dice_250.jpg
Photo by Fantasy, via Wikimedia Commons, is licensed under CC BY-SA 3.0,
http://creativecommons.org/licenses/by-sa/3.0/deed.en.
Eureka Math 7th Grade Module 5 Lesson 6 Problem Set Answer Key 1

Eureka Math Grade 7 Module 5 Lesson 6 Exit Ticket Answer Key

In a laboratory experiment, two mice will be placed in a simple maze with one decision point where a mouse can turn either left (L) or right (R). When the first mouse arrives at the decision point, the direction it chooses is recorded. Then, the process is repeated for the second mouse.
Question 1.
Draw a tree diagram where the first stage represents the decision made by the first mouse and the second stage represents the decision made by the second mouse. Determine all four possible decision outcomes for the two mice.
Answer:
Eureka Math Grade 7 Module 5 Lesson 6 Exit Ticket Answer Key 1

Question 2.
If the probability of turning left is 0.5 and the probability of turning right is 0.5 for each mouse, what is the probability that only one of the two mice will turn left?
Answer:
There are two outcomes that have exactly one mouse turning left: LR and RL. Each has a probability of 0.25, so the probability of only one of the two mice turning left is 0.25 + 0.25 = 0.5.

Question 3.
If the researchers add food in the simple maze such that the probability of each mouse turning left is now 0.7, what is the probability that only one of the two mice will turn left?
Answer:
Eureka Math Grade 7 Module 5 Lesson 6 Exit Ticket Answer Key 2
As in Problem 2, there are two outcomes that have exactly one mouse turning left: LR and RL. However, with the adjustment made by the researcher, each of these outcomes now has a probability of 0.21. So now, the probability of only one of the two mice turning left is 0.21 + 0.21 = 0.42.

Eureka Math Grade 7 Module 5 Lesson 5 Answer Key

Engage NY Eureka Math 7th Grade Module 5 Lesson 5 Answer Key

Eureka Math Grade 7 Module 5 Lesson 5 Example Answer Key

Example 1.
When Jenna goes to the farmers’ market, she usually buys bananas. The number of bananas she might buy and their probabilities are shown in the table below.
Engage NY Math 7th Grade Module 5 Lesson 5 Example Answer Key 1
a. What is the probability that Jenna buys exactly 3 bananas?
b. What is the probability that Jenna does not buy any bananas?
c. What is the probability that Jenna buys more than 3 bananas?
d. What is the probability that Jenna buys at least 3 bananas?
e. What is the probability that Jenna does not buy exactly 3 bananas?
Notice that the sum of the probabilities in the table is one whole (0.1 + 0.1 + 0.1 + 0.2 + 0.2 + 0.3 = 1). This is always true; when we add up the probabilities of all the possible outcomes, the result is always 1. So, taking 1 and subtracting the probability of the event gives us the probability of something not occurring.
Answer:
a. You can see from the table that the probability that Jenna buys exactly 3 bananas is 0.2, or 20%.
b. The probability that Jenna buys 0 bananas is 0.1, or 10%.
c. The probability that Jenna buys 4 or 5 bananas is 0.2 + 0.3 = 0.5, or 50%.
d. The probability that Jenna buys 3, 4, or 5 bananas is 0.2 + 0.2 + 0.3 = 0.7, or 70%.
e. Remember that the probability that an event does not happen is
1-(the probability that the event does happen).
So, the probability that Jenna does not buy exactly 3 bananas is
1-(the probability that she does buy exactly 3 bananas)
1-0.2 = 0.8, or 80%.

Example 2.
Luis works in an office, and the phone rings occasionally. The possible number of phone calls he receives in an afternoon and their probabilities are given in the table below.
Engage NY Math 7th Grade Module 5 Lesson 5 Example Answer Key 2
a. Find the probability that Luis receives 3 or 4 phone calls.
b. Find the probability that Luis receives fewer than 2 phone calls.
c. Find the probability that Luis receives 2 or fewer phone calls.
d. Find the probability that Luis does not receive 4 phone calls.
Answer:
a. The probability that Luis receives 3 or 4 phone calls is \(\frac{1}{3}\) + \(\frac{1}{9}\) = \(\frac{3}{9}\) + \(\frac{1}{9}\) = \(\frac{4}{9}\).
b. The probability that Luis receives fewer than 2 phone calls is \(\frac{1}{6}\) + \(\frac{1}{6}\) = \(\frac{2}{6}\) = \(\frac{1}{3}\).
c. The probability that Luis receives 2 or fewer phone calls is \(\frac{2}{9}\) + \(\frac{1}{6}\) + \(\frac{1}{6}\) = \(\frac{4}{18}\) + \(\frac{3}{18}\) + \(\frac{3}{18}\) = \(\frac{10}{18}\) = \(\frac{5}{9}\).
d. The probability that Luis does not receive 4 phone calls is 1-\(\frac{1}{9}\) = \(\frac{9}{9}\)–\(\frac{1}{9}\) = \(\frac{8}{9}\).

If there is time available, ask students:
How would you calculate the probability that Luis receives at least one call? What might be a quicker way of doing this?
→ I would add the probabilities for 1, 2, 3, and 4:
\(\frac{1}{6} + \frac{2}{9} + \frac{1}{3} + \frac{1}{9}\) = \(\frac{3}{18} + \frac{4}{18} + \frac{2}{18}\) = \(\frac{15}{18}\) = \(\frac{5}{6}\)
→ The quicker way is to say that the probability he gets at least one call is the probability that he does not get zero calls, and so the required probability is 1-\(\frac{1}{6}\) = \(\frac{5}{6}\).

Eureka Math Grade 7 Module 5 Lesson 5 Exercise Answer Key

Exercises 1–2
Jenna’s husband, Rick, is concerned about his diet. On any given day, he eats 0, 1, 2, 3, or 4 servings of fruits and vegetables. The probabilities are given in the table below.
Engage NY Math Grade 7 Module 5 Lesson 5 Exercise Answer Key 1

Exercise 1.
1. On a given day, find the probability that Rick eats
a. Two servings of fruits and vegetables
b. More than two servings of fruits and vegetables
c. At least two servings of fruits and vegetables
Answer:
a. 0.28
b. 0.39 + 0.12 = 0.51
c. 0.28 + 0.39 + 0.12 = 0.79

Exercise 2.
Find the probability that Rick does not eat exactly two servings of fruits and vegetables.
Answer:
1-0.28 = 0.72

Exercises 3–7
When Jenna goes to the farmers’ market, she also usually buys some broccoli. The possible number of heads of broccoli that she buys and the probabilities are given in the table below.
Engage NY Math Grade 7 Module 5 Lesson 5 Exercise Answer Key 2

Exercise 3.
Find the probability that Jenna:
a. Buys exactly 3 heads of broccoli
b. Does not buy exactly 3 heads of broccoli
c. Buys more than 1 head of broccoli
d. Buys at least 3 heads of broccoli
Answer:
a. \(\frac{1}{4}\)
b. 1-\(\frac{1}{4}\) = \(\frac{3}{4}\)
c. \(\frac{5}{12}\) + \(\frac{1}{4}\) + \(\frac{1}{12}\) = \(\frac{3}{4}\)
d. \(\frac{1}{4}\) + \(\frac{1}{12}\) = \(\frac{1}{3}\)

The diagram below shows a spinner designed like the face of a clock. The sectors of the spinner are colored red (R), blue (B), green (G), and yellow (Y).
Engage NY Math Grade 7 Module 5 Lesson 5 Exercise Answer Key 3

Exercise 4.
Writing your answers as fractions in lowest terms, find the probability that the pointer stops on the following colors.
a. Red:
b. Blue:
c. Green:
d. Yellow:
Answer:
a. Red: \(\frac{1}{12}\)
b. Blue: \(\frac{2}{12}\) = \(\frac{1}{6}\)
c. Green: \(\frac{5}{12}\)
d. Yellow: \(\frac{4}{12}\) = \(\frac{1}{3}\)

Exercise 5.
Complete the table of probabilities below.
Engage NY Math Grade 7 Module 5 Lesson 5 Exercise Answer Key 4
Answer:
Engage NY Math Grade 7 Module 5 Lesson 5 Exercise Answer Key 5

Exercise 6.
Find the probability that the pointer stops in either the blue region or the green region.
Answer:
\(\frac{1}{6}\) + \(\frac{5}{12}\) = \(\frac{7}{12}\)

Exercise 7.
Find the probability that the pointer does not stop in the green region.
Answer:
1-\(\frac{5}{12}\) = \(\frac{7}{12}\)

Eureka Math Grade 7 Module 5 Lesson 5 Problem Set Answer Key

Question 1.
The Gator Girls is a soccer team. The possible number of goals the Gator Girls will score in a game and their probabilities are shown in the table below.
Eureka Math 7th Grade Module 5 Lesson 5 Problem Set Answer Key 1
Find the probability that the Gator Girls:
a. Score more than two goals
b. Score at least two goals
c. Do not score exactly 3 goals
Answer:
a. 0.11 + 0.03 = 0.14
b. 0.33 + 0.11 + 0.03 = 0.47
c. 1-0.11 = 0.89

Question 2.
The diagram below shows a spinner. The pointer is spun, and the player is awarded a prize according to the color on which the pointer stops.
Eureka Math 7th Grade Module 5 Lesson 5 Problem Set Answer Key 2
a. What is the probability that the pointer stops in the red region?
b. Complete the table below showing the probabilities of the three possible results.
Eureka Math 7th Grade Module 5 Lesson 5 Problem Set Answer Key 4
c. Find the probability that the pointer stops on green or blue.
d. Find the probability that the pointer does not stop on green.
Answer:
a. \(\frac{1}{2}\)
b. Eureka Math 7th Grade Module 5 Lesson 5 Problem Set Answer Key 6
c. \(\frac{1}{4}\) + \(\frac{1}{4}\) = \(\frac{1}{2}\)
d. 1-\(\frac{1}{4}\) = \(\frac{3}{4}\)

Question 3.
Wayne asked every student in his class how many siblings (brothers and sisters) they had. The survey results are shown in the table below. (Wayne included himself in the results.)
Eureka Math 7th Grade Module 5 Lesson 5 Problem Set Answer Key 4
(Note: The table tells us that 4 students had no siblings, 5 students had one sibling, 14 students had two siblings, and so on.)
a. How many students are there in Wayne’s class, including Wayne?
b. What is the probability that a randomly selected student does not have any siblings? Write your answer as a fraction in lowest terms.
c. The table below shows the possible number of siblings and the probabilities of each number. Complete the table by writing the probabilities as fractions in lowest terms.
Eureka Math 7th Grade Module 5 Lesson 5 Problem Set Answer Key 5
d. Writing your answers as fractions in lowest terms, find the probability that the student:
i. Has fewer than two siblings
ii. Has two or fewer siblings
iii. Does not have exactly one sibling
Answer:
a. 4 + 5 + 14 + 6 + 3 = 32
b. \(\frac{4}{32}\) = \(\frac{1}{8}\)
c. Eureka Math 7th Grade Module 5 Lesson 5 Problem Set Answer Key 7

d. i) \(\frac{1}{8} + \frac{5}{32}\) = \(\frac{9}{32}\)
ii) \(\frac{1}{8} + \frac{5}{32} + \frac{7}{16}\) = \(\frac{23}{32}\)
iii) 1-\(\frac{5}{32}\) = \(\frac{27}{32}\)

Eureka Math Grade 7 Module 5 Lesson 5 Exit Ticket Answer Key

Carol is sitting on the bus on the way home from school and is thinking about the fact that she has three homework assignments to do tonight. The table below shows her estimated probabilities of completing 0, 1, 2, or all 3 of the assignments.
Eureka Math Grade 7 Module 5 Lesson 5 Exit Ticket Answer Key 1
Question 1.
Writing your answers as fractions in lowest terms, find the probability that Carol completes
a. Exactly one assignment
b. More than one assignment
c. At least one assignment
Answer:
a. \(\frac{2}{9}\)
b. \(\frac{5}{18} + \frac{1}{3}\) = \(\frac{5}{18} + \frac{6}{18}\) = \(\frac{11}{18}\)
c. \(\frac{2}{9} + \frac{5}{18} + \frac{1}{3}\) = \(\frac{4}{18} + \frac{5}{18} + \frac{6}{18}\) = \(\frac{15}{18}\) = \(\frac{5}{6}\)

Question 2.
Find the probability that the number of homework assignments Carol completes is not exactly 2.
Answer:
1-\(\frac{5}{18}\) = \(\frac{13}{18}\)

Question 3.
Carol has a bag containing 3 red chips, 10 blue chips, and 7 green chips. Estimate the probability (as a fraction or decimal) of Carol reaching into her bag and pulling out a green chip.
Answer:
An estimate of the probability would be 7 out of 20, \(\frac{7}{20}\), or 0.35.

Eureka Math Grade 7 Module 5 Lesson 4 Answer Key

Engage NY Eureka Math 7th Grade Module 5 Lesson 4 Answer Key

Eureka Math Grade 7 Module 5 Lesson 4 Example Answer Key

Examples: Theoretical Probability
In a previous lesson, you saw that to find an estimate of the probability of an event for a chance experiment you divide
P(event) = \(\frac{\text { Number of observed occurrences of the event }}{\text { Total number of observations }}\)
Your teacher has a bag with some cubes colored yellow, green, blue, and red. The cubes are identical except for their color. Your teacher will conduct a chance experiment by randomly drawing a cube with replacement from the bag. Record the outcome of each draw in the table below.
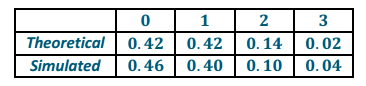
Engage NY Math 7th Grade Module 5 Lesson 4 Example Answer Key 1
Answer:
Engage NY Math 7th Grade Module 5 Lesson 4 Example Answer Key 2
Engage NY Math 7th Grade Module 5 Lesson 4 Example Answer Key 3

Example 1.
Based on the 20 trials, estimate for the probability of
a. Choosing a yellow cube
b. Choosing a green cube
c. Choosing a red cube
d. Choosing a blue cube
Answer:
a. Answers will vary but should be approximately \(\frac{5}{20}\), or \(\frac{1}{4}\). The probability in the sample provided is \(\frac{5}{20}\), or \(\frac{1}{4}\) .

b. Answers will vary but should be approximately \(\frac{5}{20}\), or \(\frac{1}{4}\). The probability in the sample provided is \(\frac{6}{20}\), or \(\frac{3}{10}\).

c. Answers will vary but should be approximately \(\frac{5}{20}\), or \(\frac{1}{4}\). The probability in the sample provided is \(\frac{4}{20}\), or \(\frac{1}{5}\).

d. Answers will vary but should be approximately \(\frac{5}{20}\), or \(\frac{1}{4}\). The probability in the sample provided is \(\frac{5}{20}\), or \(\frac{1}{4}\).

Example 2.
If there are 40 cubes in the bag, how many cubes of each color are in the bag? Explain.
Answer:
Answers will vary. Because the estimated probabilities are about the same for each color, we can predict that there are approximately the same number of each color of cube in the bag. Since an equal number of each color is estimated, approximately 10 of each color are predicted.

Example 3.
If your teacher were to randomly draw another 20 cubes one at a time and with replacement from the bag, would you see exactly the same results? Explain.
Answer:
No. This is an example of a chance experiment, so the results will vary.

Example 4.
Find the fraction of each color of cubes in the bag.
Yellow
Green
Red
Blue
Answer:
Yellow \(\frac{10}{40}\), or \(\frac{1}{4}\)
Green \(\frac{10}{40}\), or \(\frac{1}{4}\)
Red \(\frac{10}{40}\), or \(\frac{1}{4}\)
Blue \(\frac{10}{40}\), or \(\frac{1}{4}\)
Present the formal definition of the theoretical probability of an outcome when outcomes are equally likely. Then, ask
→ Why is the numerator of the fraction just 1?
Since the outcomes are equally likely, each one of the outcomes is just as likely as the other.
Define the word event as “a collection of outcomes.” Then, present that definition to students, and ask

→ Why is the numerator of the fraction not always 1?
Since there is a collection of outcomes, there may be more than one favorable outcome.
Use the cube example to explain the difference between an outcome and an event. Explain that each cube is equally likely to be chosen (an outcome), while the probability of drawing a blue cube (an event) is \(\frac{10}{40}\).

Each fraction is the theoretical probability of choosing a particular color of cube when a cube is randomly drawn from the bag.

When all the possible outcomes of an experiment are equally likely, the probability of each outcome is
P(outcome) = \(\frac{1}{\text { Number of possible outcomes }}\)

An event is a collection of outcomes, and when the outcomes are equally likely, the theoretical probability of an event can be expressed as
P(event) = \(\frac{\text { Number of favorable outcomes }}{\text { Number of possible outcomes }}\).

The theoretical probability of drawing a blue cube is
P(blue) = \(\frac{\text { Number of blue cubes }}{\text { Total number of cubes }}\) = \(\frac{10}{40}\).
Answer:

Example 5.
Is each color equally likely to be chosen? Explain your answer.
Answer:
Yes. There are the same numbers of cubes for each color.

Example 6.
How do the theoretical probabilities of choosing each color from Exercise 4 compare to the experimental probabilities you found in Exercise 1?
Answer:
Answers will vary.

Example 7.
An experiment consisted of flipping a nickel and a dime. The first step in finding the theoretical probability of obtaining a heads on the nickel and a heads on the dime is to list the sample space. For this experiment, complete the sample space below.
Nickel Dime
What is the probability of flipping two heads?
Answer:
Engage NY Math 7th Grade Module 5 Lesson 4 Example Answer Key 4
If the coins are fair, these outcomes are equally likely, so the probability of each outcome is \(\frac{1}{4}\).
Engage NY Math 7th Grade Module 5 Lesson 4 Example Answer Key 5
The probability of two heads is \(\frac{1}{4}\) or P(two heads) = \(\frac{1}{4}\).

Eureka Math Grade 7 Module 5 Lesson 4 Exercise Answer Key

Exercises 1–4
Exercise 1.
Consider a chance experiment of rolling a six-sided number cube with the numbers 1–6 on the faces.
a. What is the sample space? List the probability of each outcome in the sample space.
b. What is the probability of rolling an odd number?
c. What is the probability of rolling a number less than 5?
Answer:
a. Sample space: 1, 2, 3, 4, 5, 6
Probability of each outcome is \(\frac{1}{6}\).

b. \(\frac{3}{6}\), or \(\frac{1}{2}\)

c. \(\frac{4}{6}\), or \(\frac{2}{3}\)

Exercise 2.
Consider an experiment of randomly selecting a letter from the word number.
a. What is the sample space? List the probability of each outcome in the sample space.
b. What is the probability of selecting a vowel?
c. What is the probability of selecting the letter z?
Answer:
a. Sample space: n, u, m, b, e, r
Probability of each outcome is \(\frac{1}{6}\).

b. \(\frac{2}{6}\), or \(\frac{1}{3}\)

c. \(\frac{0}{6}\), or 0

Exercise 3.
Consider an experiment of randomly selecting a square from a bag of 10 squares.
a. Color the squares below so that the probability of selecting a blue square is \(\frac{1}{2}\).
Engage NY Math Grade 7 Module 5 Lesson 4 Exercise Answer Key 1
b. Color the squares below so that the probability of selecting a blue square is \(\frac{4}{5}\).
Engage NY Math Grade 7 Module 5 Lesson 4 Exercise Answer Key 2
Answer:
a. Five squares should be colored blue.
b. Eight squares should be colored blue.

Exercise 4.
Students are playing a game that requires spinning the two spinners shown below. A student wins the game if both spins land on red. What is the probability of winning the game? Remember to first list the sample space and the probability of each outcome in the sample space. There are eight possible outcomes to this chance experiment.
Engage NY Math Grade 7 Module 5 Lesson 4 Exercise Answer Key 3
Answer:
Sample space: R1 R2, R1 B2, R1 G2, R1 Y2, B1 R2, B1 B2, B1 G2, B1 Y2
Each outcome has a probability of \(\frac{1}{8}\).
Probability of a win (both red) is\(\frac{1}{8}\).

Eureka Math Grade 7 Module 5 Lesson 4 Problem Set Answer Key

Question 1.
In a seventh-grade class of 28 students, there are 16 girls and 12 boys. If one student is randomly chosen to win a prize, what is the probability that a girl is chosen?
Answer:
\(\frac{16}{28}\), or \(\frac{4}{7}\)

Question 2.
An experiment consists of spinning the spinner once.
Eureka Math 7th Grade Module 5 Lesson 4 Problem Set Answer Key 1
a. Find the probability of landing on a 2.
b. Find the probability of landing on a 1.
c. Is landing in each section of the spinner equally likely to occur? Explain.
Answer:
a. \(\frac{2}{8}\), or \(\frac{1}{4}\)
b. \(\frac{3}{8}\)
c. Yes. Each section is the same size.

Question 3.
An experiment consists of randomly picking a square section from the board shown below.
Eureka Math 7th Grade Module 5 Lesson 4 Problem Set Answer Key 2
a. Find the probability of choosing a triangle.
b. Find the probability of choosing a star.
c. Find the probability of choosing an empty square.
d. Find the probability of choosing a circle.
Answer:
a. \(\frac{8}{16}\), or \(\frac{1}{2}\)
b. \(\frac{4}{16}\), or \(\frac{1}{4}\)
c. \(\frac{4}{16}\), or \(\frac{1}{4}\)
d. \(\frac{0}{16}\), or 0

Question 4.
Seventh graders are playing a game where they randomly select two integers 0–9, inclusive, to form a two-digit number. The same integer might be selected twice.
a. List the sample space for this chance experiment. List the probability of each outcome in the sample space.
b. What is the probability that the number formed is between 90 and 99, inclusive?
c. What is the probability that the number formed is evenly divisible by 5?
d. What is the probability that the number formed is a factor of 64?
Answer:
a. Sample space: Numbers 00–99 Probability of each outcome is \(\frac{1}{100}\).
b. \(\frac{10}{100}\), or \(\frac{1}{10}\)
c. \(\frac{20}{100}\), or \(\frac{1}{5}\)
d. \(\frac{7}{100}\) (Factors of 64 are 1, 2, 4, 8, 16, 32, and 64.)

Question 5.
A chance experiment consists of flipping a coin and rolling a number cube with the numbers 1–6 on the faces of the cube.
a. List the sample space of this chance experiment. List the probability of each outcome in the sample space.
b. What is the probability of getting a heads on the coin and the number 3 on the number cube?
c. What is the probability of getting a tails on the coin and an even number on the number cube?
Answer:
a. Sample space: H1, H2, H3, H4, H5, H6, T1, T2, T3, T4, T5, T6 The probability of each outcome is \(\frac{1}{12}\).
b. \(\frac{1}{12}\)
c. \(\frac{3}{12}\), or \(\frac{1}{4}\)

Question 6.
A chance experiment consists of spinning the two spinners below.
Eureka Math 7th Grade Module 5 Lesson 4 Problem Set Answer Key 3
a. List the sample space and the probability of each outcome.
b. Find the probability of the event of getting a red on the first spinner and a red on the second spinner.
c. Find the probability of a red on at least one of the spinners.
Answer:
a. Sample space: R1 R2, R1 G2, R1 Y2, B1 R2, B1 G2, B1 Y2 Each outcome has a probability of \(\frac{1}{6}\).
b. \(\frac{1}{6}\)
c. \(\frac{4}{6}\), or \(\frac{2}{3}\)

Eureka Math Grade 7 Module 5 Lesson 4 Exit Ticket Answer Key

An experiment consists of randomly drawing a cube from a bag containing three red and two blue cubes.
Question 1.
What is the sample space of this experiment?
Answer:
Red, blue

Question 2.
List the probability of each outcome in the sample space.
Answer:
Probability of red is \(\frac{3}{5}\). Probability of blue is \(\frac{2}{5}\).

Question 3.
Is the probability of selecting a red cube equal to the probability of selecting a blue cube? Explain.
Answer:
No. There are more red cubes than blue cubes, so red has a greater probability of being chosen.

Eureka Math Grade 7 Module 5 Lesson 1 Answer Key

Engage NY Eureka Math 7th Grade Module 5 Lesson 1 Answer Key

Eureka Math Grade 7 Module 5 Lesson 1 Example Answer Key

Example 1: Spinner Game
Suppose you and your friend are about to play a game using the spinner shown here:
Engage NY Math 7th Grade Module 5 Lesson 1 Example Answer Key 1
Rules of the game:
1. Decide who will go first.
2. Each person picks a color. Both players cannot pick the same color.
3. Each person takes a turn spinning the spinner and recording what color the spinner stops on. The winner is the person whose color is the first to happen 10 times.
Play the game, and remember to record the color the spinner stops on for each spin.
Answer:
Students try their spinners a few times before starting the game. Before students begin to play the game, discuss who should go first. Consider, for example, having the person born earliest in the year go first. If it is a tie, consider another option like tossing a coin. Discuss with students the following questions:
→ Will it make a difference who goes first?
The game is designed so that the spinner landing on green is more likely to occur. Therefore, if the first person selects green, this person has an advantage.

→ Who do you think will win the game?
The person selecting green has an advantage.

→ Do you think this game is fair?
No. The spinner is designed so that green will occur more often. As a result, the student who selects green will have an advantage.

→ Play the game, and remember to record the color the spinner stops on for each spin.

Example 2: What Is Probability?
Probability is a measure of how likely it is that an event will happen. A probability is indicated by a number between 0 and 1. Some events are certain to happen, while others are impossible. In most cases, the probability of an event happening is somewhere between certain and impossible.
For example, consider a bag that contains only red cubes. If you were to select one cube from the bag, you are certain to pick a red one. We say that an event that is certain to happen has a probability of 1. If we were to reach into the same bag of cubes, it is impossible to select a yellow cube. An impossible event has a probability of 0.
Engage NY Math 7th Grade Module 5 Lesson 1 Example Answer Key 2
The figure below shows the probability scale.
Engage NY Math 7th Grade Module 5 Lesson 1 Example Answer Key 3
Answer:
Engage NY Math 7th Grade Module 5 Lesson 1 Example Answer Key 4

Eureka Math Grade 7 Module 5 Lesson 1 Exercise Answer Key

Exercise 1.
Which color was the first to occur 10 times?
Answer:
Answers will vary, but green is the most likely.

Exercise 2.
Do you think it makes a difference who goes first to pick a color?
Answer:
Yes. The person who goes first could pick green.

Exercise 3.
Which color would you pick to give you the best chance of winning the game? Why would you pick that color?
Answer:
Green would give the best chance of winning the game because it has the largest section on the spinner.

Exercise 4.
Below are three different spinners. On which spinner is the green likely to win, unlikely to win, and equally likely to win?
Engage NY Math Grade 7 Module 5 Lesson 1 Exercise Answer Key 1
Answer:
Green is likely to win on Spinner B, unlikely to win on Spinner C, and equally likely to win on Spinner A.

Exercise 5.
Decide where each event would be located on the scale above. Place the letter for each event in the appropriate place on the probability scale.
Event:
A. You will see a live dinosaur on the way home from school today.
B. A solid rock dropped in the water will sink.
C. A round disk with one side red and the other side yellow will land yellow side up when flipped.
D. A spinner with four equal parts numbered 1–4 will land on the 4 on the next spin.
E. Your full name will be drawn when a full name is selected randomly from a bag containing the full names of all of the students in your class.
F. A red cube will be drawn when a cube is selected from a bag that has five blue cubes and five red cubes.
G. Tomorrow the temperature outside will be -250 degrees.
Answer:
Answers are noted on the probability scale above.
Event:
A. Probability is 0, or impossible, as there are no live dinosaurs.
B. Probability is 1, or certain to occur, as rocks are typically more dense than the water they displace.
C. Probability is \(\frac{1}{2}\), as there are two sides that are equally likely to land up when the disk is flipped.

D. Probability of landing on the 4 would be \(\frac{1}{4}\), regardless of what spin was made. Based on the scale provided, this would indicate a probability halfway between impossible and equally likely, which can be classified as being unlikely to occur.

E. Probability is between impossible and equally likely to occur, assuming there are more than two students in the class. If there were two students, then the probability would be equally likely. If there were only one student in the class, then the probability would be certain to occur. If, however, there were more than two students, the probability would be between impossible and equally likely to occur.

F. Probability would be equally likely to occur as there are an equal number of blue and red cubes.
G. Probability is impossible, or 0, as there are no recorded temperatures at -250 degrees Fahrenheit or Celsius.

Exercise 6.
Design a spinner so that the probability of spinning a green is 1.
Answer:
The spinner is all green.
Engage NY Math Grade 7 Module 5 Lesson 1 Exercise Answer Key 2

Exercise 7.
Design a spinner so that the probability of spinning a green is 0.
Answer:
The spinner can include any color but green.
Engage NY Math Grade 7 Module 5 Lesson 1 Exercise Answer Key 3

Exercise 8.
Design a spinner with two outcomes in which it is equally likely to land on the red and green parts.
Answer:
The red and green areas should be equal.
Engage NY Math Grade 7 Module 5 Lesson 1 Exercise Answer Key 4

An event that is impossible has a probability of 0 and will never occur, no matter how many observations you make. This means that in a long sequence of observations, it will occur 0% of the time. An event that is certain has a probability of 1 and will always occur. This means that in a long sequence of observations, it will occur 100% of the time.
Exercise 9.
What do you think it means for an event to have a probability of \(\frac{1}{2}\)?
Answer:
In a long sequence of observations, it would occur about half the time.

Exercise 10.
What do you think it means for an event to have a probability of \(\frac{1}{4}\)?
Answer:
In a long sequence of observations, it would occur about 25% of the time.

Eureka Math Grade 7 Module 5 Lesson 1 Problem Set Answer Key

Question 1.
Match each spinner below with the words impossible, unlikely, equally likely to occur or not occur, likely, and certain to describe the chance of the spinner landing on black.
Eureka Math 7th Grade Module 5 Lesson 1 Problem Set Answer Key 1
Answer:
Eureka Math 7th Grade Module 5 Lesson 1 Problem Set Answer Key 8

Question 2.
Decide if each of the following events is impossible, unlikely, equally likely to occur or not occur, likely, or certain to occur.
a. A vowel will be picked when a letter is randomly selected from the word lieu.
b. A vowel will be picked when a letter is randomly selected from the word math.
c. A blue cube will be drawn from a bag containing only five blue and five black cubes.
d. A red cube will be drawn from a bag of 100 red cubes.
e. A red cube will be drawn from a bag of 10 red and 90 blue cubes.
Answer:
a. Likely; most of the letters of the word lieu are vowels.
b. Unlikely; most of the letters of the word math are not vowels.
c. Equally likely to occur or not occur; the number of blue and black cubes in the bag is the same.
d. Certain; the only cubes in the bag are red.
e. Unlikely; most of the cubes in the bag are blue.

Question 3.
A shape will be randomly drawn from the box shown below. Decide where each event would be located on the probability scale. Then, place the letter for each event on the appropriate place on the probability scale.
Eureka Math 7th Grade Module 5 Lesson 1 Problem Set Answer Key 2
Event:
A. A circle is drawn.
B. A square is drawn.
C. A star is drawn.
D. A shape that is not a square is drawn.
Probability Scale
Eureka Math 7th Grade Module 5 Lesson 1 Problem Set Answer Key 3
Answer:
Eureka Math 7th Grade Module 5 Lesson 1 Problem Set Answer Key 9

Question 4.
Color the squares below so that it would be equally likely to choose a blue or yellow square.
Eureka Math 7th Grade Module 5 Lesson 1 Problem Set Answer Key 4
Answer:
Color five squares blue and five squares yellow.

Question 5.
Color the squares below so that it would be likely but not certain to choose a blue square from the bag.
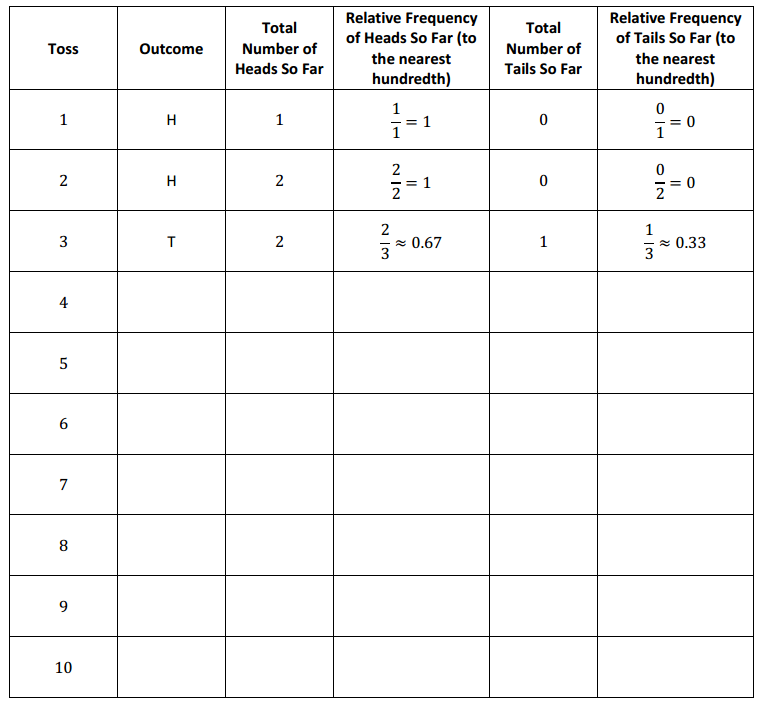
Eureka Math 7th Grade Module 5 Lesson 1 Problem Set Answer Key 5
Answer:
Color 6, 7, 8, or 9 squares blue and the rest any other color.

Question 6.
Color the squares below so that it would be unlikely but not impossible to choose a blue square from the bag.
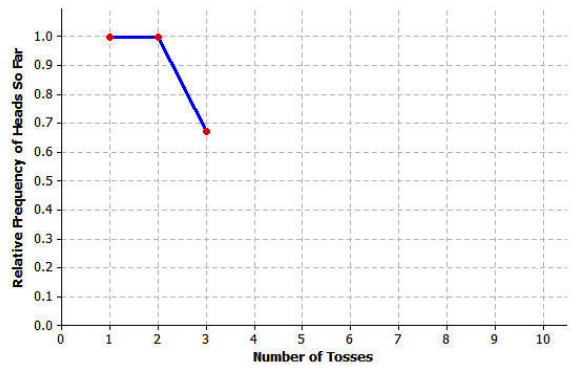
Eureka Math 7th Grade Module 5 Lesson 1 Problem Set Answer Key 6
Answer:
Color 1, 2, 3, or 4 squares blue and the others any other color.

Question 7.
Color the squares below so that it would be impossible to choose a blue square from the bag.
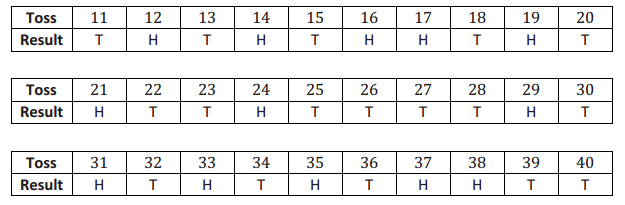
Eureka Math 7th Grade Module 5 Lesson 1 Problem Set Answer Key 7
Answer:
Color all squares any color but blue.

Eureka Math Grade 7 Module 5 Lesson 1 Exit Ticket Answer Key

Question 1.
Decide where each of the following events would be located on the scale below. Place the letter for each event on the appropriate place on the probability scale.
Eureka Math Grade 7 Module 5 Lesson 1 Exit Ticket Answer Key 1
The numbers from 1 to 10 are written on small pieces of paper and placed in a bag. A piece of paper will be drawn from the bag.
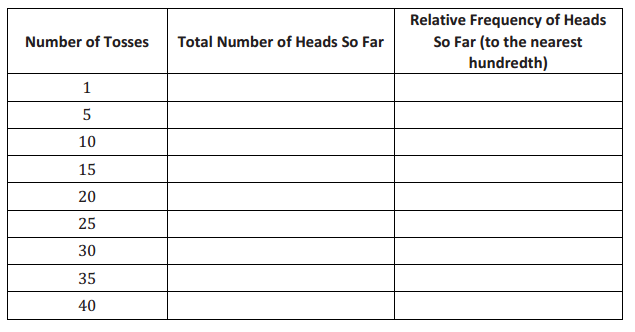
A. A piece of paper with a 5 is drawn from the bag.
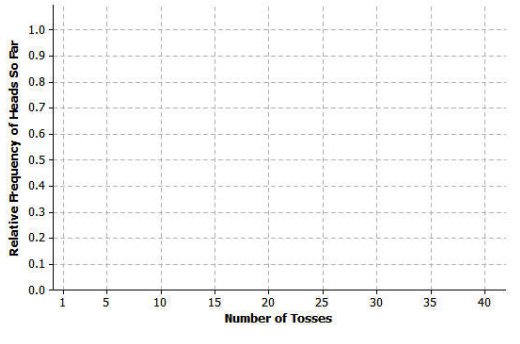
B. A piece of paper with an even number is drawn.
C. A piece of paper with a 12 is drawn.
D. A piece of paper with a number other than 1 is drawn.
E. A piece of paper with a number divisible by 5 is drawn.
Answer:
Eureka Math Grade 7 Module 5 Lesson 1 Exit Ticket Answer Key 2
The numbers from 1 to 10 are written on small pieces of paper and placed in a bag. A piece of paper will be drawn from the bag.
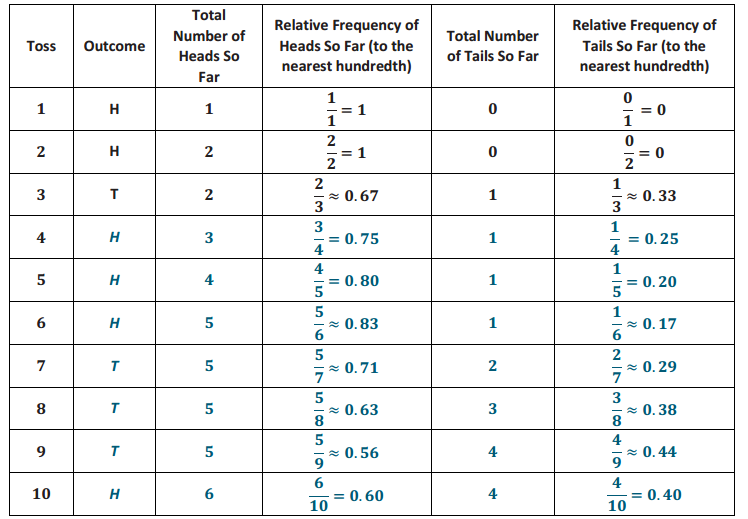
A. A piece of paper with a 5 is drawn from the bag.
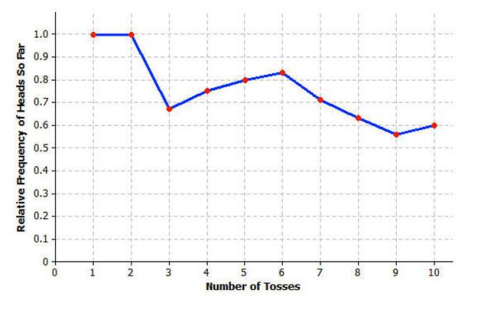
B. A piece of paper with an even number is drawn.
C. A piece of paper with a 12 is drawn.
D. A piece of paper with a number other than 1 is drawn.
E. A piece of paper with a number divisible by 5 is drawn.

Eureka Math Grade 7 Module 5 Lesson 3 Answer Key

Engage NY Eureka Math 7th Grade Module 5 Lesson 3 Answer Key

Eureka Math Grade 7 Module 5 Lesson 3 Example Answer Key

Example 2: Equally Likely Outcomes
The sample space for the paper cup toss was on its side, right side up, and upside down.
The outcomes of an experiment are equally likely to occur when the probability of each outcome is equal.
Toss the paper cup 30 times, and record in a table the results of each toss.
Engage NY Math 7th Grade Module 5 Lesson 3 Example Answer Key 1
Answer:
Engage NY Math 7th Grade Module 5 Lesson 3 Example Answer Key 2

Eureka Math Grade 7 Module 5 Lesson 3 Exercise Answer Key

Exercises 1–6
Jamal, a seventh grader, wants to design a game that involves tossing paper cups. Jamal tosses a paper cup five times and records the outcome of each toss. An outcome is the result of a single trial of an experiment.
Here are the results of each toss:
Engage NY Math Grade 7 Module 5 Lesson 3 Exercise Answer Key 1
Jamal noted that the paper cup could land in one of three ways: on its side, right side up, or upside down. The collection of these three outcomes is called the sample space of the experiment. The sample space of an experiment is the set of all possible outcomes of that experiment.
For example, the sample space when flipping a coin is heads, tails.
The sample space when drawing a colored cube from a bag that has 3 red, 2 blue, 1 yellow, and 4 green cubes is red, blue, yellow, green.

For each of the following chance experiments, list the sample space (i.e., all the possible outcomes).
Exercise 1.
Drawing a colored cube from a bag with 2 green, 1 red, 10 blue, and 3 black
Answer:
Green, red, blue, black

Exercise 2.
Tossing an empty soup can to see how it lands
Answer:
Right side up, upside down, on its side

Exercise 3.
Shooting a free throw in a basketball game
Answer:
Made shot, missed shot

Exercise 4.
Rolling a number cube with the numbers 1–6 on its faces
Answer:
1, 2, 3, 4, 5, or 6

Exercise 5.
Selecting a letter from the word probability
Answer:
p, r, o, b, a, i, I, t, y

Exercise 6.
Spinning the spinner:
Engage NY Math Grade 7 Module 5 Lesson 3 Exercise Answer Key 2
Answer:
1, 2, 3, 4, 5, 6, 7, 8

Exercises 7–12
Exercise 7.
Using the results of your experiment, what is your estimate for the probability of a paper cup landing on its side?
Answer:
Answers will vary. The probability for the sample provided is \(\frac{19}{30}\).

Exercise 8.
Using the results of your experiment, what is your estimate for the probability of a paper cup landing upside down?
Answer:
Answers will vary. The probability for the sample provided is \(\frac{5}{30}\), or \(\frac{1}{6}\).

Exercise 9.
Using the results of your experiment, what is your estimate for the probability of a paper cup landing right side up?
Answer:
Answers will vary. The probability for the sample provided is \(\frac{6}{30}\), or \(\frac{1}{5}\).

Exercise 10.
Based on your results, do you think the three outcomes are equally likely to occur?
Answer:
Answers will vary, but, according to the sample provided, the outcomes are not equally likely.

Exercise 11.
Using the spinner below, answer the following questions.
Engage NY Math Grade 7 Module 5 Lesson 3 Exercise Answer Key 3
a. Are the events spinning and landing on 1 or 2 equally likely?
b. Are the events spinning and landing on 2 or 3 equally likely?
c. How many times do you predict the spinner will land on each section after 100 spins?
Answer:
a. Yes. The areas of sections 1 and 2 are equal.
b. No. The areas of sections 2 and 3 are not equal.
c. Based on the areas of the sections, approximately 25 times each for sections 1 and 2 and 50 times for section 3.

Exercise 12.
Draw a spinner that has 3 sections that are equally likely to occur when the spinner is spun. How many times do you think the spinner will land on each section after 100 spins?
Answer:
The three sectors should be equal in area. Expect the spinner to land on each section approximately 33 times (30–35 times).
Engage NY Math Grade 7 Module 5 Lesson 3 Exercise Answer Key 4

Eureka Math Grade 7 Module 5 Lesson 3 Problem Set Answer Key

Question 1.
For each of the following chance experiments, list the sample space (all the possible outcomes).
a. Rolling a 4-sided die with the numbers 1–4 on the faces of the die
b. Selecting a letter from the word mathematics
c. Selecting a marble from a bag containing 50 black marbles and 45 orange marbles
d. Selecting a number from the even numbers 2–14, including 2 and 14
e. Spinning the spinner below:
Eureka Math 7th Grade Module 5 Lesson 3 Problem Set Answer Key 1
Answer:
a. 1, 2, 3, 4
b. m, a, t, h, e, i, c, s
c. Black, orange
d. 2, 4, 6, 8, 10, 12, 14
e. 1, 2, 3, 4

Question 2.
For each of the following, decide if the two outcomes listed are equally likely to occur. Give a reason for your answer.
a. Rolling a 1 or a 2 when a 6-sided number cube with the numbers 1–6 on the faces of the cube is rolled
b. Selecting the letter a or k from the word take
c. Selecting a black or an orange marble from a bag containing 50 black and 45 orange marbles
d. Selecting a 4 or an 8 from the even numbers 2–14, including 2 and 14
e. Landing on a 1 or a 3 when spinning the spinner below
Eureka Math 7th Grade Module 5 Lesson 3 Problem Set Answer Key 2
Answer:
a. Yes. Each has the same chance of occurring.
b. Yes. Each has the same chance of occurring.
c. No. Black has a slightly greater chance of being chosen.
d. Yes. Each has the same chance of being chosen.
e. No. 1 has a larger area, so it has a greater chance of occurring.

Question 3.
Color the squares below so that it would be equally likely to choose a blue or yellow square.
Eureka Math 7th Grade Module 5 Lesson 3 Problem Set Answer Key 3
Answer:
Answers will vary, but students should have the same number of squares colored blue as they have colored yellow.

Question 4.
Color the squares below so that it would be more likely to choose a blue than a yellow square.
Eureka Math 7th Grade Module 5 Lesson 3 Problem Set Answer Key 4
Answer:
Answers will vary. Students should have more squares colored blue than yellow.

Question 5.
You are playing a game using the spinner below. The game requires that you spin the spinner twice. For example, one outcome could be yellow on the 1st spin and red on the 2nd spin. List the sample space (all the possible outcomes) for the two spins.
Eureka Math 7th Grade Module 5 Lesson 3 Problem Set Answer Key 5
Answer:
Eureka Math 7th Grade Module 5 Lesson 3 Problem Set Answer Key 6

Question 6.
List the sample space for the chance experiment of flipping a coin twice.
Answer:
There are four possibilities:
Eureka Math 7th Grade Module 5 Lesson 3 Problem Set Answer Key 7

Eureka Math Grade 7 Module 5 Lesson 3 Exit Ticket Answer Key

The numbers 1–10 are written on note cards and placed in a bag. One card will be drawn from the bag at random.
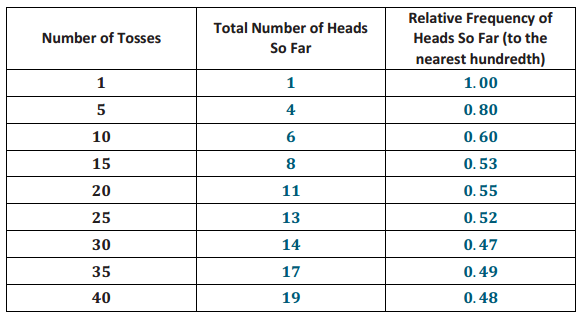
Question 1.
List the sample space for this experiment.
Answer:
1, 2, 3, 4, 5, 6, 7, 8, 9, 10

Question 2.
Are the events selecting an even number and selecting an odd number equally likely? Explain your answer.
Answer:
Yes. Each has the same chance of occurring. There are 5 even and 5 odd numbers in the bag.
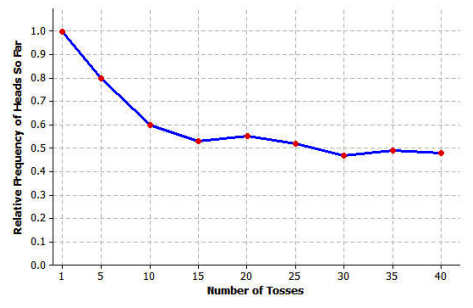
Question 3.
Are the events selecting a number divisible by 3 and selecting a number divisible by 5 equally likely? Explain your answer.
Answer:
No. There are 3 numbers divisible by 3 (3, 6, and 9) but only 2 numbers divisible by 5 (5 and 10). So, the chance of selecting a number divisible by 3 is slightly greater than the chance of selecting a number divisible by 5.

Eureka Math Grade 7 Module 5 Lesson 2 Answer Key

Engage NY Eureka Math 7th Grade Module 5 Lesson 2 Answer Key

Eureka Math Grade 7 Module 5 Lesson 2 Example Answer Key

Example 2: Animal Crackers
A student brought a very large jar of animal crackers to share with students in class. Rather than count and sort all the different types of crackers, the student randomly chose 20 crackers and found the following counts for the different types of animal crackers. Estimate the probability of selecting a zebra.
Engage NY Math 7th Grade Module 5 Lesson 2 Example Answer Key 1
Answer:
The estimated probability of picking a zebra is 3/20, or 0.15 or 15%. This means that an estimate of the proportion of the time a zebra will be selected is 0.15 or 15% of the time. This could be written as P(zebra) = 0.15, or the probability of selecting a zebra is 0.15.

Eureka Math Grade 7 Module 5 Lesson 2 Exercise Answer Key

Exercises 1–8: Carnival Game
At the school carnival, there is a game in which students spin a large spinner. The spinner has four equal sections numbered 1–4 as shown below. To play the game, a student spins the spinner twice and adds the two numbers that the spinner lands on. If the sum is greater than or equal to 5, the student wins a prize.
Engage NY Math Grade 7 Module 5 Lesson 2 Exercise Answer Key 1
Play this game with your partner 15 times. Record the outcome of each spin in the table below.
Engage NY Math Grade 7 Module 5 Lesson 2 Exercise Answer Key 2
Engage NY Math Grade 7 Module 5 Lesson 2 Exercise Answer Key 3
Exercise 1.
Out of the 15 turns, how many times was the sum greater than or equal to 5?
Answer:
Answers will vary and should reflect the results from students playing the game 15 times. In the example above, eight outcomes had a sum greater than or equal to 5.

Exercise 2.
What sum occurred most often?
Answer:
5 occurred the most.

Exercise 3.
What sum occurred least often?
Answer:
6 and 8 occurred the least. (Anticipate a range of answers, as this was only done 15 times. We anticipate that 2 and 8 will not occur as often.)

Exercise 4.
If students were to play a lot of games, what fraction of the games would they win? Explain your answer.
Answer:
Based on the above outcomes, \(\frac{8}{15}\) represents the fraction of outcomes with a sum of 5 or more. To determine this, count how many games have a sum of 5 or more. There are 8 games out of the total 15 that have a sum of 5 or more.

Exercise 5.
Name a sum that would be impossible to get while playing the game.
Answer:
Answers will vary. One possibility is getting a sum of 100. Any sum less than 2 or greater than 8 would be correct.

Exercise 6.
What event is certain to occur while playing the game?
Answer:
Answers will vary. One possibility is getting a sum between 2 and 8 because all possible sums are between 2 and 8, inclusive.

When you were spinning the spinner and recording the outcomes, you were performing a chance experiment. You can use the results from a chance experiment to estimate the probability of an event. In Exercise 1, you spun the spinner 15 times and counted how many times the sum was greater than or equal to 5. An estimate for the probability of a sum greater than or equal to 5 is
P(sum ≥5) = \(\frac{\text { Number of observed occurrences of the event }}{\text { Total number of observations }}\)
Exercise 7.
Based on your experiment of playing the game, what is your estimate for the probability of getting a sum of 5 or more?
Answer:
Answers will vary. Students should answer this question based on their results. For the results indicated above, \(\frac{8}{15}\) or approximately 0.53 or 53% would estimate the probability of getting a sum of 5 or more.

Exercise 8.
Based on your experiment of playing the game, what is your estimate for the probability of getting a sum of exactly 5?
Answer:
Answers will vary. Students should answer this question based on their results. Using the above 15 outcomes, \(\frac{4}{15}\) or approximately 0.27 or 27% of the time represents an estimate for the probability of getting a sum of exactly 5.

Exercises 9–15
If a student randomly selected a cracker from a large jar:
Exercise 9.
What is your estimate for the probability of selecting a lion?
Answer:
\(\frac{2}{20}\) = \(\frac{1}{10}\) = 0.1

Exercise 10.
What is your estimate for the probability of selecting a monkey?
Answer:
\(\frac{4}{20}\) = \(\frac{1}{5}\) = 0.2

Exercise 11.
What is your estimate for the probability of selecting a penguin or a camel?
Answer:
\(\frac{(3+1)}{20}\) = \(\frac{4}{20}\) = \(\frac{1}{5}\) = 0.2

Exercise 12.
What is your estimate for the probability of selecting a rabbit?
Answer:
\(\frac{0}{20}\) = 0

Exercise 13.
Is there the same number of each kind of animal cracker in the jar? Explain your answer.
Answer:
No. There appears to be more elephants than other types of crackers.

Exercise 14.
If the student randomly selected another 20 animal crackers, would the same results occur? Why or why not?
Answer:
Probably not. Results may be similar, but it is very unlikely they would be exactly the same.

Exercise 15.
If there are 500 animal crackers in the jar, how many elephants are in the jar? Explain your answer.
Answer:
\(\frac{5}{20}\) = \(\frac{1}{4}\) = 0 .25; hence, an estimate for the number of elephants would be 125 because 25% of 500 is 125.

Eureka Math Grade 7 Module 5 Lesson 2 Problem Set Answer Key

Question 1.
Play a game using the two spinners below. Spin each spinner once, and then multiply the outcomes together. If the result is less than or equal to 8, you win the game. Play the game 15 times, and record your results in the table below. Then, answer the questions that follow.
Eureka Math 7th Grade Module 5 Lesson 2 Problem Set Answer Key 1
a. What is your estimate for the probability of getting a product of 8 or less?
b. What is your estimate for the probability of getting a product of more than 8?
c. What is your estimate for the probability of getting a product of exactly 8?
d. What is the most likely product for this game?
e. If you play this game another 15 times, will you get the exact same results? Explain.
Answer:
Eureka Math 7th Grade Module 5 Lesson 2 Problem Set Answer Key 6
a. Answers should be approximately 7, 8, or 9 divided by 15. The probability for the sample spins provided is \(\frac{9}{15}\), or \(\frac{3}{5}\).

b. Subtract the answer to part (a) from 1, or 1- the answer from part (a). Approximately 8, 7, or 6 divided by 15. The probability for the sample spins provided is \(\frac{6}{15}\), or \(\frac{2}{5}\).

c. Approximately 1 or 2 divided by 15. The probability for the sample spins provided is \(\frac{1}{15}\).

d. Possibilities are 4, 6, 8, and 12. The most likely product in the sample spins provided is 4.

e. No. Since this is a chance experiment, results could change for each time the game is played.

Question 2.
A seventh-grade student surveyed students at her school. She asked them to name their favorite pets. Below is a bar graph showing the results of the survey.
Eureka Math 7th Grade Module 5 Lesson 2 Problem Set Answer Key 2
Use the results from the survey to answer the following questions.
a. How many students answered the survey question?
b. How many students said that a snake was their favorite pet?

Now, suppose a student is randomly selected and asked what his favorite pet is.
c. What is your estimate for the probability of that student saying that a dog is his favorite pet?
d. What is your estimate for the probability of that student saying that a gerbil is his favorite pet?
e. What is your estimate for the probability of that student saying that a frog is his favorite pet?
Answer:
a. 31
b. 5
c. (Allow any form.) \(\frac{9}{31}\), or approximately 0.29 or approximately 29%
d. (Allow any form.) \(\frac{2}{31}\), or approximately 0.06 or approximately 6%
e. \(\frac{0}{31}\), or 0 or 0%

Question 3.
A seventh-grade student surveyed 25 students at her school. She asked them how many hours a week they spend playing a sport or game outdoors. The results are listed in the table below.
Eureka Math 7th Grade Module 5 Lesson 2 Problem Set Answer Key 3
a. Draw a dot plot of the results.
Eureka Math 7th Grade Module 5 Lesson 2 Problem Set Answer Key 4
Suppose a student will be randomly selected.
b. What is your estimate for the probability of that student answering 3 hours?
c. What is your estimate for the probability of that student answering 8 hours?
d. What is your estimate for the probability of that student answering 6 or more hours?
e. What is your estimate for the probability of that student answering 3 or fewer hours?
f. If another 25 students were surveyed, do you think they would give the exact same results? Explain your answer.
g. If there are 200 students at the school, what is your estimate for the number of students who would say they play a sport or game outdoors 3 hours per week? Explain your answer.
Answer:
a. Eureka Math 7th Grade Module 5 Lesson 2 Problem Set Answer Key 7
b. \(\frac{7}{25}\) = 0.28 = 28%
c. \(\frac{1}{25}\) = 0.04 = 4%
d. \(\frac{3}{25}\) = 0.12 = 12%
e. \(\frac{19}{25}\) = 0.76 = 76%
f. No. Each group of 25 students could answer the question differently.

g. 200 ∙ (\(\frac{7}{25}\)) = 56
I would estimate that 56 students would say they play a sport or game outdoors 3 hours per week. This is based on estimating that, of the 200 students, \(\frac{7}{25}\) would play a sport or game outdoors 3 hours per week, as \(\frac{7}{25}\) represented the probability of playing a sport or game outdoors 3 hours per week from the seventh-grade class surveyed.

Question 4.
A student played a game using one of the spinners below. The table shows the results of 15 spins. Which spinner did the student use? Give a reason for your answer.
Eureka Math 7th Grade Module 5 Lesson 2 Problem Set Answer Key 5
Answer:
Spinner B. Tallying the results: 1 occurred 6 times, 2 occurred 6 times, and 3 occurred 3 times. In Spinner B, the sections labeled 1 and 2 are equal and larger than section 3.

Eureka Math Grade 7 Module 5 Lesson 2 Exit Ticket Answer Key

In the following problems, round all of your decimal answers to three decimal places. Round all of your percents to the nearest tenth of a percent.
A student randomly selected crayons from a large bag of crayons. The table below shows the number of each color crayon in a bag. Now, suppose the student were to randomly select one crayon from the bag.
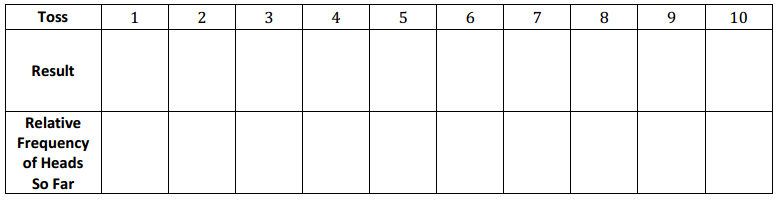
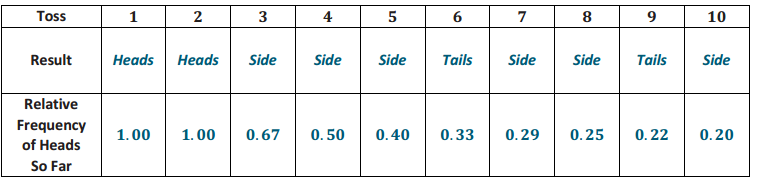
Eureka Math Grade 7 Module 5 Lesson 2 Exit Ticket Answer Key 1
Question 1.
What is the estimate for the probability of selecting a blue crayon from the bag? Express your answer as a fraction, decimal, or percent.
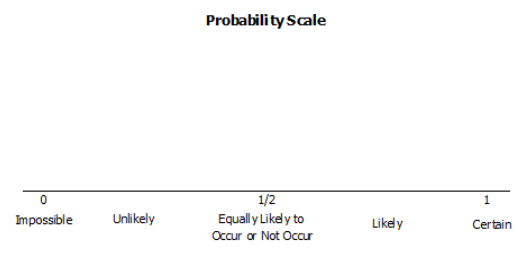
Answer:
\(\frac{5}{30}\) = \(\frac{1}{6}\) ≈ 0.167 or 16.7%

Question 2.
What is the estimate for the probability of selecting a brown crayon from the bag?
Answer:
\(\frac{10}{30}\) = \(\frac{1}{3}\) ≈ 0.333 or 33.3%

Question 3.
What is the estimate for the probability of selecting a red crayon or a yellow crayon from the bag?
Answer:
\(\frac{9}{30}\) = \(\frac{3}{10}\) = 0.3 = 30%

Question 4.
What is the estimate for the probability of selecting a pink crayon from the bag?
Answer:
\(\frac{0}{30}\) = 0%

Question 5.
Which color is most likely to be selected?
Answer:
Brown

Question 6.
If there are 300 crayons in the bag, how many red crayons would you estimate are in the bag? Justify your answer.
Answer:
There are 6 out of 30, or \(\frac{1}{5}\) or 0.2, crayons that are red. Anticipate \(\frac{1}{5}\) of 300 crayons are red, or approximately 60 crayons.